Abstract
Objective
According to the current guidelines, arterial hyperenhancement for diagnosis of hepatocellular carcinoma (HCC) is determined using the arterial phase only. We investigated the optimal definition of arterial hyperenhancement in patients with HCC using computed tomography (CT) and magnetic resonance imaging (MRI).
Materials and Methods
The Institutional Review Board approved this retrospective study. The requirement for informed consent was waived. Between January 2011 and September 2013, 147 consecutive patients with surgically proven HCCs with both pre-operative CT and MRI were included. Identification rates of arterial hyperenhancement on CT and magnetic resonance (MR) images using arterial phase only, dual phase (unenhanced and arterial phases), and also subtraction MR images were assessed qualitatively.
Results
The identification rates for arterial hyperenhancement on CT were significantly different between arterial phase and dual phase (72.8% vs. 90.5%; p < 0.001), whereas the rates were similar on MRI (91.8% vs. 93.9%; p = 0.257). The identification rate of arterial hyperenhancement in MRI increased to 98.6% using subtraction MR images.
Given the varied prevalence and clinical settings, there has been some heterogeneity in the clinical guidelines regarding the method of imaging diagnosis for hepatocellular carcinoma (HCC) (123456). However, all methods used to diagnose HCC are based on the imaging diagnostic hallmarks of arterial enhancement and portal-delayed washout, as key alterations during hepatocarcinogenesis include elevated arterial flow and reduced portal venous flow (7). Arterial phase hyperenhancement is defined as enhancement in the arterial phase that is unequivocally greater than that of the surrounding liver according to the current major guidelines (12).
On the basis of these guidelines, the nodule with absolute arterial enhancement, low density, or signal intensity (SI) on unenhanced phase that subsequently shows iso-density or iso SI on arterial phase cannot be diagnosed as HCC in computed tomography (CT) or magnetic resonance imaging (MRI) because only the arterial phase is used to determine arterial enhancement. Several previous studies have evaluated the usefulness of absolute arterial enhancement on CT (8) and dynamic subtraction magnetic resonance (MR) images using unenhanced and arterial phase images (910) to characterize arterial hypervascularity. However, no study has investigated the identification rate of arterial hyperenhancement according to various combinations of image phases and imaging modalities between CT and MRI.
Therefore, the objectives of our study were to compare the identification of hyperenhancement according to various phases on CT and MRI in patients with surgically proven HCCs as a reference standard using qualitative and quantitative imaging analyses.
We conducted a retrospective study at a single tertiary academic center. The Institutional Review Board of Samsung Medical Center approved our study and waived the requirement for informed consent. Patients were selected through a search of our pathology department's registry database. Between January 2011 and September 2013, 597 consecutive patients with surgically proven HCCs were included in our study. Among them, 422 were subsequently excluded for the following reasons: 1) an interval between CT and MRI of more than 30 days (n = 128), 2) lack of pre-operative evaluation of contrast material-enhanced CT (n = 119) or MRI (n = 73), 3) lack of a CT scan with unenhanced images or an MR scan with subtraction images (n = 99), or 4) prior history of HCC treatment with transarterial chemoembolization (n = 3).
Then, all CT and MR images from each patient were preliminarily reviewed by two radiologists (with 20 and 12 years of experience in abdominal imaging, respectively) to exclude patients with inadequate late arterial phase images due to too early scanning (absence of opacification of portal venous system) or motion artifacts because we could not evaluate the arterial enhancement of HCCs using these CT or MR images accurately (11). Two patients with an early arterial phase CT images were excluded. In addition, 26 patients with severe motion artifacts (score of 4–5) or poor quality of subtraction MR images (score of 3–4) were excluded according to the following criteria. A consensus was reached to minimize the classification error of motion artifacts using a five-point scale based on a previous study (12) as follows: score 1, none; score 2, minimal artifact with no effect on image interpretation; 3, moderate artifact with some images but no severe effect on image interpretation; score 4, severe artifact but images still interpretable; and score 5, extensive artifact and images non-diagnostic. The definition of the quality of subtraction MR images was based on the following four-point scale (9): score 1, no or minimal co-registration artifact; score 2, partial co-registration artifact, but sufficient for determination of arterial enhancement of the lesion; score 3, considerable co-registration artifact, lesion visualized with uncertain enhancement; and score 4, marked co-registration artifact, lesion not visualized (Supplementary Materials in the online-only Data Supplement). Finally, 147 (116 men, 31 women; mean age, 55.7 years; range, 34–81 years) with pathologically proven HCCs with preoperative CT and MRI were included (Fig. 1). The mean interval between CT and MRI was 4 days (range, 0–29 days).
Unenhanced and contrast-enhanced triple-phase CT were performed with one of four multi-detector CT machines, including the Somatom Definition Flash 128 (n = 51; Siemens Healthineers, Forchheim, Germany), Philips Brilliance 40 (n = 37; Philips Medical Systems, Cleveland, OH, USA), Toshiba Aquilion 64 (n = 35; Toshiba Medical Systems, Tokyo, Japan), or LightSpeed VCT 64 (n = 24; GE Healthcare, Waukesha, WI, USA). Hepatic arterial phase scanning began 20–40 seconds after injection of 2 mL/kg of body weight of a nonionic iodinated contrast agent (Iomeron 300; Bracco, Imaging S.p.A, Milan, Italy) at a rate of 4 mL/s with a bolus-triggered technique using an automatic power injector. Portal and delayed phase scanning were begun 70 and 180 seconds after the start of the contrast medium injection, respectively. The scanning parameters were as follows: 120 kV (peak), 189×200 mA, table speed of 26.5–39.37 mm/rotation (pitch, 0.828–1.07), 5-mm slice thickness with an increment (overlap) of 2.5 mm, and a single-breath hold helical acquisition time of 4×6 seconds, depending on the liver size.
The MRI examination was performed using a 3.0 Tesla system (Intera Achieva; Philips Healthcare, Best, the Netherlands). Liver MR images were acquired using the following sequences: a T1-weighted three-dimensional (3D) dual gradient-echo sequence, breath-hold multi-shot T2-weighted sequence, and respiratory-triggered single shot T2- and heavily T2-weighted sequence. For dynamic enhancement studies, 0.025 mmol/kg of gadoxetic acid was administered intravenously at a rate of 1 mL/s, followed by a 20 mL saline flush. Real-time MRI fluoroscopic monitoring was used to determine the scanning delay time for arterial phase imaging (13). Unenhanced phase, arterial phase (20–35 seconds), portal phase (60 seconds), transitional phase (3 minutes), and hepatobiliary phase (20 minutes) images were obtained using a T1-weighted 3D gradient-echo sequence (T1 high-resolution isotropic volume examination, eTHRIVE; Philips Healthcare) with a spectral attenuated inversion-recovery fat suppression technique. Subtraction of unenhanced images from arterial phase images was automatically performed by the MR machine using coregistration software (10). The parameters of each pulse sequence are summarized in supplementary Table 1 (in the online-only Data Supplement).
Two radiologists (with 15 and 7 years of experience in abdominal imaging, respectively) independently reviewed the CT and MR images. To minimize the recall bias by each imaging modality, the order of review was randomized in each patient. Prior to image analysis, the radiologists established a review protocol based on previous studies (81014151617). If a patient had multiple HCCs, the largest tumor was used for image analysis. All images were evaluated using adjustment of the optimal window setting on picture archiving and communication system (PACS, Centricity; GE healthcare, Chicago, IL, USA).
The following qualitative visual assessments were used to identify the presence of arterial hyperenhancement in HCCs on CT and MRI. First, the presence of arterial hyperenhancement was reviewed only in arterial phase on each imaging modality. Arterial hyperenhancement was defined as a hyperdense or hyperintense lesion unequivocally greater than the surrounding liver according to the current guidelines (12). Next, unenhanced images with arterial phase images were reviewed to identify absolute arterial enhancement. At this time, arterial hyperenhancement was redefined as increased density or SI of the tumor between the unenhanced and arterial phases by qualitative visual analysis. In addition, the presence of arterial hyperenhancement was assessed in the subtraction MR images generated from the unenhanced and arterial phase images (10). After the first image analysis, any discordant findings between the radiologists were resolved by consensus, and analyses of the identification rate for arterial hyperenhancement were performed based on the final conclusions. Discrepancies between the two radiologists regarding the enhancement pattern of HCC were used for inter-observer agreement analysis. In addition, subgroup analysis was performed according to size with a cutoff of 2.0 cm for assessment of qualitative arterial enhancement.
The mean attenuation value (Hounsfield unit [HU]) and mean SI of each lesion and non-tumor-bearing hepatic parenchyma were measured in unenhanced and arterial phase CTs or MRIs using region-of-interest (ROI) on PACS without annotations stored. These measurements were performed twice by two independent reviewers, and values were averaged to minimize measurement error. If the tumor showed heterogeneous enhancement, ROI measurements were taken at the dominant portion on the unenhanced phase and the largest enhancing portion on the arterial phase. Necrotic components and the tumor capsule were excluded from the measurement of the lesion, and hepatic vasculature and any perfusion change of the surrounding liver were excluded from the measurement of the non-tumor-bearing hepatic parenchyma.
Two methods were used for the quantification of arterial hyperenhancement on CT and MRI based on previous studies (8151617); 1) the absolute HCC enhancement ratio on arterial phase CT, by subtracting the HU of the surrounding parenchyma on arterial phase from that of the lesion on arterial phase, and 2) the relative odds ratio of tumor enhancement using dual phase, where Tart and LVart indicate the tumor and liver parenchyma in the arterial phase, and Tun and LVun indicate the tumor and liver parenchyma in the unenhanced phase. The same methods were used for quantification of arterial enhancement on MRI. In addition, the odds ratio of absolute tumor enhancement was analyzed using CT dual phase
The identification rates for arterial hyperenhancement were calculated using five different qualitative methods in CT and MRI. The identification rates were compared using McNemar test. In addition, our quantitative analysis was performed with a Wilcoxon signed-rank test. To assess the agreement of qualitative arterial hyperenhancement patterns of HCCs and quantitative measurement between the two radiologists, inter-observer agreement was evaluated using Cohen's Kappa coefficient for categorical variables and the intra-class correlation coefficient for continuous variables, as follows: 0.00−0.40, low; 0.41−0.75, moderate; and 0.76−1.00, excellent agreement. Subgroup analysis was limited to arterial phase CT with extracellular contrast media according to the current guidelines (12). For the subgroup analysis, receiver operating characteristic was used to identify the optimal cutoff HU difference between the tumor and the surrounding liver on arterial phase CT that can determine whether arterial enhancement was present or not by qualitative visual analysis. Results were considered significant if p < 0.05. All statistical analyses were performed using SAS version 9.4 (SAS Institute Inc., Cary, NC, USA).
Table 1 summarizes the baseline clinical and imaging characteristics of study patients. Among 147 patients, the most common cause of chronic liver disease was hepatitis B virus infection (82.9%, 122/147). Most patients had well-preserved hepatic function, with a Child-Pugh score of 5 (87.1%, 128/147). The mean index tumor size was 4.2 cm (range, 1.3–17.6 cm). Histopathological HCC grades were determined according to the predominant component, and most patients had moderately differentiated tumors (73.4%, 108/147).
Table 2 demonstrates the imaging characteristics of the HCCs included in this study, and there were significant differences in the proportion of observed tumor density or SI according to the imaging modality (p < 0.05). Using multi-detector CT scans, arterial hyperenhancement of HCCs was found in 107 of 147 patients (72.8%) with arterial phase and in 133 of 147 patients (90.5%) with dual phase. With MRI, arterial hyperenhancement was identified in 135 of 147 (91.8%) patients on arterial phase and in 138 of 147 patients (93.9%) on dual phase. In addition, this identification rate was increased to 98.6% (145/147) when using subtraction MR images (Table 3, Fig. 2). The identification rate for arterial hyperenhancement of HCCs was significantly different between arterial phase and dual phase images in CT scans (72.8% vs. 90.5%; p < 0.001), but the corresponding rates were similar between the two phase images in MRI (91.8% vs. 93.9%; p = 0.257) (Table 3, Figs. 3, 4). According to the tumor size, HCCs equal or smaller than 2.0 cm in size less frequently showed arterial enhancement on CT findings seen typically in larger HCCs (Supplementary Tables 2, 3 in the online-only Data Supplement).
The absolute HCC enhancement ratio on arterial phase was significantly higher in MRI than in CT images (median; 50.26 vs. 27.20; p < 0.001). In addition, the relative odds ratio of HCC enhancement using dual phase in MRI was significantly higher than those in CT images (median; 1.81 vs. 1.67; p = 0.001) (Fig. 5).
The median odds ratio of absolute tumor enhancement using CT dual phase was 3.76 (mean value, 5.4; interquartile range, 2.05–7.20) (Supplementary Fig. 1 in the online-only Data Supplement).
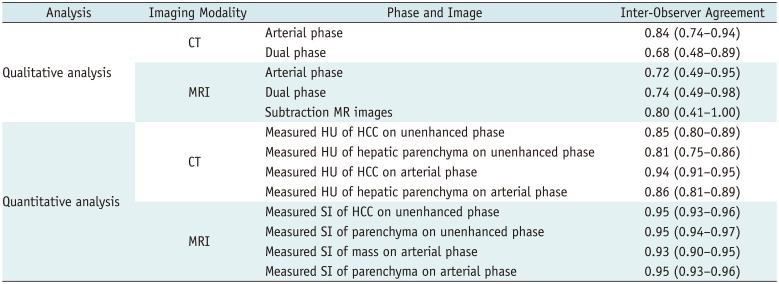
Although arterial phase CT showed the best inter-observer agreement for identification of arterial hyperenhancement (κ = 0.84; 95% confidence interval = 0.74–0.94), other qualitative analysis in CT and MRI also showed moderate to excellent agreement between radiologists. The intra-class correlation coefficient of measured HU or SI of HCCs and the hepatic parenchyma, which was used for quantitative analysis, was excellent, and ranged from 0.81–0.95 (Table 4).
The optimal cut-off value for the determination of arterial enhancement was a more than 8.8 HU difference between the HCC and the surrounding liver on arterial phase CT. This criterion yielded 97.1% sensitivity, 87.5% specificity, and 94.6% accuracy. However, a considerable number of HCCs (25.9%, 38/147) showed less of an HU difference on arterial phase compared to this specific cut-off value.
Our study showed that the identification rate of arterial hyperenhancement in patients with HCCs varied depending on how arterial hyperenhancement on CT and MRI was defined. Visual comparison of arterial and unenhanced phases was significantly superior to conventional qualitative assessment using arterial phase alone for determining arterial hyperenhancement of HCCs in CT images, whereas the two methods did not differ significantly using MR images. The identification rate of arterial hyperenhancement was highest when subtraction MR images were used.
Diffusion restriction, mosaic architecture, nodule-in-nodule appearance, and rim enhancement can be suggested as ancillary imaging findings of HCC (518). However, arterial hyperenhancement and portal or delayed wash-out are the most important imaging characteristics based on the unique histopathological features of HCC, which is increased unpaired arterial blood flow with decreased portal flow during hepato-carcinogenesis (719). Our qualitative results showed that arterial hyperenhancement of HCCs was relatively poorly identified by arterial phase CT compared to four other diagnostic methods. As the accuracy of qualitative imaging interpretation can be influenced by adjacent liver attenuation or the tumor itself (20), HCCs with isodensity or SI on arterial phases can make it difficult for radiologists to determine whether arterial enhancement is present. In our results, among 40 HCCs with iso- or hypodensity on arterial phase CT, 28 (70%) were changed to “arterial hyper-enhancement present” after visual comparison of the unenhanced and arterial phase images. Similarly, a previous study reported that the utility of unenhanced CT images was improved with the detection of arterial hyperenhancement of HCC (8). Therefore, the definition of arterial enhancement for HCC diagnosis in CT images should be established differently unlike current clinical guidelines (12345) due to insufficient identification rate of arterial enhancement.
In our results, subtraction MR images showed the best diagnostic performance for identification of arterial hyperenhancement in patients with HCCs. Two HCCs with hyper SI and one HCC with iso SI on unenhanced MR phase, which was considered to be the absence of arterial hyperenhancement even in dual phase MR images, were determined to have arterial hyperenhancement on subtraction MR images because only the hyperintensity due to contrast enhancement remained in subtraction MRI (9). In line with these results, previous studies emphasized the usefulness of subtraction MRI for HCC diagnosis by more accurate detection of arterial hyperenhancement (1021). It is well known that some well-differentiated small HCCs may appear as hypovascular lesions representing the absence of arterial hyperenhancement (22). However, our subtraction MR images identified arterial hyperenhancement in all 11 well-differentiated HCCs. Thus, subtraction MR images could maximize the qualitative recognition of lesion enhancement and overcome the limitation of visual comparison.
The quantitative imaging analysis demonstrated that the relative odds ratio of HCC enhancement using dual phase and absolute HCC enhancement ratio on arterial phase were significantly higher in MRI than in CT images. These results can support our qualitative imaging analysis results, which showed that the identification rates of arterial hyper-enhancement in MRI were better than those in CT images, regardless of phase selection. Similarly, although a recent meta-analysis (23) did not focus on the identification of arterial hyperenhancement of the lesion, the authors reported that MRI showed a higher per-lesion sensitivity than multi-detector CT for HCC diagnosis. It may be that MRI has inherently better contrast resolution compared to multi-detector CT images (24). Moreover, exclusive use of 3-Tesla MRI in the present study may contribute to these results.
In the subgroup analysis, identification of arterial enhancement on arterial phase CT images was effectively identified by observers when the difference of HU between the HCC and the background liver was greater than 8.8 HU. However, a considerable number of HCCs (25.9%, 38/147) showed less HU difference than the specific cut-off value. Based on these results, the qualitative analysis of arterial phase of CT may be a less effective method for diagnosis of HCC in patients with relatively weak arterial enhancing tumor, especially when the HU difference between the tumor and the background liver was less than 8.8 HU on arterial phase of CT since such weak arterial enhancement may lead to false negative diagnosis of HCC. In this situation, additional qualitative comparison of arterial and unenhanced CT phases or quantitative measurement of tumor enhancement on arterial phase CT may be helpful for diagnosing HCC. In addition, MRI could be another option because it showed a better performance in identifying arterial hypervascularity.
There are several limitations to our study. First, there is a possibility of selection bias related to the retrospective design. Second, the cohort only consisted of surgically proven HCCs. Thus, we could not evaluate the true diagnostic performance of CT or MRI in patients with HCC according to the definition of arterial hyperenhancement. According to the modified definition of arterial hypervascularity using dual phase images, specificity of HCC diagnosis may be decreased by the possibility of pseudo-arterial enhancement in some cirrhotic nodules including high-grade dysplastic nodule. Third, we did not consider the cost-effectiveness of each test or the radiation issues caused by additional acquisition of an unenhanced CT scan. More evidence provided through prospective trials is needed to optimize the definition of detection for arterial hyper-enhancement of HCCs in patients with chronic liver disease beyond the current clinical guidelines (12345).
In conclusion, dual phase assessment was significantly superior to conventional arterial phase only assessment for determining the presence of arterial hyperenhancement on CT, whereas the two methods were similar on MRI in patients with HCCs. Thus, visual comparison of arterial and unenhanced phases could be recommended instead of conventional qualitative arterial phase alone assessment to determine arterial hyper-enhancement of HCCs, especially when using CT.
References
1. Bruix J, Sherman M. Management of hepatocellular carcinoma: an update. Hepatology. 2011; 53:1020–1022. PMID: 21374666.

2. European Association For The Study Of The Liver. European Organisation For Research And Treatment Of Cancer. EASL-EORTC clinical practice guidelines: management of hepatocellular carcinoma. J Hepatol. 2012; 56:908–943. PMID: 22424438.
3. Kokudo N, Hasegawa K, Akahane M, Igaki H, Izumi N, Ichida T, et al. Evidence-based clinical practice guidelines for hepatocellular carcinoma: the Japan Society of Hepatology 2013 update (3rd JSH-HCC Guidelines). Hepatol Res. 2015; 45.

4. Korean Liver Cancer Study Group (KLCSG). National Cancer Center, Korea (NCC). 2014 KLCSG-NCC Korea practice guideline for the management of hepatocellular carcinoma. Gut Liver. 2015; 9:267–317. PMID: 25918260.
5. Korean Society of Abdominal Radiology. Diagnosis of hepatocellular carcinoma with gadoxetic acid-enhanced MRI: 2016 consensus recommendations of the Korean Society of Abdominal Radiology. Korean J Radiol. 2017; 18:427–443. PMID: 28458595.
6. Yoon JH, Park JW, Lee JM. Noninvasive diagnosis of hepatocellular carcinoma: elaboration on Korean Liver Cancer Study Group-National Cancer Center Korea practice guidelines compared with other guidelines and remaining issues. Korean J Radiol. 2016; 17:7–24. PMID: 26798212.

7. Park YN. Update on precursor and early lesions of hepatocellular carcinomas. Arch Pathol Lab Med. 2011; 135:704–715. PMID: 21631263.

8. Hennedige T, Yang ZJ, Ong CK, Venkatesh SK. Utility of non-contrast-enhanced CT for improved detection of arterial phase hyperenhancement in hepatocellular carcinoma. Abdom Imaging. 2014; 39:1247–1254. PMID: 24943135.

9. Yu JS, Kim YH, Rofsky NM. Dynamic subtraction magnetic resonance imaging of cirrhotic liver: assessment of high SIlesions on nonenhanced T1-weighted images. J Comput Assist Tomogr. 2005; 29:51–58. PMID: 15665683.
10. An C, Park MS, Kim D, Kim YE, Chung WS, Rhee H, et al. Added value of subtraction imaging in detecting arterial enhancement in small (<3 cm) hepatic nodules on dynamic contrast-enhanced MRI in patients at high risk of hepatocellular carcinoma. Eur Radiol. 2013; 23:924–930. PMID: 23138382.
11. Bashir MR, Castelli P, Davenport MS, Larson D, Marin D, Hussain HK, et al. Respiratory motion artifact affecting hepatic arterial phase MR imaging with gadoxetate disodium is more common in patients with a prior episode of arterial phase motion associated with gadoxetate disodium. Radiology. 2015; 274:141–148. PMID: 25162310.

12. Davenport MS, Viglianti BL, Al-Hawary MM, Caoili EM, Kaza RK, Liu PS, et al. Comparison of acute transient dyspnea after intravenous administration of gadoxetate disodium and gadobenate dimeglumine: effect on arterial phase image quality. Radiology. 2013; 266:452–461. PMID: 23192781.

13. Haradome H, Grazioli L, Tsunoo M, Tinti R, Frittoli B, Gambarini S, et al. Can MR fluoroscopic triggering technique and slow rate injection provide appropriate arterial phase images with reducing artifacts on gadoxetic acid-DTPA (Gd-EOB-DTPA)-enhanced hepatic MR imaging? J Magn Reson Imaging. 2010; 32:334–340. PMID: 20677259.

14. Grazioli L, Bondioni MP, Haradome H, Motosugi U, Tinti R, Frittoli B, et al. Hepatocellular adenoma and focal nodular hyperplasia: value of gadoxetic acid-enhanced MR imaging in differential diagnosis. Radiology. 2012; 262:520–529. PMID: 22282184.

15. Roux M, Pigneur F, Calderaro J, Baranes L, Chiaradia M, Tselikas L, et al. Differentiation of focal nodular hyperplasia from hepatocellular adenoma: role of the quantitative analysis of gadobenate dimeglumine-enhanced hepatobiliary phase MRI. J Magn Reson Imaging. 2015; 42:1249–1258. PMID: 25851028.

16. Haimerl M, Wächtler M, Zeman F, Verloh N, Platzek I, Schreyer AG, et al. Quantitative evaluation of enhancement patterns in focal solid liver lesions with Gd-EOB-DTPA-enhanced MRI. PLoS One. 2014; 9:e100315. PMID: 24950259.

17. Taouli B, Johnson RS, Hajdu CH, Oei MT, Merad M, Yee H, et al. Hepatocellular carcinoma: perfusion quantification with dynamic contrast-enhanced MRI. AJR Am J Roentgenol. 2013; 201:795–800. PMID: 24059368.

18. Choi JY, Lee JM, Sirlin CB. CT and MR imaging diagnosis and staging of hepatocellular carcinoma: part II. Extracellular agents, hepatobiliary agents, and ancillary imaging features. Radiology. 2014; 273:30–50. PMID: 25247563.

19. Coleman WB. Mechanisms of human hepatocarcinogenesis. Curr Mol Med. 2003; 3:573–588. PMID: 14527088.

20. Hamer OW, Aguirre DA, Casola G, Lavine JE, Woenckhaus M, Sirlin CB. Fatty liver: imaging patterns and pitfalls. Radiographics. 2006; 26:1637–1653. PMID: 17102041.

21. Seçil M, Obuz F, Altay C, Gencel O, Iğci E, Sağol O, et al. The role of dynamic subtraction MRI in detection of hepatocellular carcinoma. Diagn Interv Radiol. 2008; 14:200–204. PMID: 19061165.
22. Sugimoto K, Kim SR, Imoto S, Tohyama M, Kim SK, Matsuoka T, et al. Characteristics of hypovascular versus hypervascular well-differentiated hepatocellular carcinoma smaller than 2 cm - Focus on tumor size, markers and imaging detectability. Dig Dis. 2015; 33:721–727. PMID: 26488580.

23. Lee YJ, Lee JM, Lee JS, Lee HY, Park BH, Kim YH, et al. Hepatocellular carcinoma: diagnostic performance of multidetector CT and MR imaging-a systematic review and meta-analysis. Radiology. 2015; 275:97–109. PMID: 25559230.

24. Kim SH, Kim SH, Lee J, Kim MJ, Jeon YH, Park Y, et al. Gadoxetic acid-enhanced MRI versus triple-phase MDCT for the preoperative detection of hepatocellular carcinoma. AJR Am J Roentgenol. 2009; 192:1675–1681. PMID: 19457834.

Supplementary Materials
The online-only Data Supplement is available with this article at https://doi.org/10.3348/kjr.2018.0339.
SUPPLEMENTARY MATERIALS
The maximum perpendicular length of the subtraction band artifact in each of the four quadrants on the liver surface at the level of the junction of the inferior vena cava and the hepatic veins was measured to evaluate the co-registration artifact of the subtraction image (14). The median maximum perpendicular length of the subtraction band artifact representing the co-registration artifact of subtraction magnetic resonance images was 0.8 cm in 147 patients (range, 0–3.2 cm).
Supplementary Table 2
Comparison of Identification Rates of Arterial Hyperenhancement in 27 HCCs (≤ 2 cm) According to Various CT or MRI Diagnostic Methods
Supplementary Table 3
Comparison of Identification Rates of Arterial Hyperenhancement in 120 HCCs (> 2 cm) According to Various CT or MRI Diagnostic Methods
Supplementary Fig. 1
Histogram showing odds ratio of quantitative imaging analysis of absolute tumor enhancement using CT dual phase. Median odds ratio of absolute tumor enhancement using CT dual phase is 3.76 (mean value, 5.4; interquartile range, 2.05–7.20). CT = computed tomography
Fig. 1
Flow diagram for patient selection.
CT = computed tomography, HCCs = hepatocellular carcinomas, MR = magnetic resonance, MRI = magnetic resonance imaging, TACE = transarterial chemoembolization
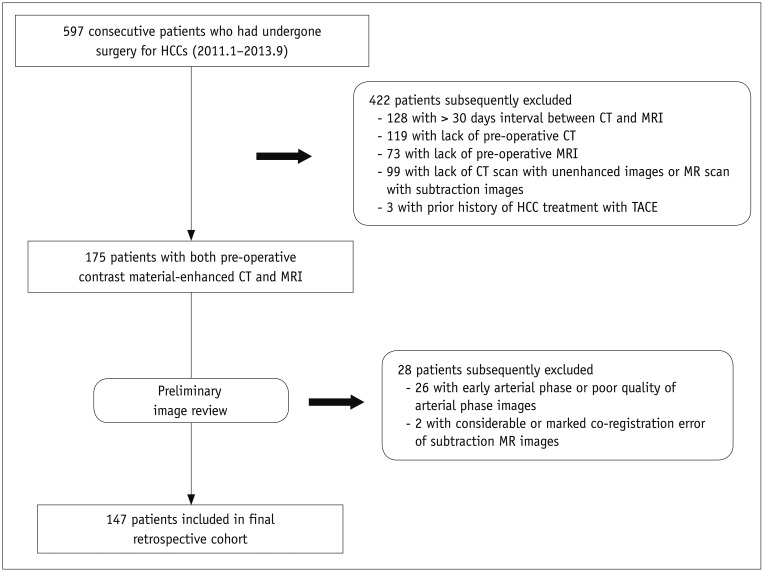
Fig. 2
Map showing identification of qualitative arterial hyperenhancement of HCCs according to used phase and imaging modality by consensus of two radiologists.
Numbers in blue boxes represent changes in HCC attenuation or SI compared with surrounding liver on arterial phase. Numbers in green boxes indicate changes in presence of arterial hyperenhancement using dual phase images. Numbers in yellow boxes indicate changes in presence of arterial hyperenhancement using subtraction images. Some HCCs with weak arterial enhancement were not identified on even use of dual phase images. Arterial (−) = absence of arterial hyperenhancement, Arterial (+) = presence of arterial hyperenhancement, N.A. = not-available, SI = signal intensity
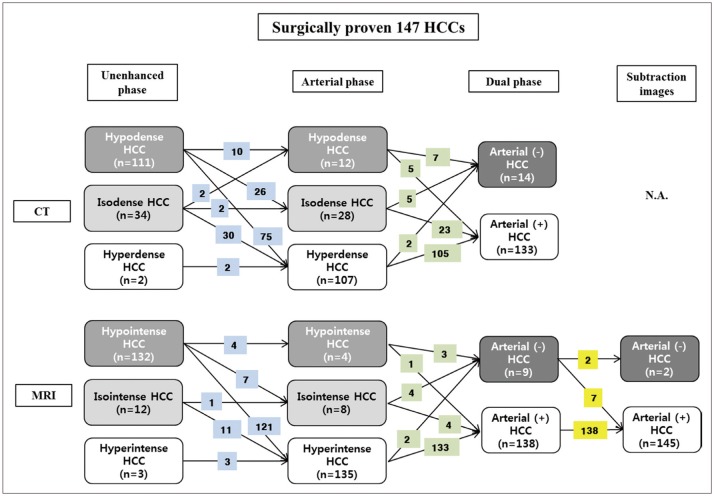
Fig. 3
Images of 54-year-old man with no arterial enhancement of HCC in arterial phase CT images.
A. Unenhanced CT showed 2.9-cm HCC (asterisk) in segment VIII of liver. Black arrow indicates portal vein. B. On arterial phase, mass (asterisk) showed no arterial enhancement compared to surrounding liver. Enhancement of peripheral portal vein represents appropriate late arterial phase (black arrow). Neither radiologist identified arterial enhancement based on arterial phase CT images. Measured absolute HCC enhancement ratio on arterial phase CT was −6.8%. C. On T1-weighted unenhanced MR image, mass (asterisk) showed hypointensity compared to surrounding liver. D. On arterial phase MR image, mass (asterisk) was hyperintense to surrounding liver, representing arterial enhancement. Measured absolute HCC enhancement ratio on arterial phase MR images was 38.2%. E. Subtraction MR image clearly displayed arterial enhancement of index tumor (asterisk).
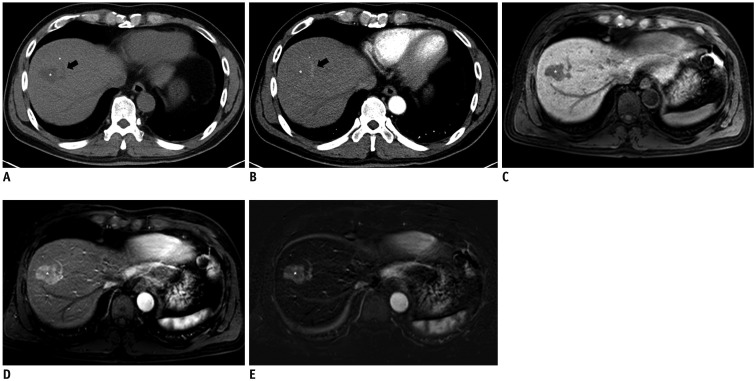
Fig. 4
Images of 42-year-old man with absence of arterial hyperenhancement of HCC in arterial phase CT and MR images.
A. Unenhanced CT shows 4.8-cm HCC (asterisk) in segment V of liver. B. On arterial phase, mass (asterisk) showed no arterial hyperenhancement compared to surrounding liver. Measured absolute HCC enhancement ratio on arterial phase CT was −17.9%. C. On T1-weighted unenhanced MR image, mass (asterisk) was hypointense to surrounding liver. D. On arterial phase MR images, mass (asterisk) showed near-iso SI compared to surrounding liver. Neither radiologist identified arterial hyperenhancement based on arterial phase MR images. However, measured absolute HCC enhancement ratio on arterial phase MRI was 10.6%. E. Subtraction MR image showed peripheral arterial enhancing portion clearly within index tumor (asterisk), which can be differentiated with tumor capsule enhancement.
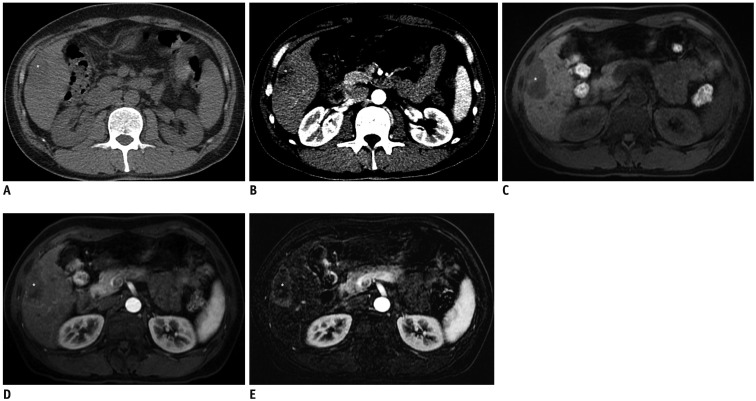
Fig. 5
Histogram of quantitative imaging analyses according to imaging modality.
A. Absolute HCC enhancement ratio on arterial phase (median values; MRI = 50.26 vs. CT = 27.20; p < 0.001). B. Relative odds ratio of HCC enhancement on dual phases (median values: MRI = 1.81 vs. CT = 1.67; p = 0.001).
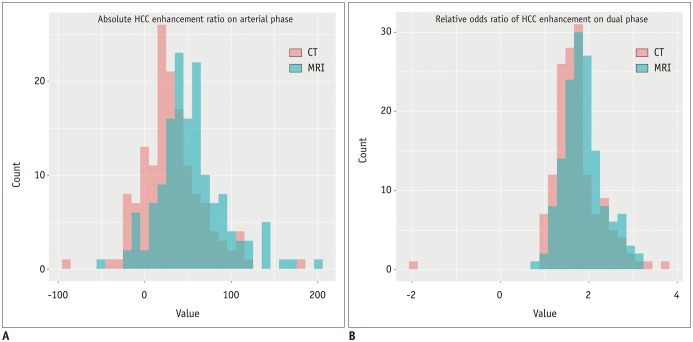
Table 1
Clinical Characteristics of Study Patients
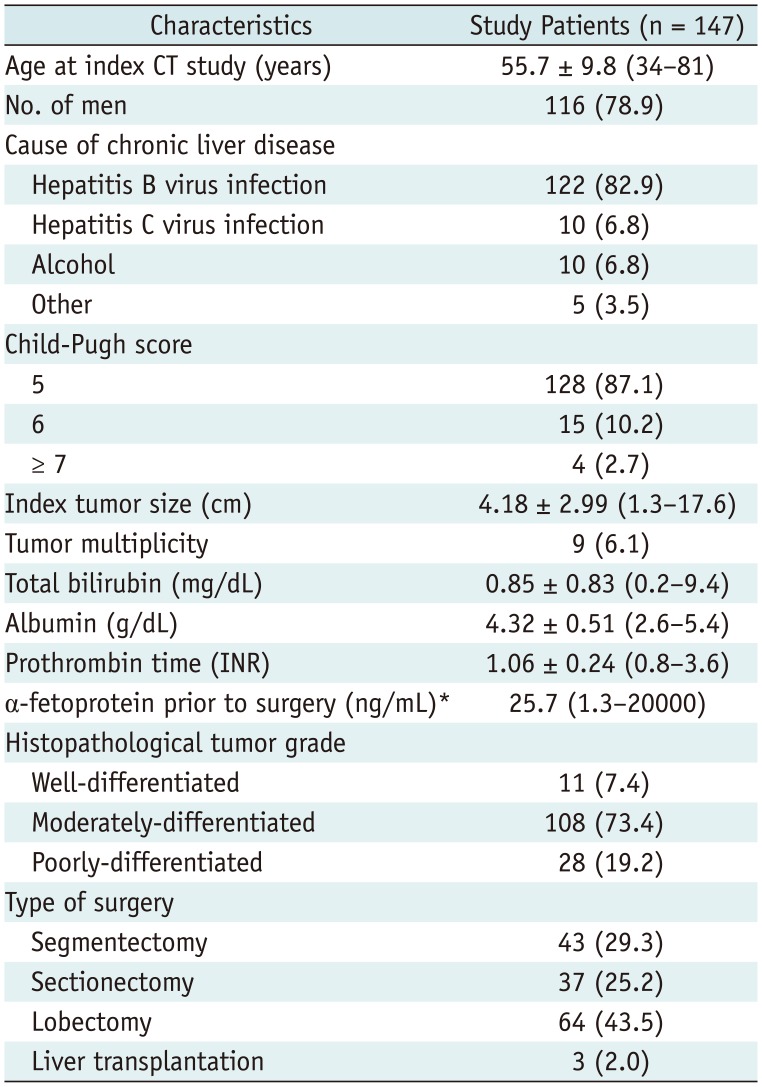
Table 2
Imaging Characteristics of 147 HCCs on CT and MRI
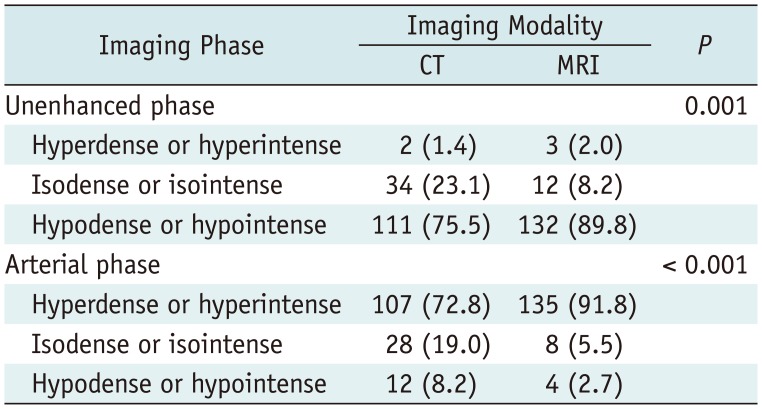
Table 3
Comparison of Identification Rate of Arterial Hyperenhancement of HCCs According to Phase in CT and MRI

Table 4
Inter-Observer Agreement of Qualitative and Quantitative Analysis


 PDF
PDF ePub
ePub Citation
 Print
Print


 XML Download