

 PDF
PDF ePub
ePub Citation
 Print
Print


INTRODUCTION
Chronic obstructive pulmonary disease (COPD) is characterized by the presence of airflow limitation that is not fully reversible (1). It is a heterogeneous disease with a long clinical course associated with pulmonary structural changes, including parenchymal destruction and reduction in the caliber of the small airways (2).
Due to the heterogeneity in the composition and progression of emphysema and airway inflammation, evaluation of treatment response remains a challenge. Several methods have been developed to predict the outcome of COPD; the pulmonary function test (PFT), particularly the forced expiratory volume in 1 second (FEV1) and forced vital capacity (FVC) values, is undoubtedly the most widely used outcome variable thus far. However, these tests are highly effort-dependent, cannot distinguish if the airflow limitation is due to emphysema or airway inflammation, and are inadequate as the sole procedure for risk assessment of some adverse events, such as acute exacerbation (3). Quality of life indices have been validated to be sensitive to changes resulting from events such as acute exacerbation of COPD, but these assessments are time-consuming, subjective, and measure merely some aspects of health status (4). CT can separately quantify emphysema, airway dimensions, and air trapping (567) in a single breath hold, with the potential to aid in the process of identifying their relative contribution to the disease process. According to Han et al. (8), the results of a quantitative CT assessment significantly correlate with the COPD exacerbation frequency independent of the severity of airflow limitation. However, to date, few studies have used this approach to assess clinical response after treatment. Since the treatment targets airway disease rather than emphysema, the recently introduced “square root of airway wall area of the theoretical airway with an internal perimeter of 10 mm (Pi10),” a standardized measure of airway wall thickness (910), and air-trapping measurement using the co-registration method, may possibly provide an accurate assessment of the status of small-airway disease.
We hypothesized that quantitative CT methods, including the aforementioned, recently emerging techniques, have the potential to predict clinical improvement in patients with COPD, which would be important for planning adequate personalized management strategies. Therefore, we aimed to determine the predictive factors for treatment responsiveness in patients with COPD after a 1-year follow-up using quantitative analytic techniques at baseline CT.
MATERIALS AND METHODS
This retrospective study was approved by the Institutional Review Board of our center, which waived the requirement for patients' informed consent (approval number: 2015-1164).
Study Population
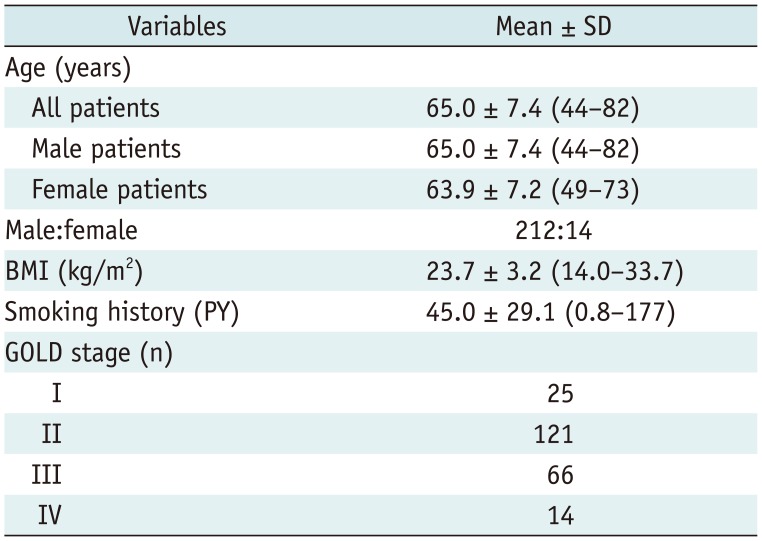
All participants were selected from the Korean Obstructive Lung Disease cohort (11); this cohort included patients with COPD prospectively recruited from 17 hospitals in South Korea between June 2005 and October 2013. The inclusion criteria in this study were as follows: 1) diagnosis of COPD in accordance with the Global initiative for chronic Obstructive Lung Disease (GOLD) criteria (1); 2) availability of baseline CT scans; and 3) availability of PFT results at baseline and after 1 year of follow-up. The exclusion criteria were as follows: 1) any current diagnosis of other respiratory conditions, including asthma; 2) insufficient washout period for the prescribed COPD medication with a possible risk of carryover; and 3) suboptimal image quality or severe post-infectious sequelae or large bullae. On the basis of these criteria, 226 patients (212 men and 14 women; mean age, 65.0 ± 7.4 years) were included (Fig. 1). Baseline characteristics of the study population are presented in Table 1.
With regard to the treatment interval, patients were treated twice daily for 3 months with a combination of long-acting beta-agonists and corticosteroids (long-acting beta-agonists, salmeterol [50 µg] or formoterol [9 µg]; corticosteroids, fluticasone propionate [500 µg] or budesonide [320 µg]). Baseline clinical data were obtained after discontinuation of inhaled corticosteroids for 2 weeks, inhaled long-acting beta-agonists for 2 days, and inhaled short-acting beta-agonists for 12 hours. Patients were treated with a salmeterol/fluticasone propionate powder inhaler twice per day for 3 months, and during this period, only salbutamol was allowed additionally as needed. Subsequently, all patients continued to receive their prescribed medications according to the practicing clinician's decision.
Physiologic Data
All baseline PFTs were performed within 1 month before or after CT scanning. Follow-up PFTs were performed 12 months after the baseline PFTs. Spirometry was conducted using a Vmax 22 system (SensorMedics, Yorba Linda, CA, USA) or a PFDX machine (MedGraphics, St. Paul, MN, USA) and according to the guidelines of the American Thoracic Society and European Respiratory Society (12). Values were obtained for FEV1, FVC, FEV1/FVC, mean forced expiratory flow between 25% and 75% of FVC, diffusing capacity of the lung for carbon monoxide, and 6-minute walk distance (6MWD, measured in meters). Results (apart from FEV1/FVC and 6MWD) were expressed as percentages of normal predicted values. Clinically significant improvement in lung function (treatment response) was defined as an increase of > 0.225 L in FEV1 from baseline to follow-up PFTs (1314).
CT Acquisition and Analysis
All CT scans were acquired at full inspiration or expiration with patients in the supine position. Several different scanners were used (Sensation 16; Somatom Definition, Definition AS+, and Somatom Definition flash; all from Siemens Medical Solutions, Erlangen, Germany). Scan parameters were as follows: tube voltage, 140 kVp; effective tube current, 100 mAs; collimation, 0.75 mm; slice thickness, 0.75 mm; and pitch, 1.0. The acquired data were reconstructed using the B30f kernel.
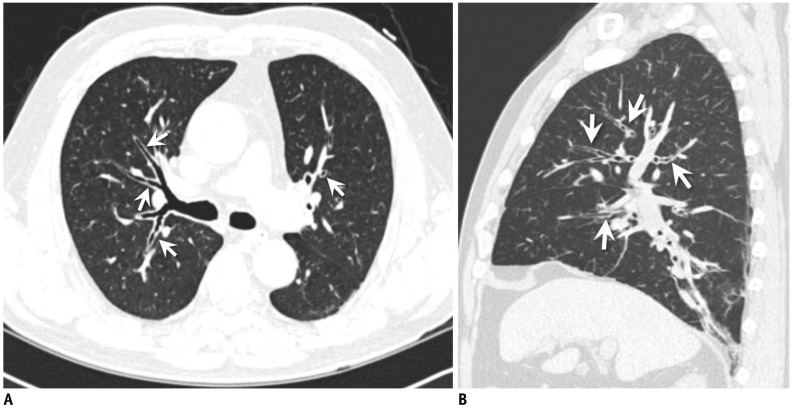
Whole-lung images were evaluated using commercial software (Aview; Coreline Soft, Seoul, Korea) to automatically reduce inconsistencies and accurately determine disease progression. From the CT data, the emphysema index (EI, defined as the lung volume fraction of < −950 Hounsfield unit [HU] on inspiratory CT scans) (567) was calculated. Airway measurements were conducted in a semi-automated fashion on a workstation (Fig. 2). A standardized measure for airway wall thickness was derived for each patient by obtaining the Pi10, the square root of the wall area of the theoretical airway with an internal perimeter of 10 mm (9). To obtain the Pi10, after plotting the square root of the wall area of the internal perimeters of multiple airways at different locations, the resulting regression line was used to calculate the square root of the wall area for a theoretical airway with an internal perimeter of 10 mm. We obtained the Pi10 value by plotting the obtainable values of the internal perimeter and the square root of the wall area of the 5th–8th branch of the segmental bronchi in all segments of both lungs (Fig. 3). The software automatically detected airway lumens, magnified the images 10-fold, and detected the inner and outer boundaries of airway walls by using two different measurement algorithms: full-width-half-maximum (FWHM) and integral-based half-band (IBHB). In the FWHM method, the inner and outer edges of the airway wall were defined as being halfway to the maximum HU from the lumen toward the airway wall and halfway to the minimum HU from the airway wall toward the outer parenchyma in the attenuation profile, respectively, from the radiating linear rays starting from the luminal center-point through the airway wall. The airway wall thicknesses were then calculated. In the IBHB method, after the initial circular rays (initial bands) were identified along lumen boundaries with a 50-HU threshold, larger circular rays were generated one after another through the airway wall. The circular rays showing the maximum HU were identified as the peak band, and half-wall thicknesses were measured using the integration of the initial and peak bands. The half-wall thickness was then doubled for the final measurement of airway wall thickness. Details of the airway measurement algorithms for the IBHB method have been described previously (15).
To assess the airway-trapping area, the software co-registered inspiration and expiration CT images using a non-rigid method that deformed expiratory images to match inspiratory images at a pixel level. After co-registration, the airway-trapping index (ATI) was calculated by three methods: 1) calculating the volume wherein HU is lower than −856 HU on the expiratory CT scan only (ATI_−856); 2) dividing the lung volume into four sections with two HU thresholds (−950 HU on the inspiratory CT scan and −856 HU on the expiratory CT scan) and then subtracting the volume wherein HU is lower than −950 HU on the inspiratory CT scan from the area in which HU is lower than −856 HU on the expiratory CT scan (ATI_subtraction_1) (16); and 3) measuring the volume wherein the differences for each voxel between inspiratory and expiratory CT scans were less than 60 HU (ATI_subtraction_2) and subsequently dividing it according to the attenuation on the inspiration CT for emphysema (< −950 HU; ATI_emphysema), hyperinflated lung (−950 HU to −900 HU; ATI_hyperinflated), and normal lung (−899 HU to −400 HU; ATI_normal) (1718).
Statistical Analysis
To investigate the predictors of an increase in FEV1, Pearson's chi-squared test and Fisher's exact test were used for categorical variables, and an independent-sample t test was used for continuous variables. Variables associated with a p value of < 0.1 on univariate analysis were used as input variables for multivariate logistic regression analysis with a backward stepwise selection mode and iterative entry of variables based on test results. Removal of variables was based on likelihood-ratio statistics with a probability of 0.1. Receiver operating characteristic (ROC) analysis was performed to evaluate the performance of the multiple logistic regression models.
All statistical analyses were performed using SPSS version 21.0 (IBM Corp., Armonk, NY, USA). Data are presented as mean ± standard deviation. A p value < 0.05 was considered to indicate a statistically significant difference.
RESULTS
Comparisons between Treatment Responders and Non-Responders
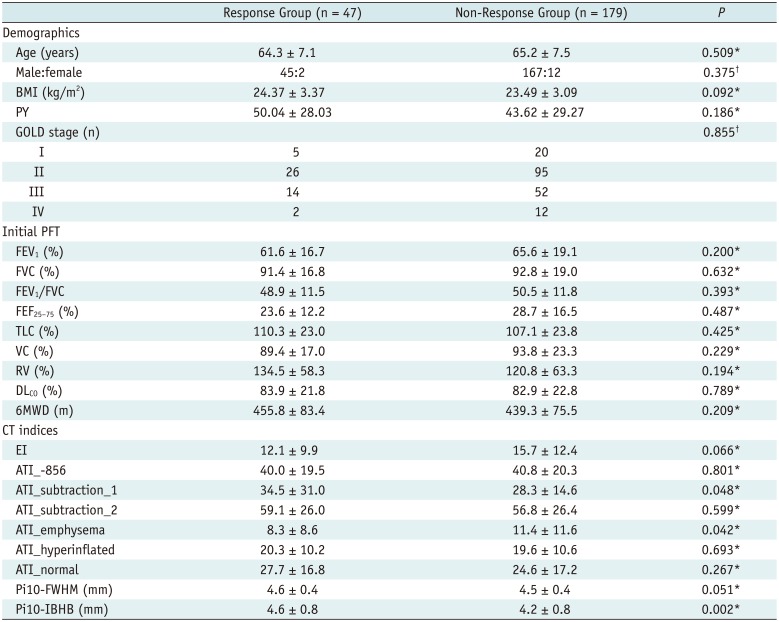
Compared with baseline, an increase of > 0.225 L in FEV1 was seen in 47 patients (20.8%). The average FEV1 changes in the responder and non-responder groups were 0.36 ± 0.10 L (range, 0.23–0.68 L) and −0.02 ± 0.15 L (range, −0.46–0.22 L), respectively.
Among the demographic measures and initial PFT parameters, no clinical parameter showed a significant difference between the responder and non-responder groups. Body mass index (BMI) showed marginal significance (p = 0.09). As for smoking, the correlation between smoking pack-years and Pi10 values showed no statistical significance (p ≥ 0.29). In addition, smoking history in pack-years was not significantly different between treatment responders and non-responders (p = 0.186).
With respect to CT quantitative parameters, ATI_subtraction_1, ATI_emphysema, and Pi10-IBHB were associated with significant intergroup differences (p = 0.048, 0.042, and 0.002, respectively). The average ATI_subtraction_1 measurement was 34.5 ± 31.0% in the responder group and 28.3 ± 14.6% in the non-responder group. The average ATI_emphysema values in the responder and non-responder groups were 8.3 ± 8.6% and 11.4 ± 11.6%, respectively. The average Pi10-IBHB measurements in the responder and non-responder groups were 4.6 ± 0.8 and 4.2 ± 0.8, respectively; EI and Pi10-FWHM showed marginally significant intergroup differences, with P values of 0.066 and 0.051, respectively. The average value of Pi10-FWHM was significantly greater than that of Pi10-IBHB in all subjects (4.5 ± 0.4 and 4.2 ± 0.8, respectively, p < 0.001, 95% confidence interval [CI]: 0.16–0.44). Luminal diameter, luminal area, luminal perimeter, bronchial wall thickness, and bronchial wall area showed no significant difference between responders and non-responders (p > 0.82). Demographic data, initial PFT measurements, and CT indices of the responder and non-responder groups are summarized in Table 2.
There was a significant correlation between the initial FEV1 and Pi10 values (ρ = −0.25 and p < 0.001 for the IBHB method and ρ = −0.17 and p = 0.009 for the FWHM method). In addition, there was a significant correlation between treatment response and the value of Pi10 obtained by the IBHB method (ρ = 0.2, p = 0.003).
Predictive Factors for Treatment Response
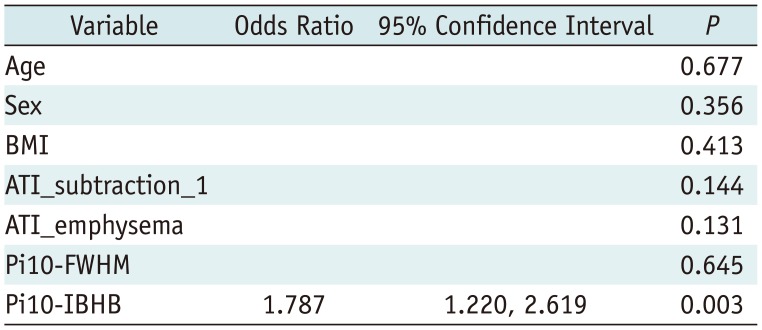
BMI, ATI_subtraction_1, ATI_emphysema, Pi10-FWHM, and Pi10-IBHB were used as input variables for multivariate regression analysis. EI was excluded due to the collinearity with ATI_emphysema (variance inflation factor, 10.220). Age and sex were also included in the analysis for adjustment. Pi10-IBHB was the only significant independent predictor of an increase in FEV1 after treatment in patients with COPD (p = 0.003) (Fig. 4). The adjusted odds ratio for Pi10-IBHB was 1.787 (95% CI: 1.220–2.619), which meant that the probability of a response to the treatment was 1.787 times greater if Pi10-IBHB increased by 1. On multivariate regression analysis, BMI, EI, ATI_subtraction_1, ATI_emphysema, Pi10-FWHM, age, and sex were found to show no significant association with treatment response (all p > 0.05) (Table 3). In the ROC analysis, the area under the curve for Pi10-IBHB was 0.641 (95% CI: 0.558–0.724) (Fig. 5). The optimal cutoff value to differentiate between patients with and without treatment response was 4.05 mm (sensitivity, 76.6%; specificity, 46.4%; positive predictive value, 27.3%; negative predictive value, 88.3%; overall accuracy, 52.7%).
DISCUSSION
Our study demonstrated that Pi10 measured by the IBHB method was the only independent predictor of treatment response after 1 year of treatment in COPD patients. The performance of this single variable had an area under the curve of 0.641.
Bronchial wall thickening determined by CT in a semi-quantitative manner has previously been shown to be an indicator for prediction of treatment response (19). Our results validate the previous findings and add greater reproducibility and reliability to them because of the absence of interobserver variability with our methodology. Our results indicated that Pi10-IBHB can accurately represent airway dimensions and help predict treatment outcome, unlike all other clinical and pulmonary functional parameters, which were ineffective. However, as the ROC analysis of Pi10-IBHB showed moderate sensitivity (76.6%) and a high negative predictive value (88.3%), this method may currently be the most useful for identification of non-responders, and additional parameters should be sought to improve its performance. Further validation of these results should be performed in another COPD population.
Unlike the FWHM method, the most widely used methodology for obtaining quantitative airway measurements, the IBHB method is a recent development (15). A known weakness of the FWHM method is that it underestimates luminal dimensions and overestimates wall dimensions, and these deviations magnify as the airways become smaller (202122). Overestimation of wall dimensions is possibly caused by some outward leakage of radiating rays because of the closely attached non-airway structures showing higher density than the lung parenchyma, such as vessels. Cho et al. (15) reported that the IBHB method using propagating concentric bands and doubling of the inner half-thickness of airway walls can reduce overestimation errors in comparison with the FWHM method and can prevent leakage of rays by using only the inner half-thickness of the airway wall. According to Cho's study (15), the IBHB method showed better agreement between the measured and actual values for small bronchi and showed significantly smaller values than the FWHM method. Similarly, in our cohort, the Pi10-FWHM values were significantly higher than the Pi10-IBHB values (p < 0.001). Furthermore, Pi10 measured by the FWHM method was not significantly associated with treatment response. Given that the very small airways are the major targets of measurement in COPD, erroneous measurements of airway wall thickness would be fatal, particularly as the error worsens as the airway becomes smaller. In addition, the overestimation of airway wall thickness by the FWHM method may explain why this variable was not associated with a significant difference between treatment responders and non-responders.
The mean Pi10-IBHB value for non-responders was markedly smaller than that for responders, whereas the mean Pi10-IBHB and Pi10-FWHM values were comparable in responders. There may be a possibility that the distribution of the level (i.e., the Nth branch of segmental bronchi) for airway measurements, which we obtained as many as possible in each subject, differed among responders and non-responders. According to Cho's study (15), there is an intersection point of the airway wall thickness estimations obtained by the IBHB and FWHM methods, and the responders' airway wall thickness might have been more approximate to this point than the non-responders' airway wall thickness.
Among the quantitative parameters derived from CT, ATI_subtraction_1, ATI_emphysema, and Pi10-IBHB, which reflect the severity of small-airway disease, showed significant differences between responders and non-responders. EI showed no significant differences between the two groups. These results correspond well with the current concept that although chronic airway inflammation may respond to medications, airway limitation caused by lung parenchymal destruction is irreversible (192324), thus implying that airway disease-predominant COPD may be more treatable than emphysema-predominant COPD. Notably, the Pi10 measured by the IBHB method was the only independent predictive factor that remained in multivariate regression analysis. Although it is difficult to clearly explain why ATI_subtraction_1 and ATI_emphysema could not differentiate responders from non-responders, one possible explanation is that the air-trapping area represents both treatable and untreatable small-airway disease. Conversely, Pi10-IBHB is more closely related to active inflammation in small-airway disease.
In our study, we attempted to evaluate the feasibility of applying Pi10 to COPD patients. If the optimal cutoff values were to be calculated separately according to COPD phenotypes, they would be different from our results. As there are no criteria to determine the dominant COPD phenotype on CT scans, we did not perform further analysis according to COPD phenotypes. Notably, we attempted to divide our subjects according to the criteria recommended by Nakano et al. (6) and identified that our cohorts were mainly of the emphysema-dominant type. Although we used a multicenter cohort, it is also necessary to verify our results in another cohort with different phenotypes.
In our study, treatment response was defined as a > 0.225-L increase in FEV1 from baseline to follow-up. Current American Thoracic Society/European Respiratory Society guidelines recommend inter-session reproducibility within 0.15 L for FEV1, as the measurement of FEV1 is highly effort-dependent (12). However, several studies have demonstrated greater intra- and inter-session variability in patients with COPD than in individuals with normal lung function (25). Herpel et al. (14) defined an absolute change of > 0.225 L to be a clinically significant short-interval inter-session change in FEV1 in a patient with COPD. Therefore, this definition was used in the present study to provide an accurate and reliable threshold to indicate genuine changes in lung function in patients with COPD.
Our study has some limitations. First, because of its retrospective nature, there may have been selection bias. Second, treatment after the first 3 months was determined individually for each patient and was not homogeneous, which may have affected treatment outcomes. However, all patients were managed according to the GOLD guidelines, and a similar approach has been used previously in the Evaluation of COPD Longitudinally to Identify Predictive Surrogate End-points study, wherein all participants continued to receive the prescribed medication throughout the study (26). Third, the quantification result may have been influenced by the different CT scanners used in this study. If a single CT scanner had been used, the results would have been more homogeneous and the performance of CT quantification for predicting treatment response would have been further enhanced.
In conclusion, measurement of standardized airway dimensions by an advanced CT quantification method can help predict response to treatment in patients with COPD.


 XML Download