

 PDF
PDF ePub
ePub Citation
 Print
Print


INTRODUCTION
In primary brain tumors, vascular morphology is used as an important parameter regarding differential diagnosis, malignancy, and survival rate. Perfusion magnetic resonance imaging (MRI) can be used to evaluate tumor vascularity and to predict tumor progression by measuring cerebral blood volume (CBV) and cerebral blood flow (CBF) as parameters (1). Dynamic susceptibility contrast (DSC) perfusion MRI is a common perfusion MRI technique and is a predominantly used for the diagnosis, prognosis prediction, and treatment response assessment of brain tumors after bolus intravenous injection of contrast media in the clinical setting (234).
Recently, arterial spin labeling (ASL) was introduced as a noninvasive MRI modality, which uses magnetically labeled arterial protons as an endogenous tracer for perfusion imaging (56). One of the advantages of ASL over DSC perfusion MRI is that it does not require injection of contrast agents, which allows for application in a wider population such as infants or patients with renal disease (7). Another advantage of ASL is that it can be quantitative, which makes ASL a suitable measurement tool for repetitive tests, follow-up study, and comparison studies (5).
A novel ASL technique, alternate ascending/descending directional navigation (ALADDIN), requires no separate spin preparation pulse (891011). By acquiring multiple slices sequentially, but in two different directions (ascending and descending), the spin labeling plane can be placed next to the imaging plane (8). ALADDIN is known to have a longer labeling duration and to be more sensitive to blood in a wider velocity range than previous ASL techniques due to the multiple labeling planes automatically tracking imaging regions in close proximity, which might contribute to a higher percent signal change (812). However, there has been no comparison of ALADDIN and DSC perfusion MRI in perfusion assessment. Thus, in this study, we applied ALADDIN in CBF measurement in normal gray matter (GM) as well as in primary brain tumors, and performed a comparison with DSC perfusion MRI.
Go to : 
MATERIALS AND METHODS
This retrospective study was approved by the Institutional Review Board and the need for informed consent was waived.
Patient Population
A total of 50 patients with brain tumors, who received both DSC perfusion MRI and ALADDIN MRI at Seoul National University Hospital from March 2015 to February 2016, were initially enrolled in this study. The following inclusion criteria were applied: the patients underwent both DSC perfusion MRI and ALADDIN examinations using the same 3T scanner (Verio, Siemens Healthineers, Erlangen, Germany) (n = 50). Patients with incomplete information on pathology (n = 12), post-treatment MRI (n = 18), or motion artifacts (n = 4) were excluded (Fig. 1).
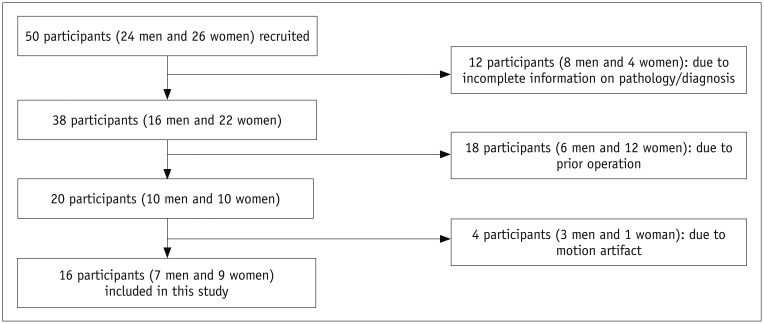
Finally, 16 patients (nine females and seven males, aged 23–78 years) were enrolled in the study (Table 1). As four patients were scanned twice for initial and recurrent tumors, a total of 20 MRI scans were analyzed.
Data Acquisition
All patients were scanned using a 3T scanner (Verio) with a 32-channel head coil. The MRI protocol included the following: T1-weighted multiplanar reconstructed transverse, coronal, and sagittal imaging with a three-dimensional (3D) magnetization-prepared rapid acquisition gradient-echo (MPRAGE) sequence before and after contrast enhancement, transverse fluid-attenuated inversion recovery (FLAIR) sequence, and transverse T2-weighted imaging (T2WI) with turbo spin-echo sequences. The parameters for 3D MPRAGE were a repetition time (TR) of 1500 ms, an echo time (TE) of 1.9 ms, a flip angle (FA) of 9°, a matrix of 256 × 232, a field of view (FOV) of 220 × 250, a section thickness of 1 mm, and a number of excitations (NEX) of 1. The parameters for transverse FLAIR were a TR of 9000 ms, a TE of 97 ms, an inversion time of 2500 ms, an FA of 130°, a matrix of 384 × 348, a FOV of 199 × 220, a section thickness of 5 mm, and an NEX of 1. We acquired the transverse T2WI with the following parameters: a TR of 5160 ms, a TE of 91 ms, an FA of 124–130°, a matrix of 640 × 510–580, an FOV of 199 × 220, a section thickness of 5 mm, and an NEX of 3. Contrast-enhanced (CE) T1-weighted imaging (T1WI) was performed after the intravenous administration of gadobutrol (Gadovist; Bayer Schering Pharma AG, Berlin, Germany) at a dose of 0.1 mmol/kg body weight.
Transverse DSC perfusion MRI was performed with single-shot gradient-echo echo-planar sequences during the intravenous administration of gadobutrol at a concentration of 0.1 mmol/kg body weight at a rate of 4 mL/s using a power injector (Medrad Spectris, Bayer US, Indianola, PA, USA). A 30 mL bolus injection of saline was administered at the same injection rate. For each section, 60 images were acquired at intervals equal to the TR. The parameters were as follows: TR, 1500 ms; TE, 30 ms; FA, 90°; matrix, 128 × 128; section thickness, 5 mm; intersection gap, 1 mm; FOV, 240 × 240 mm; number of sections, 15–20; voxel size, 1.875 × 1.875 × 5 mm3; pixel bandwidth, 1563 Hz; and total acquisition time, 1 minute 30 seconds.
ALADDIN was also performed in all patients before the contrast injection. Balanced steady-state free precession (bSSFP) images were acquired with the following parameters: TR, 4.15 ms; TE, 2.08 ms; FA, 60°; matrix, 128 × 128; FOV, 220 × 220 mm; section thickness, 5 mm; phase oversampling, 50%; and NEX, 1. The acquisition was repeated 16 times by alternating the ascending/descending slice order, the slice-selection gradient polarity, and the readout gradient polarity. The 16 acquisitions composed one full dataset. Two full datasets with number of slices = 18 and 19 were separately acquired and then interleaved to cover the whole brain regions in the conventional gap value (20% of the slice thickness in this study), yielding a scan time of 5.7 minutes. Magnetization transfer (MT)-free images were additionally acquired with: a 5 seconds inter-slice delay time; positive slice-select gradient; ascending order; and scan time = −1.7 minutes (13).
Imaging Processing and Analysis
The conventional magnetic resonance (MR) images, ALADDIN images (MT-free images, ascending/descending acquisition images), and DSC perfusion MR images were digitally transferred from the picture archiving and communication system workstation to a personal computer for further analysis.
The relative CBV (rCBV) maps and relative CBF (rCBF) maps were obtained with a dedicated software package (nordicICE; Nordic NeuroLab, Bergen, Norway) that applied an established tracer kinetic model to the first-pass data (1415). First, realignment was performed to minimize patient motion during the dynamic scans. A gamma-variate function, which approximates the first-pass response as it would appear in the absence of recirculation, was used to fit the 1/T2* curves to reduce the effects of recirculation. To reduce the contrast agent leakage effects, the dynamic curves were mathematically corrected (16). After the elimination of recirculation and leakage of the contrast agent, the rCBV was computed with numeric integration of the curve. In addition, the CBF value was calculated as CBV/mean transit time and rCBF maps were generated (17).
ALADDIN images were analyzed using MATLAB software (Version 7.3, The MathWorks, Inc., Natick, MA, USA). The CBF in the ALADDIN images was calculated from the following equation: (13)

where ΔSPW is the signal difference between ascending and descending acquisitions; S0 is the MT-free baseline signal; λ is the brain/blood partition coefficient; α is the labeling efficiency in one prior slice; T1app is the longitudinal relaxation time in the presence of flow and macromolecular saturation; τ0 is labeling duration of one prior slice (i.e., acquisition time for single slice); and w(i) is the post-labeling delay time for the i-th prior slice (13).
Two well-trained medical students supervised by one neuroradiologist (with 16 years of brain MRI experience) who were blinded to the clinical data defined the polygonal regions of interest (ROIs) that contained the entire tumor area on normalized CBF (nCBF) maps from DSC perfusion MRI and CBF maps from ALADDIN by consensus. The margins of the tumor lesions were defined by comparison with CE T1WI and efforts were made to localize the ROIs on nCBF maps from DSC perfusion MRI and CBF maps from ALADDIN at the same position. Areas of necrosis, hemorrhage, or non-tumor macro-vessels that were evident on the CE T1WI were excluded from the ROIs. ROIs of 17.725 mm2 in the bilateral normal GM were also drawn at six different areas including the frontal lobe, parietal lobe, temporal lobe, occipital lobe, thalamus, and caudate head to measure the nCBF from DSC perfusion MRI and the CBF from ALADDIN. The measured CBF values from DSC perfusion MRI and ALADDIN were normalized by using the CBF values of the unaffected white matter (WM), where ROIs of 17.725 mm2 were drawn, using the following equation: nCBF = CBF at tumor areas or GM/CBF in the unaffected WM. Finally, we also calculated the voxel-by-voxel nCBF values in the tumor areas and GM from ALADDIN.
Statistical Analysis
All statistical analyses were performed with MedCalc for Windows, version 17.7.2 (MedCalc Software, Ostend, Belgium). In all cases, p < 0.05 was considered to be statistically significant. The Kolmogorov-Smirnov test for normality was applied for all variables.
The Wilcoxon signed rank test or a paired t test was applied to compare the nCBF values from DSC perfusion MRI and ALADDIN in the six bilateral GM regions (frontal lobe, parietal lobe, temporal lobe, occipital lobe, thalamus, and caudate head) and tumor lesions.
Subgroup analysis was performed according to the histopathology to compare the nCBF values from DSC perfusion MRI and ALADDIN of each tumor using the Wilcoxon signed rank test or a paired t test.
Go to :
RESULTS
Patient Characteristics
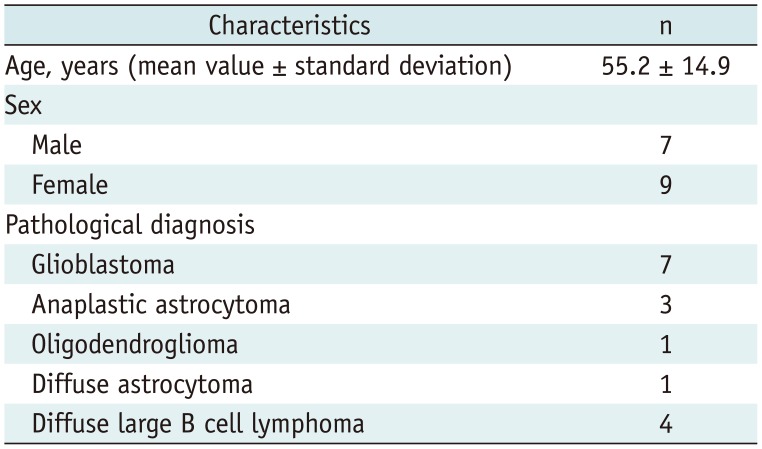
The baseline epidemiologic characteristics are provided in Table 1. Seven male and nine female patients (mean age 55.2 ± 14.9 years) with primary brain tumors were enrolled in this study.
Comparison Analysis of GM nCBF Values between DSC Perfusion MRI and ALADDIN
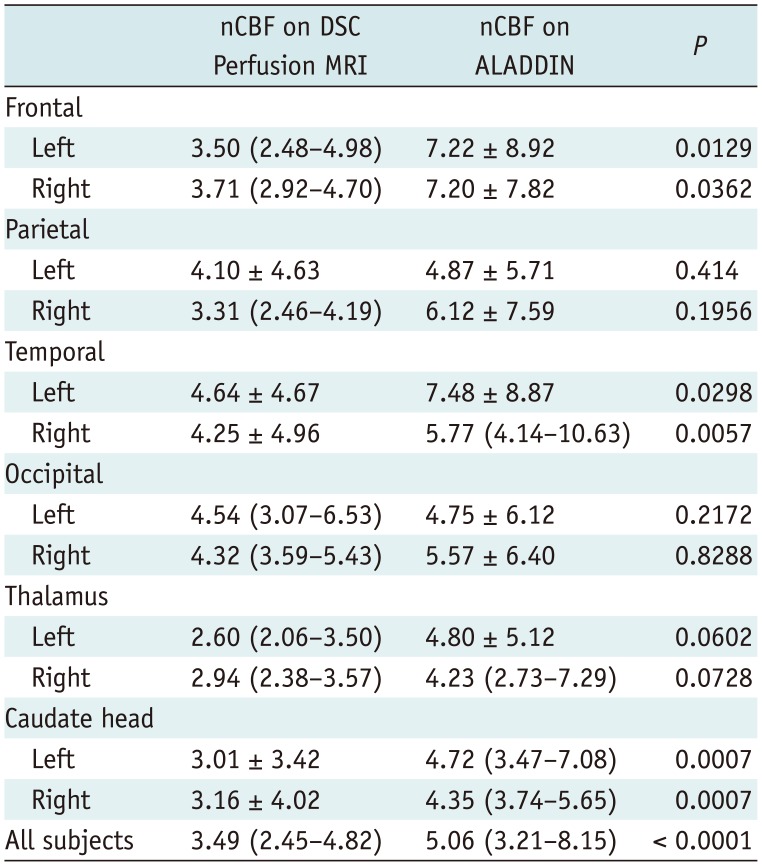
The results of the comparison analysis of the GM nCBF values are summarized in Table 2. The mean or median nCBF values as measured by ALADDIN at the bilateral frontal and temporal lobes and the caudate were higher than those determined by DSC perfusion MRI (p < 0.05) (Fig. 2). In addition, the bilateral parietal and occipital lobes and thalamus exhibited higher mean or median nCBF values on ALADDIN than on DSC perfusion MRI without statistical significance (p > 0.05) (Fig. 2).
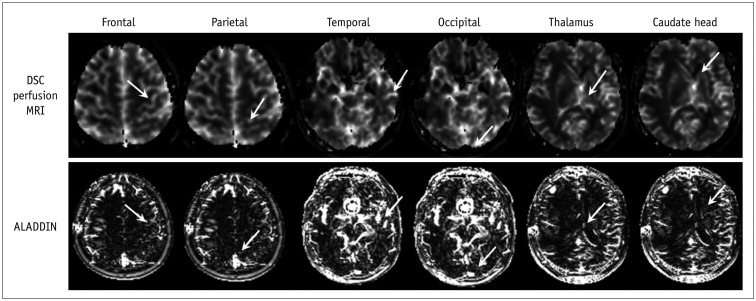 | Fig. 2Normal GM of frontal lobe, parietal lobe, temporal lobe, occipital lobe, thalamus, and caudate head from DSC perfusion MRI and ALADDIN (arrows).Region of interest in normal GM was selected in specific regions in each lobe for consistency as follows: precentral gyrus above central sulcus for frontal lobe, postcentral gyrus below central sulcus for parietal lobe, middle temporal gyrus for temporal lobe, and occipital pole. ALADDIN = alternate ascending/descending directional navigation, DSC = dynamic susceptibility contrast, GM = gray matter, MRI = magnetic resonance imaging
|
Table 2
Comparison Analysis of Gray Matter nCBF between DSC Perfusion MRI and ALADDIN
Data with or without normal distribution are shown in mean ± standard deviation and median (IqR), respectively. ALADDIN = alternate ascending/descending directional navigation, DSC = dynamic susceptibility contrast, IqR = interquartile range, nCBF = normalized cerebral blood flow, MRI = magnetic resonance imaging
![]()
Comparison Analysis of Tumor nCBF Values between DSC Perfusion MRI and ALADDIN
Table 3 presents the results of the comparison analysis of the tumor lesions. The median tumor volumes were 7438.07 mL (interquartile range [IqR]: 4813.43–31870.62) and 7156.31 mL (IqR: 4512.39–14497.25) based on DSC perfusion MRI and ALADDIN, respectively, which did no significantly differ (p = 0.076).
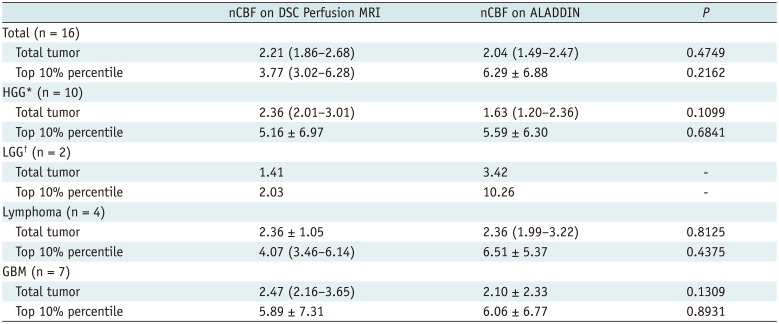
Table 3
Comparison Analysis of Tumor nCBF between DSC Perfusion MRI and ALADDIN according to Pathological Subgroups
![]()
There were no significant differences in the mean or median nCBF values from whole tumors between ALADDIN and DSC perfusion MRI in either the overall tumors or in each subgroup (p > 0.05) (Table 3, Figs. 3, 4). The mean of the top 10% nCBF values of tumors as measured by ALADDIN tended to be higher than those as measured DSC perfusion MRI without statistically significant differences in either the overall tumors or in each subgroup (p > 0.05) (Table 3).
 | Fig. 3Representative cases of high-grade glioma (A), low-grade glioma (B), lymphoma (C) in CE T1WI, DSC perfusion MRI, and ALADDIN.
A. 83-year-old woman with multifocal glioblastoma (mean nCBF from DSC perfusion MRI and ALADDIN was 2.06 and 3.09, respectively). B. 41-year-old woman with oligodendroglioma in right parietal lobe that locally recurred after surgery (mean nCBF from DSC perfusion MRI and ALADDIN was 1.01 and 4.46, respectively). C. 63-year-old woman with diffuse large B cell lymphoma in right frontal lobe (mean nCBF from DSC perfusion MRI and ALADDIN was 2.15 and 1.70, respectively). CE = contrast-enhanced, nCBF = normalized cerebral blood flow, T1WI = T1-weighted imaging
|
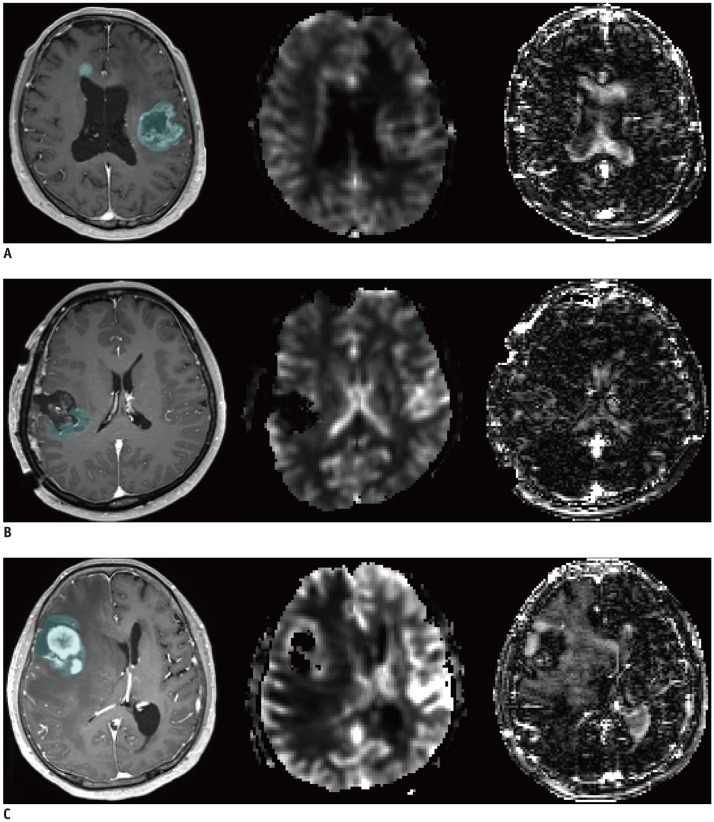
 | Fig. 478-year-old woman with glioblastoma in right frontal lobe.CE T1WI (A) and ALADDIN ascending (B), descending (C), ascending + descending (D) acquisition indicated that lesion had higher signal intensity in descending and ascending + descending acquisitions, but lower signal intensity in ascending acquisition.
|
Go to :
DISCUSSION
In our study, we found that the majority of the nCBF values of GM measured by ALADDIN were higher than those measured by DSC perfusion MRI with or without statistical significance. In addition, our study also revealed that the mean of the top 10% nCBF values of tumors measured by ALADDIN also tended to be higher than those found by DSC perfusion MRI without statistically significant differences.
The distinctive characteristics of the ALADDIN perfusion signal potentially contributed to a higher perfusion signal in ALADDIN. First, ALADDIN has higher sensitivity to tagged spins from both slow- (1–10 cm/s) and fast-moving (> 10 cm/s) blood. The reduced gap values enable labeling of blood vessels with velocities of < 1 cm/s and further reduction of T1 recovery of labeled blood spins. This characteristic of ALADDIN compensated for the lower labeling efficiency and provided high-resolution multisectional perfusion-weighted images in –3 minutes (8). Second, the signal-to-noise ratio (SNR) of ASL is affected by the average SNR of the baseline images. The high sensitivity of the ALADDIN signal may be partly due to the use of the bSSFP readout providing the highest SNR per unit time. The presence of multiple labeling planes proximal to the imaging planes also contributes to the perfusion contrast of ALADDIN (13).
As a retrospectively designed study, our study has several limitations. First, the small number of patients and the heterogeneity of tumor pathologies, such as inclusion of astrocytoma and oligodendroglioma, might have resulted in overlapping of CBF values between tumor groups. Thus, the results need further confirmation in a larger population. Second, we measured the nCBF values in the brain GM by visual assessment instead of application of an automatic segmentation method. However, we carefully located the ROIs in each patient. Third, we did not correlate the nCBF values pixel-by-pixel between ALADDIN and DSC perfusion MRI, but used the overall mean and the mean of the top 10% values. Fourth, we did not coregister the CBF maps from ALADDIN and DSC, which can lead to registration bias. However, as mentioned above, we carefully drew ROIs at the same slice according to the position in every patient. Lastly, the nCBF values of the normal GM as measured by ALADDIN exhibited differences without statistical significance according to the location (e.g., the frontal, temporal, and parietal lobes) and laterality. We believe that these variations of the values are within the measurement error ranges, which might have resulted from the wide standard deviation of measured values. Our study needs further validation based on automatic segmentation in a large population.
In conclusion, ALADDIN tends to yield higher nCBF values in the normal GM as well as higher perfusion portions of primary brain tumors than does DSC perfusion MRI. We believe that the high perfusion signal of ALADDIN can be helpful for lesion detection and characterization.
Go to :
 XML Download