

 PDF
PDF ePub
ePub Citation
 Print
Print


INTRODUCTION
Biochemical recurrence continues to be reported in up to 40% of prostate cancer (PCa) patients undergoing radical prostatectomy (RP) (123). Although biochemical recurrence does not always progress to clinical disease, it is associated with metastases and cancer-specific mortality (45). Approximately one-third of patients with biochemical recurrence require ancillary treatment such as radiation therapy or androgen-deprivation therapy (6). Therefore, awareness of the likelihood of biochemical recurrence following RP is important for therapy decision-making, patient counselling, and clinical trial design.
A few studies have reported the usefulness of multiparametric magnetic resonance imaging (mpMRI) in predicting biochemical recurrence following RP in PCa (78). A recent study (7) demonstrated that the degree of visibility on mpMRI was associated with biochemical recurrence after RP. In this study, tumor visibility on mpMRI was found to be an independent risk factor for biochemical recurrence; however, tumor visibility was not assessed using a structured scoring system.
In 2015, the updated Prostate Imaging Reporting and Data System (PI-RADS) version 2 (v2) was established, replacing the original version that was created in 2012 to standardize the interpretation and systematic reporting of prostate MRI (910). It includes assessment categories that summarize the level of suspicion or risk of clinically significant cancer (9). Only a few studies have reported the results of PI-RADS v2 use to predict biochemical recurrence following RP (1112). Their results suggest that the PI-RADS v2 score might be a useful marker for predicting biochemical recurrence, but the median follow-up periods have ranged from only 25–47.9 months. Longer term follow-up is required. No studies have reported the results of PI-RADS v2 used to predict disease progression following RP.
In this study, we evaluated the prognostic value of PI-RADS v2 for long-term biochemical recurrence-free survival (RFS) and progression-free survival (PFS) following RP in PCa patients. The purpose of our study was to determine whether PI-RADS v2 helps to predict long-term outcomes following RP in PCa patients, with a median follow-up period of 9 years.
MATERIALS AND METHODS
Patient Cohort and Clinical Characteristics
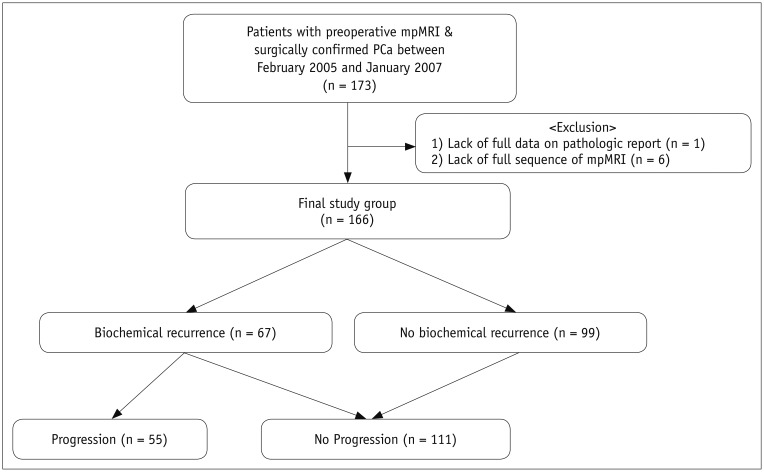
Our Institutional Review Board approved this retrospective study and waived the requirement for informed consent. Between February 2005 and January 2007, a total of 173 PCa patients that were treated with RP met the following inclusion criteria: 1) 3T mpMRI at our institution before surgery, 2) transrectal ultrasound-guided systemic 10–12 cores biopsy because of suspicious PCa at our institution before performing mpMRI, 3) adequate imaging quality for interpretation without artifacts, 4) < 4 months interval between MRI and surgery, and 5) no prior any treatments. Of the 173 patients, 7 were excluded due to: (a) missing data on the pathology report (n = 1) and (b) lack of a full mpMRI sequence (n = 6). Finally, 166 patients (median age, 64.0 years; interquartile range, 43–75 years) were included in this study (Fig. 1).
We collected preoperative clinical data including prostate-specific antigen (PSA), Eastern Cooperative Oncology Group performance status, digital rectal examination findings and biopsy results of Gleason score (GS) and number of positive cores.
Outcome Measures
The primary outcome was RFS; secondary outcomes were PFS and cancer-specific survival (CSS). Biochemical recurrence was defined as a final value ≥ 0.2 ng/mL with a subsequent confirmatory value, single PSA ≥ 0.4 ng/mL, or receipt of salvage therapy for the treatment of detectable PSA > 0.1 ng/mL (13). Disease progression was defined according to the criteria suggested by Prostate Cancer Clinical Trials Working Group 2 (14). In summary, local recurrence (appearance of a new lesion in the prostatectomy bed), a new target lesion, lymph node metastasis (≥ 2 cm in diameter), a bony lesion (appearance of two or more new lesions on bone scan), and requirement for other therapies were all used to define disease progression. To assess CSS, PCa-related death was defined as a death that was definitely or probably due to PCa or its treatment.
MRI Technique and Image Analyses
Magnetic resonance (MR) images were obtained before surgery using a 3T MR scanner (Intera Achieva 3T; Philips Healthcare System, Best, The Netherlands) with a phased-array coil. T2-weighted turbo spin-echo images were obtained in three orthogonal planes (axial, sagittal, and coronal) (repetition time [TR]/echo time [TE], 2690–3800/80–90 ms; slice thickness, 3 mm; interslice gap, 0.3–1 mm; 512 × 304 matrix; field of view [FOV], 18 cm; number of signals acquired [NSA], 3; and sensitivity encoding [SENSE] factor, 2). Axial T1-weighted turbo field echo sequences (3-mm slice thickness; FOV, 24 cm) were obtained. Axial diffusion-weighted imaging (DWI) was obtained using a single-shot echo planar imaging technique (2300–3000/62–65 ms; slice thickness, 3 mm; interslice gap, 1 mm; matrix, 112 × 112; FOV, 18 or 20 cm; SENSE factor 2; and NSA, 4). Apparent diffusion coefficient (ADC) maps were automatically constructed on a pixel-by-pixel basis. Axial dynamic contrast-enhanced imaging (DCEI) was obtained using a three-dimensional (3D)-fast field echo sequence (TR/TE, 7.6/3.9 ms; flip angle, 25°; matrix, 256 × 224; slice thickness, 4 mm; interslice gap, no; FOV, 18–20 cm. The 3D volume with 11 partitions was acquired every 5 seconds with 58 repetitions. Postcontrast series was performed immediately after a bolus injection of gadolinium contrast at a rate of 2–3 mL/sec with a dose of 0.1 mmol/kg body weight by using a power injector. To eliminate post-biopsy hemorrhage in the prostate, subtracted DCEI (postcontrast - precontrast) was also created.
All MR images were evaluated by two genitourinary radiologists with 11 and 3 years of experience in prostate MRI, respectively. They were blinded to the results of the patients' clinical and imaging findings, but were aware that the patients had received RP for biopsy-proven PCa. First, an experienced radiologist evaluated the PI-RADS v2 score for the index lesion in each patient with a 5-point scale (9). The index lesion was considered when the lesion was demonstrated with the highest PI-RADS v2 score on mpMRI. If the highest PI-RADS v2 scores were assigned to ≥ 2 lesions, they should be the one demonstrating extracapsular extension or greater in tumor diameter. Second, to evaluate interobserver variability, a less-experienced radiologist assessed independently the PI-RADS v2 score for the index lesion in 100 patients with the same method as the first radiologist.
Statistical Analysis
For predicting clinical outcomes, visual assessments using PI-RADS v2 scores were dichotomized and subdivided into three groups: group A, score < 3 (absence) versus score ≥ 3 (presence); group B, score < 4 (absence) versus score ≥ 4 (presence); group C, score < 5 (absence) versus score 5 (presence). Regarding the three groups of PI-RADS scores, the rates of RFS, PFS, and CSS were estimated using the Kaplan-Meier method and survival curves among the groups were compared using the log-rank test. Univariate and multivariate Cox proportional hazard regression models were performed to evaluate the association between variables and biochemical recurrence or disease progression. Variables with p <0.2 in the univariate analyses were included in the multivariate analyses. The κ statistic was used to evaluate interobserver agreement for interpretation of PI-RADS scores (15). The relationship between PI-RADS scores and surgical GS was evaluated using Spearman's rank correlation. All statistical analyses were conducted using SAS v.9.4 (SAS Institute, Cary, NC, USA) with p values < 0.05 considered statistically significant.
RESULTS
Baseline Characteristics
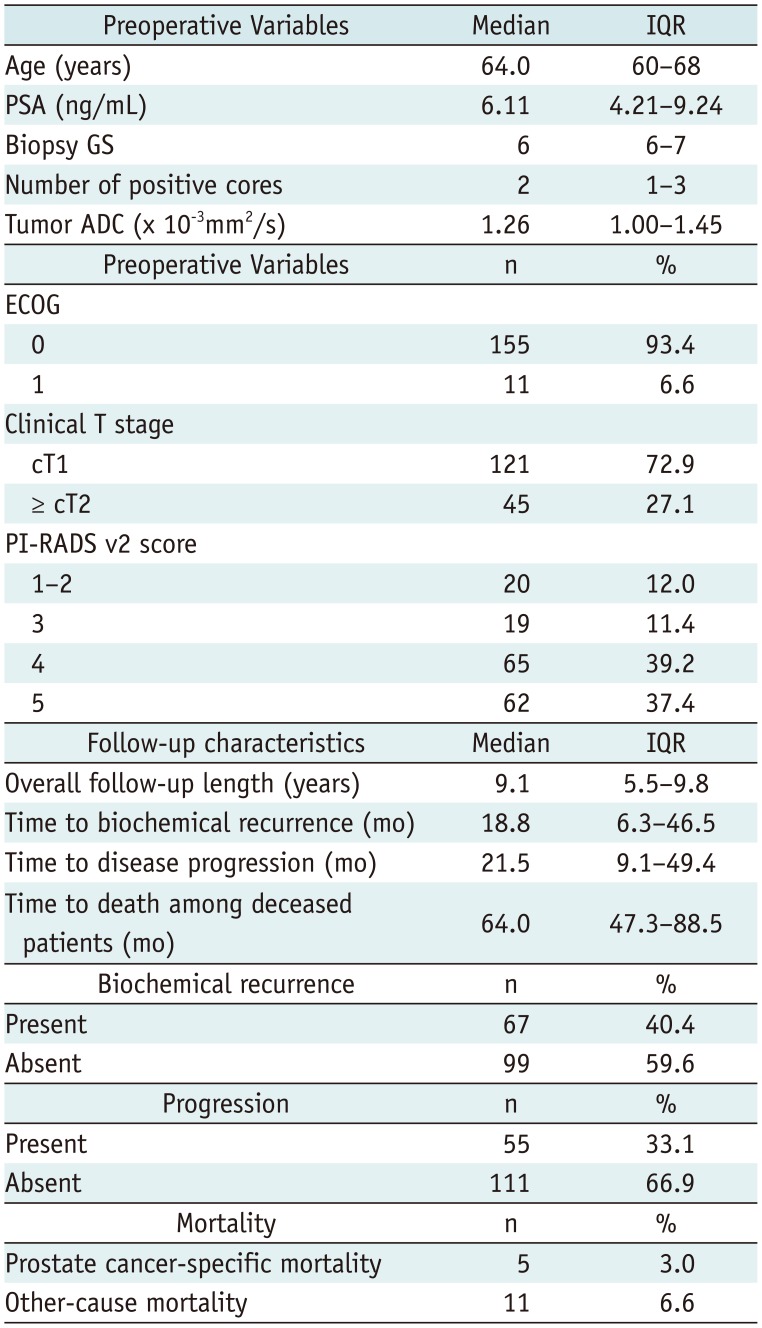
Table 1 summarizes the baseline characteristics of our cohort. During a median follow-up time of 9.1 years, there were 67 biochemical recurrences (40.4%), 55 disease progressions (33.1%), 5 PCa deaths (3.0%). The median time to biochemical recurrence was 18.8 months. The median time to disease progression was 21.5 months. The median time to death among deceased patients was 64 months.
Outcomes According to PI-RADS Score
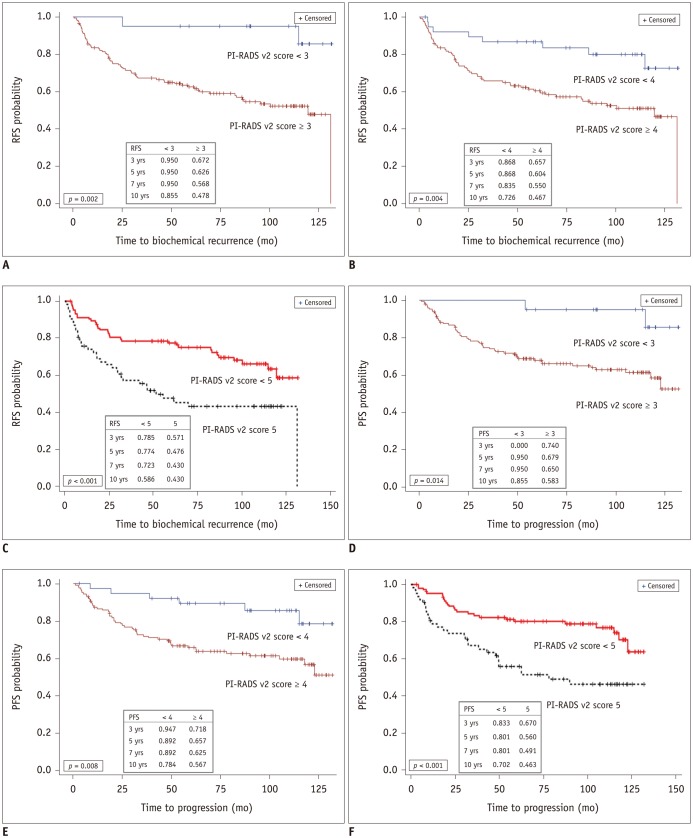
Analysis of group A (PI-RADS v2 score < 3 versus ≥ 3) revealed that biochemical recurrence occurred in 10% (2/20) of patients with PI-RADS v2 score < 3 and 44.5% (65/146) of patients with score ≥ 3. The RFS rates at 10 years were estimated to be 85.5% in the PI-RADS v2 score < 3 group and 47.8% in the score ≥ 3 group. Disease progression occurred in 10% (2/20) of patients with PI-RADS v2 score < 3 and 36.3% (53/146) of patients with score ≥ 3. The corresponding PFS for the two groups rates at 10 years were 85.5% in the PI-RADS v2 score < 3 group and 58.3% in the score ≥ 3 group. There were significant differences between the groups in the RFS (p = 0.002) and PFS curves (p = 0.014) (Fig. 2).
Analysis of group B (PI-RADS v2 score < 4 versus ≥ 4) revealed that biochemical recurrence occurred in 20.5% (8/39) of patients with PI-RADS v2 score < 4 and 46.5% (59/127) of patients with score ≥ 4. The RFS rate at 10 years was estimated to be 72.6% in the PI-RADS v2 score < 4 group and 46.7% in the score ≥ 4 group. Disease progression occurred in 15.4% (6/39) of patients with PI-RADS v2 score < 4 and 38.6% (49/127) of patients with score ≥ 4. The corresponding PFS rates for the two groups at 10 years were 78.4% in the PI-RADS v2 score < 4 group and 56.7% in the score ≥ 4 group. There were significant differences between the groups in the RFS (p = 0.004) and PFS curves (p = 0.008) (Fig. 2).
In analysis of group C (PI-RADS v2 score < 5 versus 5), biochemical recurrence occurred in 31.7% (33/104) of patients with PI-RADS v2 score < 5 and 54.8% (34/62) of patients with score 5. The RFS rate at 10 years was estimated to be 58.6% in the PI-RADS v2 score < 5 and 43.0% in the score 5 group. Disease progression occurred in 24.0% (25/104) of patients with PI-RADS v2 score < 5 and 48.4% (30/62) of patients with score 5. The corresponding PFS rates for the two groups at 10 years were 70.2% in the PI-RADS v2 score < 5 group and 46.3% in the score 5 group. There were significant differences between the groups in the RFS (p <0.001) and PFS curves (p <0.001) (Fig. 2).
Regarding the CSS, there were no significant differences in all groups (group A, p = 0.864; group B, p = 0.844; group C, p = 0.282).
Risk Factors for Biochemical Recurrence and Disease Progression
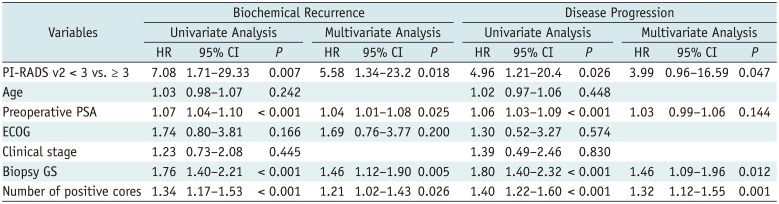
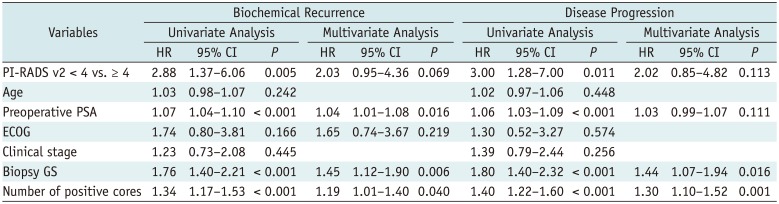
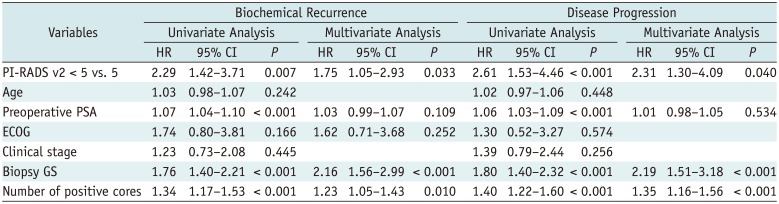
Tables 2, 3, 4 present the results of univariate and multivariate analyses for biochemical recurrence or disease progression. In three groups, univariate analysis demonstrated preoperative PSA, biopsy GS, number of positive core at biopsy, and PI-RADS v2 score were significantly associated with the occurrence of biochemical recurrence (group A, p = 0.007; group B, p = 0.005; group C, p = 0.007). In multivariate analysis, PI-RADS v2 score was an independent predictor of biochemical recurrence in group A (hazard ratio [HR] = 5.58; p = 0.018) and group C (HR = 1.75; p = 0.033), while it was not an independent predictor of biochemical recurrence in group B (HR = 2.03; p = 0.069). Biopsy GS, number of positive cores and preoperative PSA were independent predictors of biochemical recurrence in three groups (p <0.05).
For disease progression, preoperative PSA, biopsy GS, number of positive cores and PI-RADS v2 score were significantly associated in univariate analysis for three groups (p <0.05). In multivariate analysis, PI-RADS v2 score was an independent predictor in group A (HR = 3.99; p = 0.047) and group C (HR = 2.31; p = 0.040), while it was not an independent predictor of disease progression in group B (HR = 2.02; p = 0.113). Biopsy GS and number of positive cores were independent predictors of disease progression in three groups (p <0.05).
Association between PI-RADS v2 Score and GS
The distributions of surgical GS according to PI-RADS v2 score were as follows: score 2 (GS 6, n = 17; GS 7, n = 3), score 3 (GS 6, n = 13; GS 7, n = 6), score 4 (GS 6, n = 25; GS 7, n = 33; GS 8, n = 3; GS 9, n = 3) and score 5 (GS 6, n = 12; GS 7, n = 43; GS 8, n = 3; GS 9, n = 4). Thus, there was a moderate positive correlation between PI-RADS v2 scores and surgical GS (rho = 0.430, p <0.001).
DISCUSSION
Establishment of the updated PI-RADS v2 shows promise for predicting such clinical outcomes as RFS following RP in PCa patients with a relatively short follow-up period of 4 years or less (1112). However, no studies have reported long-term outcomes with follow-up periods of 5 years or more. In this cohort, we evaluated 10-year RFS and 10-year PFS using PI-RADS v2, with a median follow-up period of 9 years. Regarding 10-year RFS and 10-year PFS, the three groups with PI-RADS v2 scores ≥ 3, ≥ 4 and 5 were significantly lower value than those with PI-RADS v2 scores < 3, < 4 and < 5, respectively. Furthermore, PI-RADS v2 score with a cutoff value of 3 and 5 was independent factors for predicting biochemical recurrence and disease progression. These findings suggest that PI-RADS v2 scores as a prognostic marker may be used to predict long-term outcomes following RP in PCa patients, which can help clinicians offer patient counselling, preform risk stratification or design clinical study.
In PI-RADS v2, scores of both ≥ 3 and ≥ 4 have been used as cutoff values to determine the presence of PCa and clinically significant cancer. In a recent meta-analysis (16), there was no significant difference between using scores of ≥ 3 or ≥ 4 to detect clinically significant cancer. For predicting RFS following RP, a few recent studies have reported the utility for PI-RADS v2 (1112). Park et al. (11) reported 2-year RFS was significantly lower for PI-RADS v2 score ≥ 4 (84.7–85.5%) than for score < 4 (100%). Zhang et al. (12) constructed a MR-based prediction nomogram for biochemical recurrence. In their study, there was significantly lower cumulative 3-year RFS for low tumor ADC, PI-RADS v2 score 5 and T3b MR staging. However, no studies have reported on the usefulness of PI-RADS v2 scores ≥ 3 or ≥ 4 in predicting long-term outcomes after surgery. In this study, both PI-RADS v2 scores ≥ 3 and ≥ 4 were useful in predicting 10-year RFS and 10-year PFS. Furthermore, PI-RADS v2 score 5 was useful in predicting 10-year RFS and 10-year PFS. However, in multivariate analysis, scores ≥ 3 and score 5 were significant independent predictors of biochemical recurrence and disease progression, while scores ≥ 4 were not independent predictors. Given all of these findings, the cutoff value of PI-RADS v2 score ≥ 3 or score 5 as an independent marker could potentially be used to predict long-term outcomes following RP. Interestingly, compared with a previous study, our results demonstrated that a cutoff value of PI-RADS v2 score 4 was not an independent predictor of biochemical recurrence or disease progression. This could be explained as that clinical variables are significantly associated with systemic progression and death from PCa after biochemical recurrence (4), as relatively small study population in a single institution or interobserver variability for PI-RADS v2 scoring may potentially influence the results of model performance.
The Gleason grading system has consistently demonstrated a prognostic value in PCa patients (17). The mpMRI including T2-weighted imaging, DWI and DCEI is associated with tumor GS (1819). Although PI-RADS v2 does not provide quantitative information, it reflects tumor aggressiveness because a higher score indicated the prostate demonstrates hypointense on ADC map with markedly hyperintense on DWI. A recent study reported PI-RADS v2 score 5 lesions were associated with higher GS and extracapsular extension as compared with score 4 lesions (20). Interestingly, our results demonstrated PI-RADS v2 score 5 lesions with ≥ 1.5 cm in greatest dimension or extracapsular extension were significantly associated with 10-year RFS and PFS and accordingly, we believed tumor volume or size may be a useful predictor for predicting postoperative long-term clinical outcomes. Regarding the association between PI-RADS v2 score and surgical GS, our study demonstrated a moderate positive correlation, which was concordant with a previous study (rho = 0.495–0.596) (11).
Regarding the PI-RADS v2 score, a few studies have reported a moderate to good interobserver agreement (1112212223). Park et al. (11) found good agreement (κ = 0.758) on patient-based analysis, very similar to that observed (κ = 0.79) in a study of Zhang et al. (12). However, our study demonstrated only moderate interobserver agreement (κ = 0.41–0.47) for PI-RADS v2 score on patient-based analysis, which was in line with the previous studies (κ = 0.42–0.45) (2223). A six-observer study by Rosenkrantz et al. (21) demonstrated moderate agreement in the peripheral zone (κ = 0.593) and in the transition zone (κ = 0.509) for lesions. These might be explained by the differences in image quality caused by different MR scanners and acquisition parameters or different levels of experience in interpreting images.
Regarding the CSS, a recent study has reported that preoperative MRI may be used to predict CSS. In their study, positive MRI findings based on Likert scale was independent predictor of CSS, but DWI and DCEI were not included in MRI protocols (24). In our study, PI-RADS v2 score was not associated with CSS as compared with RFS or PFS. This might be explained by small study population including only 5 cancer-specific death patients or that better RFS or PFS does not suggest better CSS in PCa (25).
Our study has several limitations. First, this retrospective study was performed at a single institution with a relatively small number of patients. Also, several urologists with different level of experience had performed RP in our study, which might affect positive surgical margin resulting in biochemical recurrence. However, in our study, biochemical recurrence was found in 40.4% of patients, disease progression in 33.1% and PCa deaths in 3.0%, at 10 years following RP. These results were in line with those of previous studies on biochemical recurrence (123), progression (56), and PCa death (26). A multi-institutional study with larger population of patients is needed. Second, we did not evaluate predictive values of PI-RADS v2 score according to tumor location of peripheral zone versus transition zone. Owing to relatively small number of patients, we could not perform it. Finally, regarding PI-RADS v2 scoring, we did not use higher b values of > 1400 s/mm2 on DWI. However, a recent study has reported that the PI-RADS v2 scoring at 3T has excellent agreement between b = 1000 and b = 1500 s/mm2 on DWI in assessing PCa (27). However, a multi-institutional study is needed for validation.
In conclusion, our results demonstrated that the use of PI-RADS v2 scoring on preoperative mpMRI may help predict RFS and PFS after RP in patients with PCa. Our results warrant further prospective studies with larger patients' population for validation.
 XML Download