Journal List > Ann Lab Med > v.39(3) > 1111745

Park, Shin, Lee, Kim, and Lee: Diagnostic Accuracy of the Risk of Ovarian Malignancy Algorithm in Clinical Practice at a Single Hospital in Korea

Abstract

Background

The risk of ovarian malignancy algorithm (ROMA) is used for assessing ovarian cancer risk in women with a pelvic mass. Its diagnostic accuracy is variable. We investigated whether the clinically acceptable minimal sensitivity of >80.0% could be obtained with the suggested cutoff of 7.4%/25.3% for pre/postmenopausal women and with adjusted cutoffs set to a specificity of ≥75.0% or a sensitivity of 95.0%, in a hospital with a lower ovarian cancer (OC) prevalence than previously reported.

Methods

ROMA scores were calculated from measurements of human epididymis protein 4 and cancer antigen 125 in blood specimens from 443 patients with a pelvic mass. The ROMA-based risk group was compared against biopsy (N=309) or clinical follow-up with imaging (N=134) results. The ROMA sensitivity and specificity for predicting epithelial OC (EOC) and borderline ovarian tumor (BOT) were calculated for the suggested and adjusted cutoff values.

Results

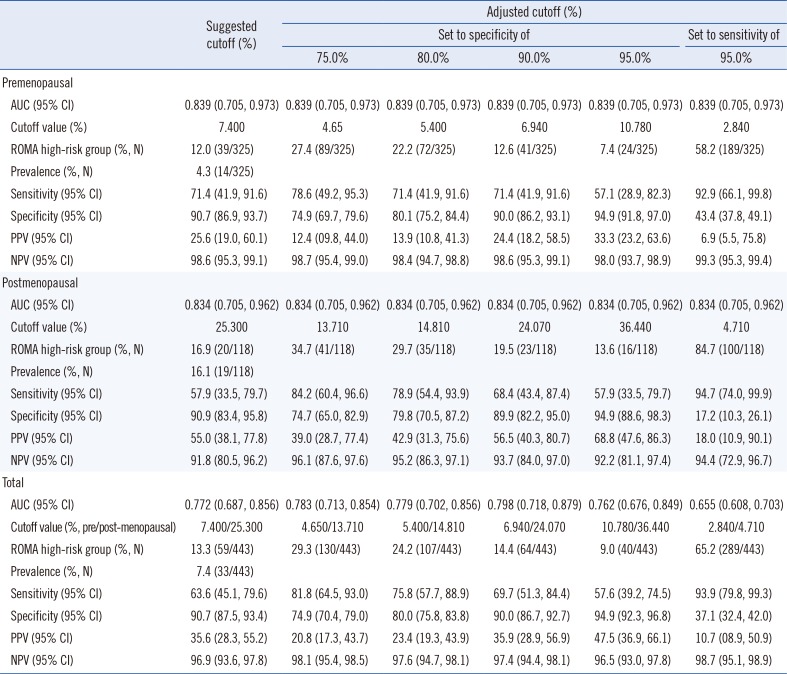
When targeting BOT and EOC, the prevalence was 7.4% and sensitivity and specificity at the suggested cutoff were 63.6% and 90.7%, respectively. Sensitivity was 81.8% at the 4.65%/13.71% cutoff set to a specificity of 75.0%. When targeting only EOC, the prevalence was 4.1% and sensitivity and specificity at the suggested cutoff were 77.8% and 89.4%, respectively. Sensitivity was 88.9% at the 4.78%/14.35% cutoff set to a specificity of 75.0%.

Conclusions

The sensitivity of ROMA was lower than expected when using the suggested cutoff. When using the adjusted cutoff, its sensitivity reached 80.0%.

INTRODUCTION

The Risk of Ovarian Malignancy Algorithm (ROMA) was developed for assessing the risk of ovarian cancer (OC) among women with a pelvic mass. The risk score is calculated based on serum human epididymis protein 4 (HE4) and cancer antigen 125 (CA125) concentrations and is then compared with cutoff values for high risk of OC. ROMA may be used by primary physicians or gynecologists who are not oncology specialists to decide whether to refer a patient to an appropriate center for surgery [123].
The cutoff ROMA score was determined according to the expected specificity or sensitivity needed by gynecologists in clinical studies wherein EOC and borderline ovarian tumor (BOT) or low malignant potential (LMP) tumor were considered as target conditions [24]. It is provided by the manufacturer of the HE4 and CA125 assays. However, different cutoffs have been used in ROMA evaluation studies [56], and attempts have been made to determine thresholds specific to the relevant study population [7891011]. Although there may be no significant difference in ROMA performance using suggested cutoff values and adjusted values [11], laboratories have been advised to establish optimized cutoff values for ROMA as well as HE4 according to the relevant study population [5].
Studies examining ROMA's diagnostic accuracy in detecting OC often calculate sensitivity at a set specificity of ≥75.0% and compare it with that of other markers such as Risk of Malignancy Index and Copenhagen Index [23411121314151617]. This is because a specificity of 75.0% has been generally assumed to be the clinically acceptable minimum [3]. The optimal ROMA cutoff score and clinical usefulness of the test were determined with a sensitivity >80.0% at a specificity of 75.0% [2418].
The reported sensitivity and specificity of ROMA are variable [4891215161719]. This variation has been attributed to differences in geographic backgrounds, the number of study subjects, and the analytic systems used for HE4 and CA125 measurements among studies [20]. Differences in the disease spectrum of the study populations and prevalence of target condition between the studies may also contribute to their inconsistent and variable findings [21]. Moore et al. [2] developed ROMA from a population with an OC prevalence of about 30.0% (151/503). Since then, the OC prevalence reported in ROMA diagnostic accuracy studies generally ranges between 15.7% and 45.8% [891516]. However, ROMA can be tested on a population with a lower EOC prevalence in real situations.
To our knowledge, no studies have established whether the clinically acceptable minimal sensitivity (>80.0%) and intended specificity (≥75.0%) can be obtained using the suggested cutoff of 7.4%/25.3% for pre/postmenopausal women in routine clinical practice, even in populations with a lower OC prevalence than that reported in diagnostic accuracy studies. We attempted to fill this gap. If the clinical expectation was not achieved with the suggested cutoff, we determined the adjusted cutoff value required.

METHODS

Study design and patients

This was a cross-sectional study conducted at Bucheon St. Mary's Hospital, Bucheon, Korea, between January 22, 2016, and August 18, 2017. Potentially eligible patients included a consecutive series of women aged >18 years for whom gynecologists had requested HE4, CA 125, and ROMA tests to evaluate a pelvic mass. Some patients were referred from primary clinics for work-up of a pelvic mass. The pathological examination and imaging study reports, such as pelvis ultrasonography (US), computed tomography (CT), or magnetic resonance imaging (MRI), were reviewed using the hospital information system (HIS), and eligible participants were selected based on the following inclusion criteria:
  • (1) Patients with available pathological examination reports of a biopsy taken during gynecologic surgery following the ROMA test and no previous history of ovarian malignancy or related findings in imaging studies of the pelvis or in pathological examination of tissue biopsy.

  • (2) Patients with imaging studies conducted at the time of the ROMA test and following a minimum follow-up interval of four weeks who had not undergone any gynecologic surgery or biopsy examination following the ROMA test.

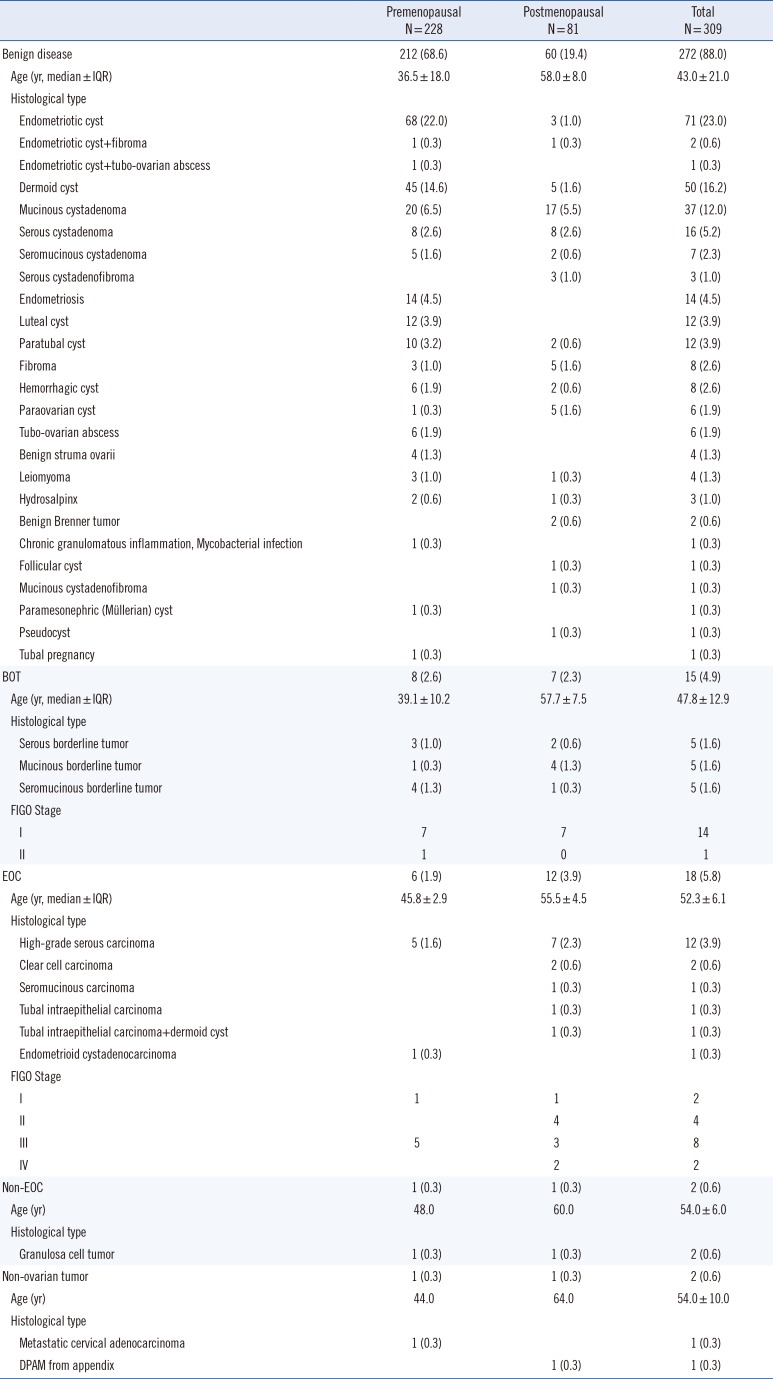
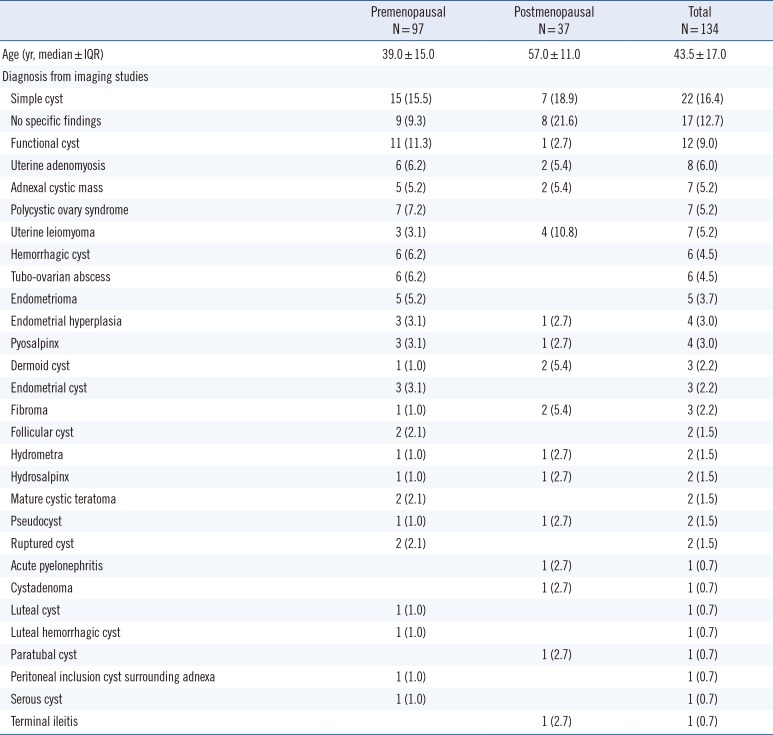
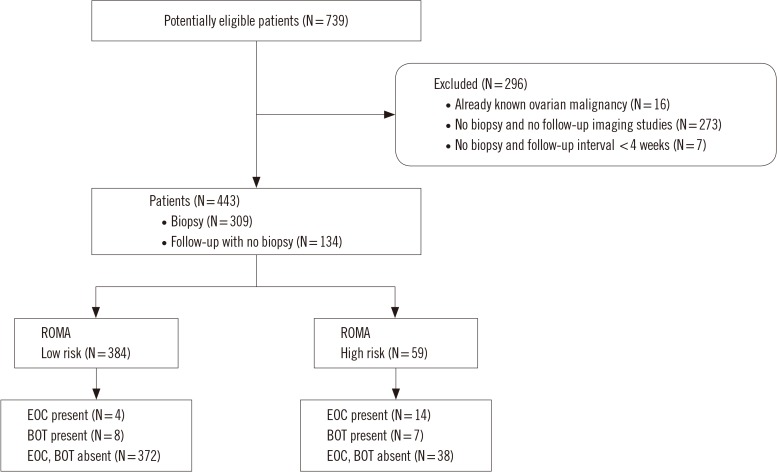
Blood specimens from 739 potentially eligible patients were analyzed for HE4, CA125, and ROMA score. A total of 296 patients were excluded, and the remaining 443 patients were included in the study. A minimum four-week follow-up by imaging studies was considered as the reference standard for 134 patients with no biopsy; they were considered to have benign conditions. The patient flow chart is shown in Fig. 1. The clinical characteristics of the biopsy-proven patients and patients followed up with imaging studies are shown in Tables 1 and 2, respectively. The median follow-up interval was 29.0 weeks.
This study was approved by the Institutional Review Board of the Catholic Medical Center at the Catholic University of Korea, and the requirement to obtain informed consent from the study patients was waived (HC17RESE0086).

Test methods and reference standards

The blood specimens for the ROMA test were drawn prior to the pelvic mass biopsy surgery. HE4 and CA125 concentrations were measured on the day of blood collection using the ARCHITECT HE4 assay (Product Number: B2P540) and the CA 125 II assay (Product Number: B2K450) (Abbott Diagnostics, Abbott Park, IL, USA). The HE4 CVs based on control material measurements were 7.47%, 7.38%, and 5.93% with mean concentrations of 49.29, 175.03, and 698.94 pmol/L, respectively. The CA125 CVs were 5.35%, 5.54%, and 4.88% with mean concentrations of 39.40, 300.94, and 646.87 kU/L, respectively. During the study period, the measurement system was maintained in a controlled state. The ROMA score was calculated using the following equations, according to the manufacturer's instructions:
Premenopausal
Prediction index (PI)= −12.0+2.38–ln(HE4)+0.0626×ln(CA 125)
Postmenopausal
Prediction index (PI)= −8.09+1.04×ln(HE4)+0.732×ln(CA 125)
ROMA score (predictive probability)= exp(PI)/(1+exp(PI))×100
The ROMA score was reported on the same day to the requesting gynecologist through the HIS. ROMA scores >7.4% in premenopausal and >25.3% in postmenopausal women were considered high risk, according to the manufacturer's instructions. Menopausal status was determined by gynecologists during history taking and physical examination. Postmenopausal status was assigned to patients with “no menstruation” period of over one year prior to blood specimen collection or to patients who had undergone a hysterectomy with bilateral oophorectomy. When the HE4, CA125, and ROMA tests were performed, no clinical information regarding the patient was provided to the laboratory staff.
Pathological examination of biopsied tissue during pelvic mass surgery was used as the reference standard. However, when the likelihood of malignancy was low according to the clinical view of the gynecologists and the imaging studies, surgery was not performed, and clinical follow-up was usually preferred. In routine clinical practice, because the probability of a patient being subjected to an invasive reference standard depends on the likelihood of target conditions, the diagnostic accuracy estimated based on the actual situation could be biased [22]. Therefore, for patients with no available pathological examination results of biopsied tissue, the pelvis US, CT, or MRI examinations performed at the time of the ROMA test and follow-up were considered as alternative reference standards under limited conditions [23]. If the imaging study follow-up interval was longer than four weeks, and there were no findings related to or suggestive of malignancy in the pelvic cavity at the time of the ROMA test and follow-up, it was considered a negative result for the reference standard. A positive result for the reference standard required pathological examination of the pelvic mass biopsy.

Statistical analysis

Sensitivity, specificity, positive predictive value (PPV), negative predictive value (NPV), high-risk proportion of ROMA, and prevalence were estimated during the study period using the cutoff suggested by the manufacturer. The same parameters were calculated with an applied specificity cutoff of 75.0%, 80.0%, 90.0%, or 95.0% or a sensitivity cutoff of 95.0% and compared with those based on the suggested cutoff. Two analyses were performed for the same dataset. In the first analysis, BOT and EOC were considered as target conditions, while in the second analysis, the target condition was only EOC. For all parameters, 95% confidence intervals (CI) were obtained. The sensitivity, specificity, PPV, and NPV at each cutoff were calculated using the Optimal Cutpoints package [24] for R 3.4.3 statistical software [25] on a Windows 7 (Microsoft, Redmond, WA, USA) personal computer.

RESULTS

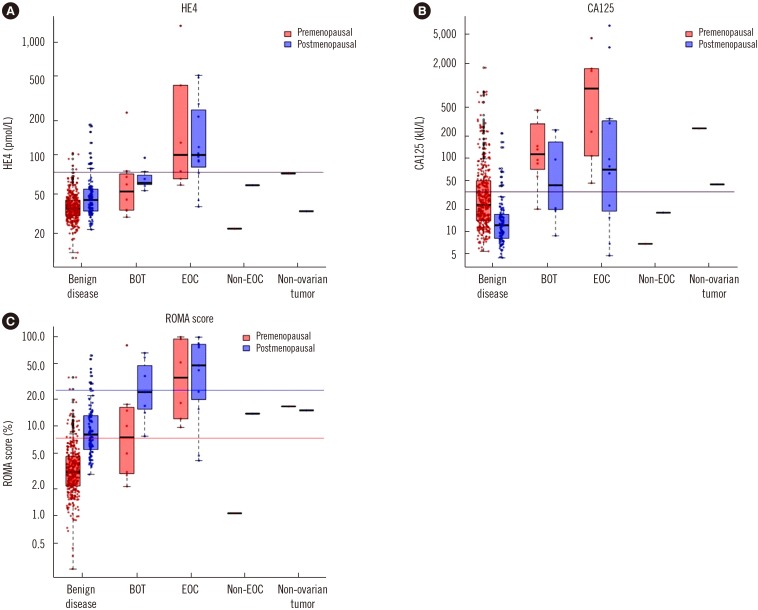
The distributions of serum HE4, CA125, and ROMA scores are shown in Fig. 2. The patient distributions between the conditions determined by reference standard and ROMA risk groups, according to the manufacturer's suggested cutoff, are shown in Table 3. ROMA diagnostic accuracy parameters (i.e., sensitivity, specificity, PPV, and NPV) were calculated using the suggested cutoff of 7.4%/25.3%; with specificity cutoffs of 75.0%, 80.0%, 90.0%, or 95.0%; or with a sensitivity cutoff of 95.0% (Table 4 and Supplemental Data Table S1).
Considering BOT and EOC as the target condition, the cutoff set to a specificity of 75.0% was 4.65%/13.71%, with a sensitivity of 81.8%. The adjusted cutoff for BOT and EOC was also lower than the suggested cut off, 7.40%/25.30% (Table 4). Considering EOC as the target condition, the cutoff (pre/postmenopausal) at a specificity of 75.0% was 4.78%/14.35%, which was lower than the suggested cutoff, 7.40%/25.30%; when the adjusted cutoff was applied, the sensitivity was 88.9% (Supplemental Data Table S1).

DISCUSSION

We aimed to determine whether ROMA could reach the clinically acceptable minimal sensitivity and the intended specificity in clinical practice for a patient population with a lower prevalence of OC when using the suggested cutoff, and to determine an adjusted cutoff to achieve the expected specificity or sensitivity.
When BOT and EOC were considered as target conditions, the sensitivity of ROMA using the suggested cutoff was much lower than the clinically acceptable minimum of 80.0%. The specificity remained considerably higher than the 75.0% specificity intended. Using the adjusted cutoff, the sensitivity reached 80.0%. Considering only EOC as the target condition, the sensitivity of ROMA was slightly lower than or close to the clinically acceptable minimal value even with the suggested cutoff. The specificity was much higher than the intended specificity. After adjusting the cutoff value, the sensitivity of ROMA would be higher than the acceptable minimum.
Several ROMA studies have used the ARCHITECT HE4 and CA 125 assay. Chan et al. [8] used the suggested cutoff of 7.4%/25.3% for a population of Asian women with an EOC prevalence of 15.7% and reported that the sensitivity, specificity, PPV, and NPV of ROMA were 89.2%, 87.3%, 58.6%, and 97.6%, respectively. Their EOC prevalence was three to four times higher than that reported in this study (4.1%). Although sensitivity and PPV were higher than those in the current study, specificity and NPV were similar. Karlsen et al. [15] used the suggested cutoff of 7.4%/25.3% to identify EOC and reported a sensitivity of 93.9%/97.5% (pre/postmenopausal women) and specificity of 52.6%/57.0% (pre/postmenopausal women). Specificity was lower than intended, while sensitivity met the clinically acceptable minimum. Conversely, specificity was 76.5% using a cutoff set to a sensitivity of 94.4%, while sensitivity was 94.8% using a cutoff set to a specificity of 75.0%. In both cases, the acceptable minimal specificity of 75.0% and sensitivity of 80.0% were achieved. This was also observed in the current study. Although the EOC prevalence in the study by Karlsen et al. [15] was 21.0%, five times higher than that reported in this study (4.1%), the sensitivity (88.9% with a cutoff set to a specificity of 75.0%) and specificity (73.6% with a cutoff set to a sensitivity of 95.0%) in the current study were slightly lower, but similar to their reported sensitivity (94.8% with a cutoff set to a specificity of 75.0%) and specificity (76.5% with a cutoff set to a sensitivity of 94.4%) [15].
Winarto et al. [9] reported that the sensitivity, specificity, PPV, and NPV of ROMA with the suggested cutoffs of 7.4%/25.3% were 94.0%, 42.6%, 57.3%, and 89.7%, respectively, for identifying EOC in a study population with a prevalence of 39.1%. When identifying BOT as well as EOC in the same study, the parameters were 91.0%, 42.6%, 63.5%, and 81.3% while the prevalence was 52.3% in the population [9]. In the study by Moore et al. [3], the sensitivity, PPV, and NPV of ROMA at a set specificity of 75.0% were 94.3%, 59.8%, and 97.1%, respectively, for EOC with prevalence of 28.0%. When targeting BOT and EOC in the same study, the parameters were 89.0%, 62.3%, and 93.6% while the prevalence was 32.0% [3]. The findings in the two studies [39] were consistent with our results that the sensitivity (63.6% vs 77.8%) and NPV (96.9% vs 99.0%) of targeting BOT and EOC were lower while PPV was higher (35.6% vs 23.7%) than those of targeting EOC only for the same study population. Their higher sensitivity and PPV with lower specificity and NPV, relative to those of the current study, may be due to their much higher prevalence.
According to Sandri et al. [16], when applying the suggested cutoff of 7.4%/25.3% for their population with an EOC prevalence of 45.8% (160/349), the sensitivity and the specificity of ROMA were 89.3% and 81.7%, respectively. The sensitivity of ROMA at a set specificity of 75.0%, 80.0%, and 90.0% was 91.2%, 91.3%, and 84.4%, respectively [16]. Both the suggested cutoff and the cutoff set to a specificity reached the acceptable minimal values for sensitivity (>80.0%) and specificity (≥75.0%). Kim et al. [19] determined the thresholds with a specificity of 95% in a study involving subjects with the same ethnic background as that in this study. The reported EOC and BOT prevalence was 47.1% (72/153). Using the resultant cutoffs of 7.6%/10.9%, sensitivity was 87.5%. In the current study, the cutoffs set to a specificity of 95% were 10.78%/36.44%, with a low sensitivity of 57.6%, when EOC and BOT were considered as target conditions. Across three [8915] of four studies using the ARCHITECT HE4 and CA 125 assays and the suggested cutoff value for identifying EOC [891516], lower EOC prevalence was accompanied by lower sensitivity and higher specificity, even though the range of prevalence in those three studies was limited and far from that of the current study (4.1%). Lower sensitivity and higher specificity were observed with the suggested cutoff in the population with a lower OC prevalence, consistent with our findings. Therefore, we infer that the sensitivity and specificity of ROMA in clinical practice may be different from that reported in previous studies, particularly in hospitals with a lower OC prevalence.
One further factor requires consideration. If ROMA diagnostic accuracy studies are conducted at relatively large hospitals receiving referrals of patients with suspected OC, the OC prevalence reported in those studies is likely to be high [389151619]. However, the OC prevalence among patients encountered in clinical practice in the referring hospitals may be lower than that reported in previous ROMA diagnostic accuracy studies. Moreover, the patient spectrum relevant to the target condition may differ between referral-receiving hospitals and referring hospitals. Our institute is a middle-to-large-sized secondary hospital; accordingly, it accepts referrals from primary clinics and also refers patients across all departments to tertiary hospitals. Therefore, the OC prevalence was likely lower than that reported in other ROMA diagnostic accuracy studies [389151619].
This study has some limitations. Because the OC prevalence was low, subgroup analyses according to histological type and stage were not feasible. In addition, as clinical follow-up with imaging studies was used as an alternative for patients with no pathological examination, two types of reference standards were used. The adjusted cutoff values derived from the current study should be applied to other patient groups in future studies for validation.
To our knowledge, this is the first study examining the diagnostic accuracy of ROMA in clinical practice at a middle-to-large sized institute where the OC prevalence was as low as that of a hospital referring patients with pelvic mass to gynecologic oncologists at a tertiary care center. As the study population was a consecutive series of patients, this study reflects the real clinical situation of a referring hospital.
In conclusion, when the cutoff suggested by the manufacturer was used in clinical practice for a patient population with a lower OC prevalence, the intended specificity of 75.0% was clearly exceeded. However, the minimal acceptable sensitivity was not achieved when both BOT and EOC were considered as the target condition. Conversely, the sensitivity almost reached the acceptable minimum of 80.0% when EOC was the only target condition. When the cutoff value was modified to set the specificity to 75.0%, the sensitivity increased to a level above the acceptable minimum, both when EOC and BOT and only EOC were used as the target condition. Finally, the expected diagnostic accuracy of ROMA may not be observed in all hospitals, depending on the characteristics of the patient population and the prevalence of the target condition.

Notes

Authors' Disclosures of Potential Conflicts of Interest: No potential conflicts of interest relevant to this article were reported.

AUTHOR CONTRIBUTION STATEMENT:

  • Conceptualization: Haeil Park.

  • Study design: Haeil Park and Hae Nam Lee.

  • Administration: Haeil Park and Hae Nam Lee.

  • Provision of patients: Jae Eun Shin, Dae Woo Lee, Min Jeong Kim, and Hae Nam Lee.

  • Collection and assembly of data: Haeil Park and Hae Nam Lee.

  • Data analysis and interpretation: Haeil Park and Hae Nam Lee.

  • Manuscript writing (original draft): Haeil Park and Hae Nam Lee.

  • Manuscript writing (review and editing): Haeil Park, Jae Eun Shin, Dae Woo Lee, Min Jeong Kim, and Hae Nam Lee.

  • Final approval of manuscript: Haeil Park, Jae Eun Shin, Dae Woo Lee, Min Jeong Kim, and Hae Nam Lee.

References

1. Moore RG, Brown AK, Miller MC, Skates S, Allard WJ, Verch T, et al. The use of multiple novel tumor biomarkers for the detection of ovarian carcinoma in patients with a pelvic mass. Gynecol Oncol. 2008; 108:402–408. PMID: 18061248.
2. Moore RG, McMeekin DS, Brown AK, DiSilvestro P, Miller MC, Allard WJ, et al. A novel multiple marker bioassay utilizing HE4 and CA125 for the prediction of ovarian cancer in patients with a pelvic mass. Gynecol Oncol. 2009; 112:40–46. PMID: 18851871.
3. Moore RG, Jabre-Raughley M, Brown AK, Robison KM, Miller MC, Allard WJ, et al. Comparison of a novel multiple marker assay vs the Risk of Malignancy Index for the prediction of epithelial ovarian cancer in patients with a pelvic mass. Am J Obstet Gynecol. 2010; 203:228.e1–228.e6. PMID: 20471625.
4. Moore RG, Miller MC, Disilvestro P, Landrum LM, Gajewski W, Ball JJ, et al. Evaluation of the diagnostic accuracy of the risk of ovarian malignancy algorithm in women with a pelvic mass. Obstet Gynecol. 2011; 118:280–288. PMID: 21775843.
5. Jia LT, Zhang YC, Li J, Tian Y, Li JF. The role of human epididymis protein 4 in the diagnosis of epithelial ovarian cancer. Clin Transl Oncol. 2016; 18:233–239. PMID: 26220095.
6. Dayyani F, Uhlig S, Colson B, Simon K, Rolny V, Morgenstern D, et al. Diagnostic performance of Risk of Ovarian Malignancy Algorithm against CA125 and HE4 in connection with ovarian cancer: a meta-analysis. Int J Gynecol Cancer. 2016; 26:1586–1593. PMID: 27540691.
7. Farzaneh F, Honarvar Z, Yaraghi M, Yaseri M, Arab M, Hosseini M, et al. Preoperative evaluation of risk of ovarian malignancy algorithm index in prediction of malignancy of adnexal masses. Iran Red Crescent Med J. 2014; 16:e17185. PMID: 25068046.
8. Chan KK, Chen CA, Nam JH, Ochiai K, Wilailak S, Choon AT, et al. The use of HE4 in the prediction of ovarian cancer in Asian women with a pelvic mass. Gynecol Oncol. 2013; 128:239–244. PMID: 23063998.
9. Winarto H, Laihad BJ, Nuranna L. Modification of cutoff values for HE4, CA125, the Risk of Malignancy Index, and the Risk of Malignancy Algorithm for ovarian cancer detection in Jakarta, Indonesia. Asian Pac J Cancer Prev. 2014; 15:1949–1953. PMID: 24716917.
10. Chen X, Zhou H, Chen R, He J, Wang Y, Huang L, et al. Development of a multimarker assay for differential diagnosis of benign and malignant pelvic masses. Clin Chim Acta. 2015; 440:57–63. PMID: 25447698.
11. Xu Y, Zhong R, He J, Ding R, Lin H, Deng Y, et al. Modification of cut-off values for HE4, CA125 and the ROMA algorithm for early-stage epithelial ovarian cancer detection: results from 1021 cases in South China. Clin Biochem. 2016; 49:32–40. PMID: 26285075.
12. Karlsen MA, Høgdall EV, Christensen IJ, Borgfeldt C, Kalapotharakos G, Zdrazilova-Dubska L, et al. A novel diagnostic index combining HE4, CA125 and age may improve triage of women with suspected ovarian cancer–an international multicenter study in women with an ovarian mass. Gynecol Oncol. 2015; 138:640–646. PMID: 26086566.
13. Ruggeri G, Bandiera E, Zanotti L, Belloli S, Ravaggi A, Romani C, et al. HE4 and epithelial ovarian cancer: comparison and clinical evaluation of two immunoassays and a combination algorithm. Clin Chim Acta. 2011; 412:1447–1453. PMID: 21557935.
14. Lenhard M, Stieber P, Hertlein L, Kirschenhofer A, Fürst S, Mayr D, et al. The diagnostic accuracy of two human epididymis protein 4 (HE4) testing systems in combination with CA125 in the differential diagnosis of ovarian masses. Clin Chem Lab Med. 2011; 49:2081–2088. PMID: 21923475.
15. Karlsen MA, Sandhu N, Høgdall C, Christensen IJ, Nedergaard L, Lundvall L, et al. Evaluation of HE4, CA125, risk of ovarian malignancy algorithm (ROMA) and risk of malignancy index (RMI) as diagnostic tools of epithelial ovarian cancer in patients with a pelvic mass. Gynecol Oncol. 2012; 127:379–383. PMID: 22835718.
16. Sandri MT, Bottari F, Franchi D, Boveri S, Candiani M, Ronzoni S, et al. Comparison of HE4, CA125 and ROMA algorithm in women with a pelvic mass: correlation with pathological outcome. Gynecol Oncol. 2013; 128:233–238. PMID: 23200911.
17. Romagnolo C, Leon AE, Fabricio ASC, Taborelli M, Polesel J, Del Pup L, et al. HE4, CA125 and risk of ovarian malignancy algorithm (ROMA) as diagnostic tools for ovarian cancer in patients with a pelvic mass: an Italian multicenter study. Gynecol Oncol. 2016; 141:303–311. PMID: 26801941.
18. U.S. Food and Drug Administration. K103358 ROMA (HE4 EIA + Architect CA 125 II) 510(k) Substantial equivalence determination decision summary. Updated on Oct 2018. https://www.accessdata.fda.gov/cdrh_docs/reviews/K103358.pdf.
19. Kim YM, Whang DH, Park J, Kim SH, Lee SW, Park HA, et al. Evaluation of the accuracy of serum human epididymis protein 4 in combination with CA125 for detecting ovarian cancer: a prospective case-control study in a Korean population. Clin Chem Lab Med. 2011; 49:527–534. PMID: 21320028.
20. Granato T, Porpora MG, Longo F, Angeloni A, Manganaro L, Anastasi E. HE4 in the differential diagnosis of ovarian masses. Clin Chim Acta. 2015; 446:147–155. PMID: 25892674.
21. Irwig LM, Bossuyt PMM, Glasziou PP, Gatsonis C, Lijmer JG. Designing studies to ensure that estimates of test accuracy will travel. In : Knottnerus JA, Buntinx F, editors. The evidence base of clinical diagnosis: theory and methods of diagnostic research. 2nd ed. West Sussex, UK: Blackwell Publishing Ltd. BMJ Books;2009. p. 96–117.
22. Haynes RB, You JJ. The architecture of diagnostic research. In : Knottnerus JA, Buntinx F, editors. The evidence base of clinical diagnosis: theory and methods of diagnostic research. 2nd ed. West Sussex, UK: Blackwell Publishing Ltd. BMJ Books;2009. p. 20–41.
23. Knottnerus JA, Muris JW. Assessment of the accuracy of diagnostic tests: the cross-sectional study. In : Knottnerus JA, Buntinx F, editors. The evidence base of clinical diagnosis: theory and methods of diagnostic research. 2nd ed. West Sussex, UK: Blackwell Publishing Ltd. BMJ Books;2009. p. 42–62.
24. López-Ratón M, Rodríguez-Álvarez MX, Cadarso-Suárez C, Gude-Sampedro F. Optimal Cutpoints: an R package for selecting optimal cut points in diagnostic tests. J Stat Softw. 2014; 61:1–36.
25. R Core Team. R: a language and environment for statistical computing. Vienna, Austria: R Foundation for Statistical Computing;Updated on Sep 2018. https://www.R-project.org.
SUPPLEMENTARY MATERIAL

Supplemental Data Table S1

Diagnostic accuracy of ROMA with the suggested cutoff and adjusted cutoffs set at different specificities ≥75.0% and sensitivity set to 95.0% (N=443; target condition: EOC [N=18] vs others [N=425])
alm-39-252-s001.pdf
Fig. 1

Flow chart of patients.

Abbreviations: ROMA, risk of ovarian malignancy algorithm; EOC, epithelial ovarian cancer; BOT, borderline ovarian tumor.
alm-39-252-g001
Fig. 2

Serum concentrations of (A) HE4, (B) CA125, and (C) ROMA for each disease group and menopausal status (N=443). The cutoffs are shown as horizontal lines.

Abbreviations: HE4, human epididymis protein 4; CA125, cancer antigen 125; ROMA, risk of ovarian malignancy algorithm; BOT, borderline ovarian tumor; EOC, epithelial ovarian cancer; Non-EOC, non-epithelial ovarian cancer.
alm-39-252-g002
Table 1

Clinical characteristics of patients for whom a biopsy was performed (N=309)

alm-39-252-i001
Premenopausal N=228 Postmenopausal N=81 Total N=309
Benign disease 212 (68.6) 60 (19.4) 272 (88.0)
 Age (yr, median ± IQR) 36.5 ± 18.0 58.0 ± 8.0 43.0 ± 21.0
 Histological type
  Endometriotic cyst 68 (22.0) 3 (1.0) 71 (23.0)
  Endometriotic cyst+fibroma 1 (0.3) 1 (0.3) 2 (0.6)
  Endometriotic cyst+tubo-ovarian abscess 1 (0.3) 1 (0.3)
  Dermoid cyst 45 (14.6) 5 (1.6) 50 (16.2)
  Mucinous cystadenoma 20 (6.5) 17 (5.5) 37 (12.0)
  Serous cystadenoma 8 (2.6) 8 (2.6) 16 (5.2)
  Seromucinous cystadenoma 5 (1.6) 2 (0.6) 7 (2.3)
  Serous cystadenofibroma 3 (1.0) 3 (1.0)
  Endometriosis 14 (4.5) 14 (4.5)
  Luteal cyst 12 (3.9) 12 (3.9)
  Paratubal cyst 10 (3.2) 2 (0.6) 12 (3.9)
  Fibroma 3 (1.0) 5 (1.6) 8 (2.6)
  Hemorrhagic cyst 6 (1.9) 2 (0.6) 8 (2.6)
  Paraovarian cyst 1 (0.3) 5 (1.6) 6 (1.9)
  Tubo-ovarian abscess 6 (1.9) 6 (1.9)
  Benign struma ovarii 4 (1.3) 4 (1.3)
  Leiomyoma 3 (1.0) 1 (0.3) 4 (1.3)
  Hydrosalpinx 2 (0.6) 1 (0.3) 3 (1.0)
  Benign Brenner tumor 2 (0.6) 2 (0.6)
  Chronic granulomatous inflammation, Mycobacterial infection 1 (0.3) 1 (0.3)
  Follicular cyst 1 (0.3) 1 (0.3)
  Mucinous cystadenofibroma 1 (0.3) 1 (0.3)
  Paramesonephric (Müllerian) cyst 1 (0.3) 1 (0.3)
  Pseudocyst 1 (0.3) 1 (0.3)
  Tubal pregnancy 1 (0.3) 1 (0.3)
BOT 8 (2.6) 7 (2.3) 15 (4.9)
 Age (yr, median ± IQR) 39.1 ± 10.2 57.7 ± 7.5 47.8 ± 12.9
 Histological type
  Serous borderline tumor 3 (1.0) 2 (0.6) 5 (1.6)
  Mucinous borderline tumor 1 (0.3) 4 (1.3) 5 (1.6)
  Seromucinous borderline tumor 4 (1.3) 1 (0.3) 5 (1.6)
 FIGO Stage
  I 7 7 14
  II 1 0 1
EOC 6 (1.9) 12 (3.9) 18 (5.8)
 Age (yr, median±IQR) 45.8±2.9 55.5±4.5 52.3±6.1
 Histological type
  High-grade serous carcinoma 5 (1.6) 7 (2.3) 12 (3.9)
  Clear cell carcinoma 2 (0.6) 2 (0.6)
  Seromucinous carcinoma 1 (0.3) 1 (0.3)
  Tubal intraepithelial carcinoma 1 (0.3) 1 (0.3)
  Tubal intraepithelial carcinoma+dermoid cyst 1 (0.3) 1 (0.3)
  Endometrioid cystadenocarcinoma 1 (0.3) 1 (0.3)
 FIGO Stage
  I 1 1 2
  II 4 4
  III 5 3 8
  IV 2 2
Non-EOC 1 (0.3) 1 (0.3) 2 (0.6)
 Age (yr) 48.0 60.0 54.0±6.0
 Histological type
  Granulosa cell tumor 1 (0.3) 1 (0.3) 2 (0.6)
Non-ovarian tumor 1 (0.3) 1 (0.3) 2 (0.6)
 Age (yr) 44.0 64.0 54.0±10.0
 Histological type
  Metastatic cervical adenocarcinoma 1 (0.3) 1 (0.3)
  DPAM from appendix 1 (0.3) 1 (0.3)

Except for age, data are presented as number (percentage).

Abbreviations: IQR, interquartile range; BOT, borderline ovarian tumor; FIGO, Fédération Internationale de Gynécologie et d'Obstétrique; EOC, epithelial ovarian cancer; Non-EOC, non-epithelial ovarian cancer; DPAM, disseminated peritoneal adenomucinosis.

Table 2

Clinical characteristics of patients with benign disease for whom imaging studies were performed (N=134)

alm-39-252-i002
Premenopausal N = 97 Postmenopausal N = 37 Total N = 134
Age (yr, median ± IQR) 39.0 ± 15.0 57.0 ± 11.0 43.5 ± 17.0
Diagnosis from imaging studies
 Simple cyst 15 (15.5) 7 (18.9) 22 (16.4)
 No specific findings 9 (9.3) 8 (21.6) 17 (12.7)
 Functional cyst 11 (11.3) 1 (2.7) 12 (9.0)
 Uterine adenomyosis 6 (6.2) 2 (5.4) 8 (6.0)
 Adnexal cystic mass 5 (5.2) 2 (5.4) 7 (5.2)
 Polycystic ovary syndrome 7 (7.2) 7 (5.2)
 Uterine leiomyoma 3 (3.1) 4 (10.8) 7 (5.2)
 Hemorrhagic cyst 6 (6.2) 6 (4.5)
 Tubo-ovarian abscess 6 (6.2) 6 (4.5)
 Endometrioma 5 (5.2) 5 (3.7)
 Endometrial hyperplasia 3 (3.1) 1 (2.7) 4 (3.0)
 Pyosalpinx 3 (3.1) 1 (2.7) 4 (3.0)
 Dermoid cyst 1 (1.0) 2 (5.4) 3 (2.2)
 Endometrial cyst 3 (3.1) 3 (2.2)
 Fibroma 1 (1.0) 2 (5.4) 3 (2.2)
 Follicular cyst 2 (2.1) 2 (1.5)
 Hydrometra 1 (1.0) 1 (2.7) 2 (1.5)
 Hydrosalpinx 1 (1.0) 1 (2.7) 2 (1.5)
 Mature cystic teratoma 2 (2.1) 2 (1.5)
 Pseudocyst 1 (1.0) 1 (2.7) 2 (1.5)
 Ruptured cyst 2 (2.1) 2 (1.5)
 Acute pyelonephritis 1 (2.7) 1 (0.7)
 Cystadenoma 1 (2.7) 1 (0.7)
 Luteal cyst 1 (1.0) 1 (0.7)
 Luteal hemorrhagic cyst 1 (1.0) 1 (0.7)
 Paratubal cyst 1 (2.7) 1 (0.7)
 Peritoneal inclusion cyst surrounding adnexa 1 (1.0) 1 (0.7)
 Serous cyst 1 (1.0) 1 (0.7)
 Terminal ileitis 1 (2.7) 1 (0.7)

Except for age, data are presented as number (percentage).

Abbreviation: IQR, interquartile range.

Table 3

Patient distribution of ROMA risk groups according to disease status (N=443)

alm-39-252-i003
Menopausal status Cutoff (%) ROMA risk group Benign disease BOT EOC Non-EOC Non-ovarian tumor Total
Premenopausal 7.4 Low 281 4 0 1 0 286
High 28 4 6 0 1 39
Total 309 8 6 1 1 325
Postmenopausal 25.3 Low 88 4 4 1 1 98
High 9 3 8 0 0 20
Total 97 7 12 1 1 118
Total 7.4/25.3 Low 369 8 4 2 1 384
High 37 7 14 0 1 59
Total 406 15 18 2 2 443

Abbreviations: ROMA, risk of ovarian malignancy algorithm; BOT, borderline ovarian tumor; EOC, epithelial ovarian cancer; Non-EOC, non-epithelial ovarian cancer

Table 4

Diagnostic accuracy of ROMA with the suggested cutoff and adjusted cutoffs set at different specificities ≥75.0% and sensitivity set to 95.0% (N=443; target condition: EOC+BOT [N=33] vs others [N=410])

alm-39-252-i004
Suggested cutoff (%) Adjusted cutoff (%)
Set to specificity of Set to sensitivity of
75.0% 80.0% 90.0% 95.0% 95.0%
Premenopausal
 AUC (95% CI) 0.839 (0.705, 0.973) 0.839 (0.705, 0.973) 0.839 (0.705, 0.973) 0.839 (0.705, 0.973) 0.839 (0.705, 0.973) 0.839 (0.705, 0.973)
 Cutoff value (%) 7.400 4.65 5.400 6.940 10.780 2.840
 ROMA high-risk group (%, N) 12.0 (39/325) 27.4 (89/325) 22.2 (72/325) 12.6 (41/325) 7.4 (24/325) 58.2 (189/325)
 Prevalence (%, N) 4.3 (14/325)
 Sensitivity (95% CI) 71.4 (41.9, 91.6) 78.6 (49.2, 95.3) 71.4 (41.9, 91.6) 71.4 (41.9, 91.6) 57.1 (28.9, 82.3) 92.9 (66.1, 99.8)
 Specificity (95% CI) 90.7 (86.9, 93.7) 74.9 (69.7, 79.6) 80.1 (75.2, 84.4) 90.0 (86.2, 93.1) 94.9 (91.8, 97.0) 43.4 (37.8, 49.1)
 PPV (95% CI) 25.6 (19.0, 60.1) 12.4 (09.8, 44.0) 13.9 (10.8, 41.3) 24.4 (18.2, 58.5) 33.3 (23.2, 63.6) 6.9 (5.5, 75.8)
 NPV (95% CI) 98.6 (95.3, 99.1) 98.7 (95.4, 99.0) 98.4 (94.7, 98.8) 98.6 (95.3, 99.1) 98.0 (93.7, 98.9) 99.3 (95.3, 99.4)
Postmenopausal
 AUC (95% CI) 0.834 (0.705, 0.962) 0.834 (0.705, 0.962) 0.834 (0.705, 0.962) 0.834 (0.705, 0.962) 0.834 (0.705, 0.962) 0.834 (0.705, 0.962)
 Cutoff value (%) 25.300 13.710 14.810 24.070 36.440 4.710
 ROMA high-risk group (%, N) 16.9 (20/118) 34.7 (41/118) 29.7 (35/118) 19.5 (23/118) 13.6 (16/118) 84.7 (100/118)
 Prevalence (%, N) 16.1 (19/118)
 Sensitivity (95% CI) 57.9 (33.5, 79.7) 84.2 (60.4, 96.6) 78.9 (54.4, 93.9) 68.4 (43.4, 87.4) 57.9 (33.5, 79.7) 94.7 (74.0, 99.9)
 Specificity (95% CI) 90.9 (83.4, 95.8) 74.7 (65.0, 82.9) 79.8 (70.5, 87.2) 89.9 (82.2, 95.0) 94.9 (88.6, 98.3) 17.2 (10.3, 26.1)
 PPV (95% CI) 55.0 (38.1, 77.8) 39.0 (28.7, 77.4) 42.9 (31.3, 75.6) 56.5 (40.3, 80.7) 68.8 (47.6, 86.3) 18.0 (10.9, 90.1)
 NPV (95% CI) 91.8 (80.5, 96.2) 96.1 (87.6, 97.6) 95.2 (86.3, 97.1) 93.7 (84.0, 97.0) 92.2 (81.1, 97.4) 94.4 (72.9, 96.7)
Total
 AUC (95% CI) 0.772 (0.687, 0.856) 0.783 (0.713, 0.854) 0.779 (0.702, 0.856) 0.798 (0.718, 0.879) 0.762 (0.676, 0.849) 0.655 (0.608, 0.703)
 Cutoff value (%, pre/post-menopausal) 7.400/25.300 4.650/13.710 5.400/14.810 6.940/24.070 10.780/36.440 2.840/4.710
 ROMA high-risk group (%, N) 13.3 (59/443) 29.3 (130/443) 24.2 (107/443) 14.4 (64/443) 9.0 (40/443) 65.2 (289/443)
 Prevalence (%, N) 7.4 (33/443)
 Sensitivity (95% CI) 63.6 (45.1, 79.6) 81.8 (64.5, 93.0) 75.8 (57.7, 88.9) 69.7 (51.3, 84.4) 57.6 (39.2, 74.5) 93.9 (79.8, 99.3)
 Specificity (95% CI) 90.7 (87.5, 93.4) 74.9 (70.4, 79.0) 80.0 (75.8, 83.8) 90.0 (86.7, 92.7) 94.9 (92.3, 96.8) 37.1 (32.4, 42.0)
 PPV (95% CI) 35.6 (28.3, 55.2) 20.8 (17.3, 43.7) 23.4 (19.3, 43.9) 35.9 (28.9, 56.9) 47.5 (36.9, 66.1) 10.7 (08.9, 50.9)
 NPV (95% CI) 96.9 (93.6, 97.8) 98.1 (95.4, 98.5) 97.6 (94.7, 98.1) 97.4 (94.4, 98.1) 96.5 (93.0, 97.8) 98.7 (95.1, 98.9)

Abbreviations: ROMA, risk of ovarian malignancy algorithm; EOC, epithelial ovarian cancer; BOT, borderline ovarian tumor; AUC, area under the curve; CI, confidence interval; PPV, positive predictive value; NPV, negative predictive value.

TOOLS
Similar articles