

 PDF
PDF ePub
ePub Citation
 Print
Print


INTRODUCTION
About 30–50% of patients diagnosed as having glomerulonephritis (GN) are first diagnosed as having an asymptomatic urinary abnormality [1]. Besides GN, there are various potential causes of hematuria, including tubular disease, urolithiasis, neoplasia, urinary tract or kidney infection, and rupture of the capillary vessels of the urinary system due to injury. The hematuria can then be classified as glomerular (the presence of dysmorphic red blood cells [dRBCs]) and non-glomerular (the presence of isomorphic red blood cells [RBCs]) depending on the source of the bleeding [23]. Microscopic examination of urine is routinely used to identify the morphology of RBCs in urine.
RBCs in GN show aberrant distributions, typically peaking at very small cell volumes, whereas RBCs in NGN show normal distributions, peaking in the normocytic to macrocytic range [45]. Accordingly, the presence of dRBCs by microscopic examination is the first-line parameter used to detect GN in hematuria patients. When differentiating hematuria from GN and NGN, conventional microscopy techniques do not have good sensitivity and specificity for detecting dRBCs [6]. Therefore, to best identify dRBCs when distinguishing GN, phase-contrast microscopy (PCM) is the gold standard and is currently widely used. However, PCM is a time-consuming, labor-intensive, and insufficiently precise process that requires expert skills and knowledge, and is also influenced by the differences in sample preparation, such as amount of sample, centrifugation, and technician ability. Consequently, large inter-laboratory differences in the specificity and sensitivity of PCM have been reported [78].
If glomerular hematuria and non-glomerular hematuria can be distinguished initially with an automated prompt analysis of micro-hematuria, urologic and nephrologic assessments can be performed easily and efficiently [910]. To rapidly and accurately treat and manage patients in this context, appropriate diagnostic methods should be used.
Although existing automated urine analyzers can detect RBCs and calculate the volume distribution curve, there is a risk of a spurious increase in the number of small RBCs due to misidentification of fragmented cells, crystals, microorganisms, debris, and urinary contaminants [11]. The UF-1000i automated urine particle analyzer (Sysmex, Kobe, Japan) uses fluorescence flow cytometry with semi-conductor laser technology for urinalysis [12]. Given that small RBCs are of smaller size but with extensive size variation [1314], we hypothesized that the UF-1000i small RBC (UF-%sRBCs) parameter may predict the presence of dRBCs. We evaluated the clinical application of UF-%sRBCs for detecting dRBCs and GN and analyzed the cutoff value of UF-%sRBCs for diagnosing GN.
Go to : 
METHODS
Study population and samples
The present study was approved by the Institutional Review Board of the Catholic Medical Center (UC14SISI0172), and informed consent was obtained from all patients. A total of 103 patients (45 males, 58 females) were enrolled prospectively between August 2015 and July 2016 at Uijeonbu St. Mary's Hospital, Uijeonbu, Korea. First, the patients with urine samples showing five or more RBCs per high-power field (HPF) on light microscopy were selected. We excluded patients with bacteriuria, urinary tract infection, or cystitis. The GN group comprised patients with pathologically confirmed GN by biopsy or overt proteinuria (>3,000 mg/day on 24-hour urine collection). The NGN group comprised patients with microscopic hematuria from other urological abnormalities, such as kidney laceration and urolithiases, etc. Demographic and clinical data, including age, gender, baseline serum creatinine, comorbidities, and prior renal disease, were obtained from medical records.
Table 1 shows the results of %dRBCs, UF-%sRBCs, other UF-RBC counts, and urine chemistry in each group. There were 47 patients with GN, including IgA nephropathy (N=17), focal segmental glomerulosclerosis (N=6), membranous nephropathy (N=6), mesangial proliferative GN (N=6), lupus nephritis (N=6), and overt proteinuria (N=6). The NGN group included a total of 56 patients with kidney laceration (N=12), urolithiases (N=16 [10 renal calculi, four ureteral calculi, and two bladder calculi]), bladder tumor (N=11), and unspecified hematuria (N=17).
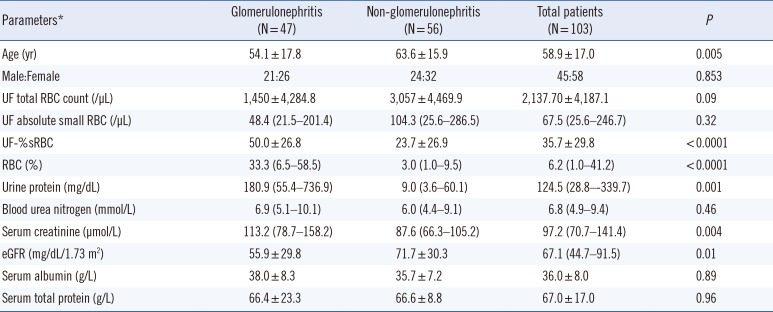
Table 1
Demographic and laboratory parameters in patients with glomerulonephritis and non-glomerulonephritis
![]()
Urine was collected according to the CLSI recommendations [15]. Fresh urine samples with specific gravity of 1.003–1.030 were examined within 60–90 minutes of voiding. A midstream voided urine sample without preservatives was transferred to the laboratory immediately after collection. Urine samples were first analyzed using UF-1000i and then by PCM. All assays were performed as soon as possible and within one hours from the time of urine collection.
Automated urinalysis
UF-1000i uses fluorescence flow cytometry electrical impedance as an analytical principal and has two separate channels to stain urine sediments and bacteria [16]. In the flow cytometry analysis, when the light source hits the particles, the forward scatter channel (FSC) and the side scatter channel (SSC) generate the related values. The urine sample is then automatically mixed with reagents UF II PACK SED and UF II PACK B-A-C (Sysmex). Subsequently, 1,200 µL of the urine is aspirated and then split into two separate aliquots: one for bacteria counting and the other for analysis of other particles, such as RBCs, white blood cells, and casts. In general, bacteria or casts might falsely be recognized as RBCs, and this problem is more likely to occur for small RBCs. However, UF-1000i uses additional reagents (UF II SEARCH SED, UF II SEARCH B-A-C), which are based on the polymethine fluorescent dye. It has high sensitivity in detecting weak fluorescence and more accurately distinguishes bacteria, which are smaller than other particles and have low fluorescence intensities [1517]. Therefore, the analysis of SSC light could minimize the false-positive RBC values derived from the casts. In addition to the usual urine parameters, UF-1000i provides information on research parameters, including the number of both small and large RBCs per microliter [18]. Small RBCs are counted as those with an FSC intensity value below 70. UF-%sRBCs was calculated from the following formula: small RBC counts (/µL)×100/total RBC counts (/µL).
PCM
Urine samples (10 mL) were centrifuged at 400×g for five minutes, and the sediment was resuspended in 0.5 mL of supernatant urine. Aliquots of the suspension (20 µL) were then analyzed and counted in a Fuchs–Rosenthal counting chamber. Ten HPFs (×400) and at least 100 RBCs were screened for all patients. Microscopic examinations were performed by two qualified medical technologists who were unaware of the results of other urine test results. The means of the two results were used as the final data for analysis.
We considered doughnut-shaped RBCs, RBCs with vesicle-shaped protrusions, target configuration, irregular cell contour membranous fragmentation, and fragmented RBCs as dRBCs, according to previous reports [1419]. %dRBCs was calculated with the following formula: dRBC count×100/100 RBC counts. A %dRBCs value <20% is usually used as the criterion to rule out NGN in laboratory tests [2021].
Serum and urine chemistry
Serum was collected using BD Vacutainer SST (Beckton Dickinson, NJ, USA) and then analyzed within one hour. Serum creatinine (µmol/L), serum albumin (g/L), serum protein (g/L), urine protein (g/L), and urea nitrogen (mmol/L) levels were measured using an automated chemical analyzer (Hitachi 7600-110, Hitachi Co., Tokyo, Japan). The estimated glomerular filtration rate (eGFR, mL/min/1.73 m2) was calculated using the Chronic Kidney Disease Epidemiology Collaboration (CKD-EPI) equation [20].
Statistical analysis
Continuous variables were summarized as mean±SD if normally distributed or median with interquartile range if not, and categorical variables were summarized as frequencies. The F-test was used to test for equality of groups. An ANOVA or the Kruskal-Wallis test was used for comparisons among three or more groups. Scatter diagrams were plotted between %dRBCs measured by PCM and UF-%sRBCs. To determine the cut-off level of predicting GN, ROC curve analysis of the area under the curve (AUC) was performed using the GN and NGN groups for comparison. Sensitivity, specificity, positive predictive values (PPV), and negative predictive values (NPV) were calculated. All tests were two-sided. P<0.05 was considered statistically significant. Statistical analyses were performed using MedCalc 17.9.7 (MedCalc Software, Mariakerke, Belgium).
Go to :
RESULTS
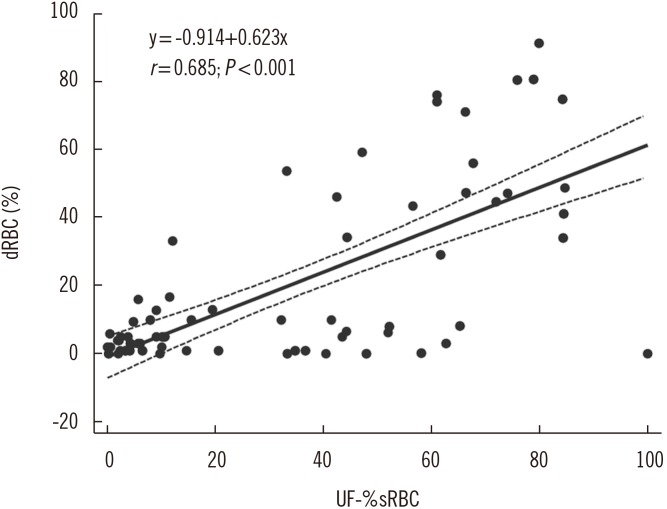
UF-%sRBCs and %dRBCs values were correlated (r=0.685, P<0.0001; Fig. 1). When the patients were divided into positive and negative groups according to the 20% criterion, there were 34 patients with %dRBCs >20% and 33 patients with >20% UF-%sRBCs.
The laboratory parameters for the GN and NGN groups are summarized in Table 1. The fraction of %dRBCs and UF-%sRBCs were higher in the GN group than in the NGN group (both P<0.001). UF-%sRBCs urine protein, urea nitrogen, and serum creatinine levels were significantly higher, whereas eGFR was significantly lower in the GN group than in the NGN group. However, the RBC and small RBC counts from UF-1000i, serum urea nitrogen, serum albumin, and total protein did not differ significantly between the two groups. Since the total RBC count was higher in the NGN group than in the GN group, the absolute small RBC count was slightly higher in the NGN group. However, the absolute dRBC count is not an exact representation of RBC dysmorphia, which is why the dRBC “percentage” is commonly applied in the relevant literature. The absolute RBC and dRBC counts were higher in the NGN group than in the GN group, as reported previously, indicating that a higher %dRBC is a more important marker of glomerular bleeding [21].
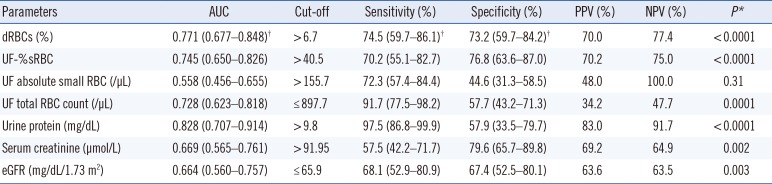
AUC and cut-off values of laboratory parameters for differentiating GN and NGN were analyzed from the ROC curve. The best cut-off of UF-%sRBCs was >40.5%, with an AUC value of 0.745, sensitivity of 70.2%, and specificity of 76.8% (Table 2; Fig. 2). As shown in Table 2, urine protein was the parameter with the highest AUC value, followed by %dRBCs and UF-%sRBCs. The %dRBCs and UF-%sRBCs values showed similar sensitivity, specificity, PPV, and NPV (all P<0.0001). Overall, urine protein showed good sensitivity, PPV, and NPV, but relatively low specificity.
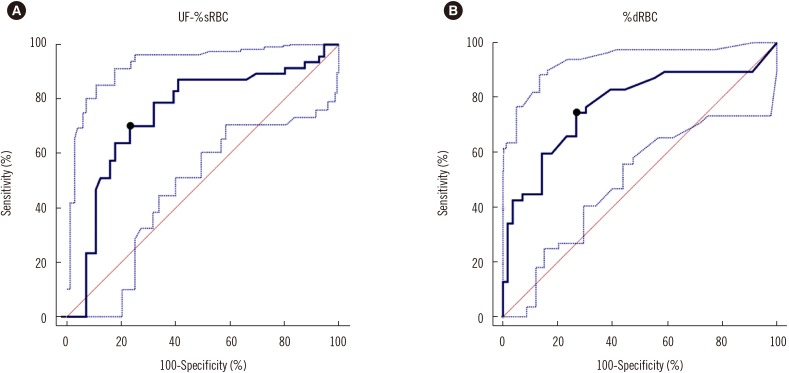 | Fig. 2ROC curves for UF-1000i small red blood cells (RBCs)% (UF-%sRBCs) and dysmorphic RBCs (%dRBCs) to differentiate glomerulonephritis from non-glomerulonephritis patients. The cut-off was determined to be (A) >40.5% with area under the curve (AUC)=0.745 for UF-%sRBCs (B) >6.7% with AUC=0.771 for %dRBCs. Dotted lines are 95% confidence intervals of ROC cuves.
|
Table 2
Performance of laboratory parameters for the differentiation of glomerulonephritis and non-glomerulonephritis
*P values were obtained from ROC curve analysis for the differentiation of glomerulonephritis and non-glomerulonephritis; †95% confidence intervals of AUC, sensitivity and specificity values.
Abbreviations: AUC, area under the curve; PPV, positive predictive value; NPV, negative predictive value; eGFR, estimated glomerular filtration rate; RBC, red blood cells; dRBC, dysmorphic RBCs; UF, UF-1000i.
![]()
Next, to differentiate between patients with GN and NGN, we analyzed sensitivity and specificity based on the determined cut-off levels of %dRBCs and UF-%sRBCs. For UF-%sRBCs, the cut-off value of >14.6% had the best sensitivity, while >44.4% showed optimum sensitivity and specificity. For %dRBCs, the cut-off of >6.7% had optimum sensitivity and specificity, while >75% had the best specificity (Table 3).
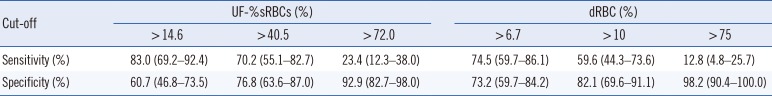
Table 3
Sensitivity and specificity values according to cut-off for UF-%sRBCs (%) and dRBC's (%) for differentiating glomerulonephritis from non-glomerulonephritis
![]()
We next focused on candidate parameters that significantly differ between the GN and NGN groups in the 53 patients with isolated hematuria (without proteinuria). As shown in Table 4, the %dRBCs values were higher in the GN group with isolated hematuria than in the NGN group with isolated hematuria (P=0.0001). UF-%sRBCs was also significantly higher in the GN group. When the patients with isolated hematuria were divided into positive and negative groups by the general criterion of the GN screening (dRBCs >20%) [2021], nine of the 14 GN patients with isolated hematuria (64.3%) and five of the 33 NGN patients with isolated hematuria (15.2%) had positive results for %dRBCs. In addition, 11 of the 14 GN patients with isolated hematuria (78.6%) and 17 of the 33 NGN patients with isolated hematuria (51.5%) had positive results for UF-% sRBCs. Serum creatinine and eGFR levels did not significantly differ between the two groups with isolated hematuria.
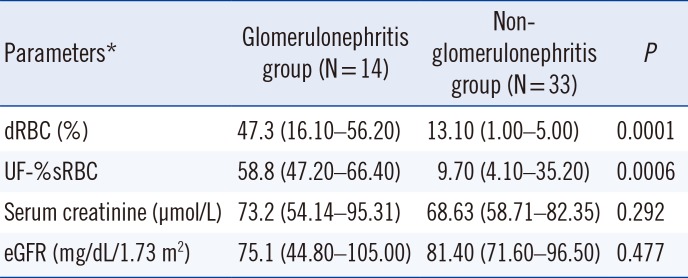
Table 4
Major parameters between glomerulonephritis and non-glomerulonephritis groups in 53 patients with isolated hematuria (i.e., hematuria without proteinuria)
![]()
Go to :
DISCUSSION
We evaluated the accuracy of automated detection of dRBCs and the diagnostic utility of UF-%sRBCs between patients diagnosed as having GN and NGN, compared with the conventional PCM. The absolute RBC and dRBC counts were higher in the NGN group than in the GN group, as reported previously, indicating that a higher %dRBC is a more important marker of glomerular bleeding [21].
Indications for renal biopsy vary among nephrologists but commonly include microhematuria with proteinuria, isolated proteinuria, overt proteinuria, chronic renal insufficiency, renal function deterioration, and evaluation of renal mass [22]. Although confirmation of isolated hematuria without proteinuria is a weak indication for renal biopsy, the identification of an increased dRBC count may guide the suspicion of GN and determine whether or not a renal biopsy should be performed [2223]. A renal biopsy is recommended in cases of isolated hematuria with a dRBC count >80%, RBC cast >1, acanthocytes >5%, three or more gross hematuria episodes, or hematuria associated with hypertension [2425]. %dRBCs has emerged as a useful parameter for screening GN patients and could also be valuable to determine whether a renal biopsy should be performed when managing patients with hematuria without proteinuria. Our results further suggest the best cut-off value of UF-%sRBCs for differentiating between GN and NGN patients.
The first choice of an imaging test for hematuria is a computed tomography (CT) urogram, which can detect the etiology of hematuria in approximately 41% of cases [26]. However, flexible cystoscopy, urine cytology, and CT urogram cannot be performed without a microscopic urinalysis confirming the presence of blood in the urine. Many patients with hematuria are subjected to unnecessary invasive procedures, including biopsy. In the present study, the urine protein level showed the best diagnostic power, followed by %dRBCs and UF-%sRBCs. Therefore, the use of a rapid and automatic parameter could help reduce the number of unnecessary renal biopsy or invasive tests as well as workloads and laboratory costs. Although %dRBCs detection by PCM is an inexpensive hematuria assessment method, it has high inter-laboratory bias and requires skilled technicians and labor.
UF-%sRBCs shows a diagnostic power similar to that of PCM for detecting GN patients. Most of patients (97.1%) with %dRBCs >20% also showed a result of UF-%sRBCs >20%. Therefore, the use of UF-%sRBCs as a parameter has a low false-negative rate in finding %dRBCs, thus having sufficient diagnostic power for a screening test. The parameters that significantly differed between the GN and NGN patients were UF-%sRBCs, %dRBCs, urine protein, serum creatinine, and eGFR. %dRBCs and UF-%sRBCs were moderately correlated (r=0.685, P<0.0001), and UF-%sRBCs accounted for most of dRBCs. The similar diagnostic power of UF-%sRBCs and %dRBCs may be related to the principle of UF-1000i.
Proteinuria quantification was found to be the parameter with the highest AUC to distinguish GN from NGN, followed by %dRBCs and UF-%sRBCs. Both proteinuria and hematuria can appear as initial symptoms in GN patients, and clinicians can easily decide onthe next evaluation steps in such cases. Crop et al. [27] reported that the combination of %dRBCs and proteinuria provided the highest predicted probability for GN in ROC curve analysis. However, for patients with isolated hematuria without proteinuria, performing kidney biopsy is problematic. In the present study, 29.7% (14/47) of the patients with GN presented isolated hematuria without proteinuria, while 58.9% (33/56) of those with NGN had isolated hematuria. Therefore, %dRBCs is a more valuable parameters to identify GN in patients with isolated hematuria as the initial symptom. Indeed, %dRBCs and UF-%sRBCs showed significant differences between patients with isolated hematuria in the GN and NGN groups; therefore, these markers can assist clinicians in deciding on the next evaluation step.
The best cut-offs for UF-%sRBCs in differentiating GN from NGN were determined to be >44.4% with the best sensitivity and specificity, whereas a %dRBCs cut-off value >75% showed low sensitivity and very high specificity; overall, the best cut-off was >6.7% with 70.2% sensitivity and 70.2% specificity. This may be due to the strict counting of dRBCs and the inclusion of patients who were under treatment. In previous studies, %dRBCs >80% was used as the main criterion to indicate GN [131928]. However, similar to our results, in one study adopting strict criteria [13], such as only counting acanthocyturia, %dRBCs >5% was suggested as the threshold, although other authors have regarded >10% dRBCs to be indicative of GN [1928].
In conclusion, conventional automated urinalysis analyzers have difficulty in accurately determining %dRBCs; however, UF-%sRBCs is counted according to a principle combining impedance and flow cytometry. Therefore, the risk of misidentifying bacteria or casts is reduced, specifically when counting small RBCs. UF-%sRBCs is an automation parameter that does not require substantial technical expertise for readings, thereby reducing labor and preventing variation. We demonstrated that UF-%sRBCs has similar diagnostic power to %dRBCs in identifying patients with GN, and may be particularly useful for patients with isolated hematuria. Patients with both hematuria and proteinuria have strong indications for renal biopsy [22]. Thus, in cases of isolated hematuria without proteinuria, clinicians may obtain rapid information regarding the possibility of GN by predicting %dRBCs using UF-1000i.
Go to :
 XML Download