

 PDF
PDF ePub
ePub Citation
 Print
Print


INTRODUCTION
Reliable imaging method is an essential prerequisite for safe and effective noninvasive thermal therapy such as high-intensity focused ultrasound and radio-frequency (RF) hyperthermia. Magnetic resonance imaging (MRI) has advantages for thermal therapy guidance. This mode of imaging can yield morphological images for planning and targeting of thermal therapy. Temperature monitoring allows the detection of thermal foci and temperature changes. Noninvasive temperature monitoring is feasible with MRI based on temperature-sensitive MRI parameters such as T1 (1), T2 (2), proton resonance frequency (PRF) (34), diffusion (5), magnetization transfer contrast (6), chemical exchange saturation transfer (7), and so on. Physical properties such as relaxation kinetics, susceptibility, electrical conductivity, and chemical shift of the contrast mechanism can be different at 7.0T MRI compared with lower field (89). Although these changes may bring the promise of high contrast or signal-to-noise ratio (SNR) for some applications, these changes can also lead to some problematic issues such as increase in susceptibility and chemical shift artifacts in regular images (1011). Despite these issues, MR thermometry at 7.0T is attracting a lot of attention because it provides high sensitivity to temperature measurement.
Currently, MR temperature imaging at 7.0T is performed mostly using PRF-based MR thermometry because PRF has excellent linearity, temperature dependence, and tissue-independence (12). For example, the temperature sensitivity of PRF-based MR thermometry is less than 1℃ (13). For PRF-based MR thermometry, high temperature accuracy can be obtained by high-intensity focused ultrasound guidance with high spatial and temporal resolution in both tissue phantom and in vivo experiments with mouse (14).
Although PRF-based MR thermometry exhibits excellent performance in most MRI application areas, the most critical drawback of PRF-based MR thermometry is that it is incompatible with fatty tissues that do not contain hydrogen bonds. In this case of fatty tissues, T1-based MR thermometry may be a good option for the measurement of the temperature. There are various methods for measuring T1, including look-locker (15), inversion recovery (16), and variable flip angle (VFA) (17). Among others, VFA method is the most preferred method because it provides high spatial resolution with a relatively short acquisition time (18). Since VFA method relies on flip angle dependency, a correction for inaccuracies in RF flip angle (FA) is necessary to obtain unbiased T1 estimates (19). Therefore, further work evaluating the sensitivity of T1-based MR thermometry is of interest.
In this paper, we designed an agarose gel phantom to study the relationship between temperature and T1-based method by fitting a linear relationship between temperatures obtained by PRF-based method and T1 value. MRI experiment was performed on both the phantom and swine muscle tissue to examine the temperature sensitivity in three kinds of images. They are apparent T1 obtained by VFA method without correction of FA variation effect, actual FA from dual repetition time (TR) method (20), and T1 from VFA method with correction of FA variation effect at 7.0T. The same experiment was also conducted at 3.0T for comparison.
MATERIALS AND METHODS
Temperature Sensitive MR Image: PRFs, Apparent T1, T1, and Flip Angle
MR thermometry utilizes temperature-sensitive MR parameters to estimate the temperature. In most cases, a change of temperature in MR thermometry can be expressed using a linear equation:
where ΔT is the temperature change, ΔI is the temperature-induced MR contrast change, and Ω is the temperature dependence of temperature-sensitive MR contrast, respectively. In this study, MR images were acquired during RF heating to estimate the temperature changes using PRF-based MR thermometry, T1, apparent T1, and FA. To estimate the temperature change using PRFbased MR thermometry, Ω takes the form of (α·γ·TE·B0)−1, where α is PRF coefficient (it can be assumed to be −0.01 ppm/℃) (3), γ is the gyromagnetic ratio, TE is the echo time, and B0 is the main magnetic field strength. A spatially varying phase drift was estimated at 3 × 3 pixels at the center of each oil phantom. The estimated phase drift was corrected by extrapolation in the image domain. Apparent T1 was measured by VFA method and FA map was measured by using dual TR method. Apparent T1 had systematic error due to FA change, which can be corrected by using the measured FA (21).
Experimental Setup
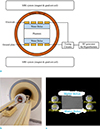
An MR-compatible capacitive-coupled RF hyperthermia system (Fig. 1a) was used with the fields of 7.0T and 3.0T for heating experimental objects. A detailed description of the MR-compatible capacitive-coupled RF hyperthermia system has been provided previously (22). For proper operation of the MR-compatible RF hyperthermia system, the MR imaging apparatus should be stable without being affected by electrodes of MR-compatible RF hyperthermia system. For RF hyperthermia, there is a need to ensure proper transmission of RF power through tuned electrodes of the MR-compatible RF hyperthermia. Electrodes of the MR-compatible RF hyperthermia system consisted of small copper sheets and tuned circuits between them. They were operated at 13.56 MHz without affecting the acquisition of MR images at MR Larmor frequency (128 MHz for 3.0T and 300 MHz for 7.0T). The MR-compatible RF hyperthermia system and RF coil are shown in Figure 1b.
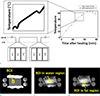
In our experiments, we used a human-tissue-mimicking phantom and a swine muscle tissue. The purpose of using the swine muscle tissue was to evaluate the temperature sensitivity of PRF-based MR thermometry, apparent T1, actual FA, and T1 in the fatty region. The phantom was made of 1.5% agarose gel doped with NaCl (0.2%) and CuSO4 (0.1%) to adjust T1 and T2 relaxation times, electrical conductivity, and relative permittivity. Electrical conductivity and relative permittivity of the phantom were estimated using a dielectric assessment kit (DAK, SPEAG, Switzerland) at 13.56 MHz. Their measured values were 1.1725 S/m and 77.69, respectively. The gel phantom had width, height, and depth of 800 mm, 800 mm, and 450 mm, respectively. MR-compatible RF hyperthermia electrodes were cooled by water bolus filled with distilled water. To compensate unwanted phase drift in PRF-based MR thermometry, oil phantoms were attached nearby the human-tissue-mimicking phantom and the swine muscle tissue (Fig. 1c). MRI experiments were performed at both 7.0T and 3.0T MRI (Philips Achieva, Best, The Netherlands). Temperature and humidity of the magnet's bore were monitored. Room temperature and humidity were kept at approximately 22℃ and 55%, respectively. Temperature of the phantom and swine muscle tissue before heating was approximately 22℃. Except for scan time, both human-tissue-mimicking phantom and swine muscle tissue were heated (100 Watt) for 50 minutes and cooled for 9 minutes (Fig. 2a). MR temperature images at 7.0T and 3.0T were acquired every 10 minutes using a commercial volume TR coil (Nova Medical, Inc. Wilmington, MA, USA) and a commercial 16-channel NV coil, respectively. The image set had two T1-weighted fast field echo (T1-FFE) scans (for temperature mapping using PRF-based MR thermometry and apparent T1 mapping using VFA method) and dual TR scan (for actual FA mapping and FA correction of apparent T1 mapping) (Fig. 2a). For the first T1-FFE, parameters were: TR = 50 ms, echo time (TE) = 2 ms, and FA = 10°. For the second T1-FFE, parameters were: TR = 50 ms, TE = 2 ms, and FA = 35°. The actual FA map was acquired using the dual TR method with the following scan parameters: TR1 = 25 ms, TR2 = 125 ms, TE = 2 ms, and FA = 60°. All scans were performed using voxel size of 1 × 1 × 5 mm3, field-of-view of 192 × 192 mm2, and number of slices of 1. These parameters were the same for both 7.0T and 3.0T experiments. Data processing and analysis were performed using MATLAB (R2014b, MathWorks, Natick, MA, USA).
Quantitative analysis of changes of temperature obtained by PRF-based MR thermometry, apparent T1, actual FA, and T1 was performed within 7 × 7 region-of-interest (ROI). ROIs in water region of phantom, water regions of swine muscle tissue, and fatty regions of swine muscle tissue are shown in Figure 2b, c, and d, respectively. To evaluate temperature dependencies of apparent T1, T1, FA in a quantitative manner, linear regression analysis was performed. Overall correlation coefficients (R2) between temperature change and parameter changes were calculated using the following equation:
where SSres was the regression sum of squares and SStot was the total sum of squares.
To evaluate the precision of MR temperature estimation, internal temperature changes of the phantom were measured using MR-compatible fiber-optic temperature sensors (Photon Control, Inc., Alberta, CA, USA). The position of the MR-compatible fiber-optic temperature sensor was at the center of the ROI marked with a solid line in a square.
RESULTS
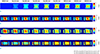
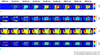
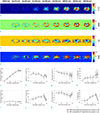
Temperature-sensitive phase changes at 3.0T and 7.0T with TE = 2 ms were 0.0160 rad/℃ and 0.0374 rad/℃, respectively. Measurable temperature ranges at 3.0T and 7.0T with TE = 2 ms were 62.33℃ and 26.71℃, respectively. As shown in Figure 2, PRF-based MR thermometry could estimate temperature change that was consistent with the estimated temperature change from MR-compatible fiber-optic sensor. Root-mean-square error (RMSE) between temperatures measured by the PRF-based MR thermometry at 7.0T and MR-compatible fiber-optic sensor was 2.59℃. MR images exhibited susceptibility artifacts around the MR-compatible fiber-optic sensor, causing errors in T1, phase, and position measurements. This difference in position between the ROI and MR-compatible fiber-optic sensor resulted in errors in temperature measurements. Figure 3 shows experimentally measured sequential changes of temperature obtained by PRF-based MR thermometry, apparent T1, actual FA, and T1 for the human-tissue-mimicking phantom at 7.0T. Figure 4 shows experimentally measured sequential changes of temperature obtained by PRF-based MR thermometry, apparent T1, actual FA, and T1 for the human-tissue-mimicking phantom at 3.0T. MR images did not show any significant artifact due to the MR-compatible RF hyperthermia system (Figs. 3, 4).
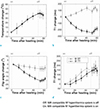
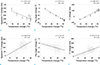
Figure 5 shows temperature dependencies of apparent T1, actual FA, and T1. Heating-related temperature changes of PRF-based MR thermometry at both 3.0T and 7.0T were very similar (RMSE = 1.51℃). SNR of temperature image for 7.0T at 60 min was nearly five times higher than that for 3.0T (SNR at 7.0T = 25.9; SNR at 3.0T = 5.0). With increasing temperature, apparent T1 at 3.0T increased while that at 7.0T decreased due to physical changes as mentioned above. The actual FA decreased with increasing temperature at both 3.0T and 7.0T. After correcting FA variation effect, T1 was found to increase with increasing temperature at both 3.0T and 7.0T. Scatter plots of temperature changes of PRF-based MR thermometry and changes of apparent T1, actual FA, and T1 for tissue-mimicking phantom are shown in Figure 6 along with corresponding linear regression results. For changes of apparent T1, actual FA, and T1 at 7.0T, slopes of linear fits were −3.34 ms/℃, −0.47°/℃, and 4.89 ms/℃, intercepts of fits were −110.4 ms, 3.13°, and −98.72 ms, and correlation coefficients were 0.64, 0.97, and 0.93, respectively. For changes of apparent T1, actual FA, and T1 at 3.0T, slopes of linear fits were 2.36 ms/℃, −0.13°/℃, and 2.91 ms/℃, intercepts of fits were at 23.62 ms, −1.28°, and 37.38 ms, and correlation coefficients were 0.44, 0.24, and 0.35, respectively. Although scatter plots included the effect of T1 and FA nonuniformities in the region of calculation, they showed reasonably good correlation between measurements using PRF and T1. In the scatter plot, correlation coefficients of apparent T1, FA, and T1 at 7.0T were larger than those at 3.0T. Besides, results at 7.0T showed that apparent T1, FA, and T1 were changed relatively large depending on temperature compared to results at 3.0T.
Figure 7 shows temperature changes experimentally obtained by PRF-based MR thermometry, apparent T1, actual FA, and T1 mapping of swine muscle tissue at 7.0T. Mean and the standard deviation for fat and water regions were calculated from 7 × 7 ROIs. In the water region, the temperature measured by the PRF-based MR thermometry increased. However, apparent T1 change that was affected by time varying FA did not reflect temperature change. This was because, as with agarose gel phantom, FA decreased with increasing temperature. However, after correcting FA variation effect, corrected T1 increased with increasing temperature.
DISCUSSION
In this study, we acquired spatial and temporal images of temperature-induced PRF, apparent T1, and T1. Experimental results showed that MR-compatible capacitive-coupled RF hyperthermia could be successfully adapted for RF heating in an MR scanner. They also demonstrated that, by using this MR-compatible RF hyperthermia system, we are capable of heating of a human-tissue-mimicking phantom and swine muscle properly without showing any significant artifacts in MR images. The accuracy of the PRF-based MR thermometry was verified by measuring temperature with the fiber-optic sensor. Here, it is assumed that the apparent T1, actual FA, or T1 changes linearly as temperature changes at both 3.0T and 7.0T. To verify this assumption, linear regression analysis was performed in the present study.
Four types of temperature-sensitive MR imaging results were compared: PRF, apparent T1, T1, and FA. In PRF-based MR thermometry, the SNR of temperature images at 7.0T was five-fold higher than that at 3.0T. In contrast with PRF-based MR thermometry, SNRs of apparent T1, T1, and FA at 3.0T and 7.0T were almost the same. However, we found an interesting phenomenon from experiments results at 7.0T compared to experimental results at 3.0T. This study revealed temperature-induced RF field variations in experiments performed on both a human-tissue-mimicking phantom and swine muscle tissue. The main reason for the temperature-induced RF field variation is the conductivity changes due to temperature change (89). By acquiring actual FA mapping, we first showed temperature dependency of electrical conductivity using MRI. This study demonstrated that 7.0T MRI causes more RF field variation with temperature than 3.0T MRI because the conductivity affects RF field as the B0 strength increases. Consistent with previous reports (1223), apparent T1 was linearly proportional to the temperature change within a small range of temperatures and the slope of this dependence was positive. However, apparent T1 was linearly proportional to temperature change with a positive slope at 3.0T while apparent T1 was linearly proportional to the temperature change with a negative slope at 7.0T. Because actual FA values strongly depended on temperature change, temperature measurements in T1-based MR thermometry had to be corrected for FA variation effect. Using temperature-induced RF field variation, temperature change can be estimated (so-called B1-based MR thermometry) (24). The limitation of B1-based MR thermometry is that, because the actual FA provides inaccurate anatomical information, it is difficult to estimate the temperature dependence of B1 for a specific tissue. In fatty region, although temperature measurement by PRF-based MR thermometry was impossible, T1 change could be used to measure the temperature in cooperation with the proposed RF variation correction method.
The quality of T1-based MR thermometry is directly related to the quality of T1 map. In this paper, we improved the accuracy of T1 estimation by correcting bias due to imperfection of RF field such as nonuniformity and time variation. Accuracy-enhanced T1 estimation improved the accuracy of temperature mapping for T1-based MR thermometry. However, both accuracy and precision of T1 map must be considered for high-accuracy T1 mapping. Thus, it is necessary to improve T1 map for high-accuracy and high-precision T1-based MR thermometry. By improving the SNR of the two FFE images with RF field map, we can improve the precision of T1 map when using VFA method (19).
In conclusion, temperature imaging at ultra-high-field (UHF) (7.0T or above) is promising owing to its high SNR and accuracy. However, UHF MRI is more sensitive to susceptibility and prone to motion artifacts compared to lower field strength. In addition, 7.0T MR images are affected by electrical conductivity more than those from lower field. This preliminary study suggests that B1 effect correction is needed for temperature measurements by T1-based MR thermometry.
 XML Download