Abstract
O-2-18F-fluoroethyl-l-tyrosine ([18F]FET) has been widely used for glioblastomas (GBM) in clinical practice, although evaluation of its applicability in non-clinical research is still lacking. The objective of this study was to examine the value of [18F]FET for treatment evaluation and prognosis prediction of anti-angiogenic drug in an orthotopic mouse model of GBM. Human U87MG cells were implanted into nude mice and then bevacizumab, a representative anti-angiogenic drug, was administered. We monitored the effect of anti-angiogenic agents using multiple imaging modalities, including bioluminescence imaging (BLI), magnetic resonance imaging (MRI), and positron emission tomography-computed tomography (PET/CT). Among these imaging methods analyzed, only [18F]FET uptake showed a statistically significant decrease in the treatment group compared to the control group (P=0.02 and P=0.03 at 5 and 20 mg/kg, respectively). This indicates that [18F]FET PET is a sensitive method to monitor the response of GBM bearing mice to anti-angiogenic drug. Moreover, [18F]FET uptake was confirmed to be a significant parameter for predicting the prognosis of anti-angiogenic drug (P=0.041 and P=0.007, on Days 7 and 12, respectively, on Pearson's correlation; P=0.048 and P=0.030, on Days 7 and 12, respectively, on Cox regression analysis). However, results of BLI or MRI were not significantly associated with survival time. In conclusion, this study suggests that [18F]FET PET imaging is a pertinent imaging modality for sensitive monitoring and accurate prediction of treatment response to anti-angiogenic agents in an orthotopic model of GBM.
Glioblastoma (GBM) is the most common primary brain tumor with high recurrence and mortality rate. The current standard treatment for GBM includes surgical resection followed by radiotherapy and chemotherapy using temozolomide (TMZ), an alkylating agent [1]. Even after this standard therapy, the median survival after diagnosis is 12 to 15 months with most cases showing recurrence [1]. Treatment options for recurrent GBM are limited, but anti-angiogenic approaches could be considered. The strategy to inhibit angiogenesis has been found to be successful in clinical use [2]. It is also known that a combination of anti-angiogenic agents and conventional chemotherapy can reduce the toxicity while obtaining therapeutic efficacy if they are coordinated properly [234]. As several molecular clues related to angiogenesis continue to be identified, targeting angiogenesis is considered promising for tumor treatment [2]. Increased aberrant neovascularization, a hallmark of GBM, is primarily mediated by vascular endothelial growth factor (VEGF), making VEGF a fundamental target for anti-angiogenic therapy [56789]. Bevacizumab (Avastin®) is a recombinant humanized monoclonal IgG antibody that binds to and inhibits VEGF, thereby exhibiting anti-tumor effects [101112131415]. Since its FDA approval as the first anti-angiogenic agent for use in metastatic colorectal cancer, bevacizumab has been approved for patients with recurrent and newly diagnosed GBM as well as several solid tumors. Positive results of bevacizumab treatment have been reported in patients with brain tumors [1617181920212223]. For these reasons, many studies have been conducted on anti-angiogenic agents including VEGF inhibitor in GBM treatment.
Various imaging techniques including bioluminescence imaging (BLI), fluorescence imaging (FLI), computed tomography (CT), and magnetic resonance imaging (MRI) can be used to quantify treatment response against GBM. Nevertheless, especially in the case of monitoring response for anti-angiogenic agents, there is a difficulty such as pseudoresponse related to rapid restoration of blood brain barrier (BBB) [24]. Because of rapid vascular normalization, radiological response may appear to be a therapeutic effect even though it is not a true treatment effect [242526]. Hence, accurate assessment of efficacy is a challenge in the development of anti-angiogenic agents for GBM. Positron emission tomography (PET) imaging has been proposed as an alternative method. O-2-18F-fluoroethyl-l-tyrosine ([18F]FET) and 3-deoxy-3-18F-fluorothymidine ([18F]FLT) are widely used radiotracers in PET imaging for brain tumor [27]. These tracers can overcome known limitations of 18F-Fluorodeoxyglucose ([18F]FDG) such as increased uptake in inflammatory environment and elevated background signal in normal brain tissue, especially in the cerebral cortex [2427282930]. Since proliferative activity and amino acid transport increase in neoplastic cells, but not in normal brain cells, amino acid radiotracers have a significant advantage of being able to sensitively evaluate brain tumor [243132]. The specificity of [18F]FET PET is higher than that of [18F]FLT PET as the uptake of [18F]FLT is more influenced by the presence of BBB related to its limitation to move across the BBB [27]. Due to its advantage, [18F]FET has already been proven to be useful in patients with brain tumor for diagnosis, grading, treatment planning, and prognosis monitoring. Although [18F]FET has potential to play a more important role in GBM, few studies have evaluated the feasibility of using them in non-clinical situations [33].
In this study, we compared [18F]FET PET imaging with BLI and MRI for monitoring and predicting the anti-tumor effect of bevacizumab in an orthotopic GBM model. The aim of this investigation was to demonstrate the value of [18F]FET PET imaging in non-clinical assessment of angiogenesis-inhibiting drugs.
Human derived glioblastoma U87MG-Red-FLuc cell line was purchased from Perkin Elmer (Waltham, MA, USA). These cells were transduced with firefly luciferase gene from Luciola Italica (Red-FLuc). Cells were maintained under standard condition and confirmed to be mycoplasma free by the ATCC universal mycoplasma detection kit. Luciferase expressing cells were seeded into a 96-well microplate at density ranging from 0 to 50,000 cells in 100 µL PBS. After 150 µg/0.1 mL of D-Luciferin was added to each well, bioluminescence signal was then obtained directly using an EnSpire multimode plate reader (PerkinElmer, Waltham, MA, USA). Each experiment performed in triplicates. Luminescence activity was considered to reflect relative viable cell numbers as the intensity of emitted light was directly proportional to the number of viable cells. Cells were cultured in MEM alpha media supplemented with 10% heat-inactivated FBS and 1% Penicillin/Streptomycin and maintained at 37℃ with 5% CO2 in a humidified incubator. Cell viability was over 90% based on trypan blue exclusion assay.
This experiment was performed after obtaining approval from the Institutional Animal Care and Use Committee (IACUC) of the Korea Institute of Radiological & Medical Sciences (KIRAMS) (Approval No. KIRAMS 2017-0038). Overall animal care and experimental procedures were conducted in compliance with the NIH Guide for the Care and Use of Laboratory Animals.
Six weeks old male Balb/c nude mice with body weight of 19 to 24 g were used to establish an orthotopic model. Mice were anesthetized using 200 µL of a mixture of Zoletil (30 mg/kg) and Rumpun (10 mg/kg) via intraperitoneal injection. While under deep anesthesia, mice were placed in a stereotactic apparatus and midline incision was made to expose the skull. Connective tissues on skull surface were wiped several times to find the bregma to be used as a reference point. A burr hole was made at 0.5 mm anterior and 2 mm right to the bregma. Then 105 cells in 5 µL PBS were slowly injected at a depth of 2.5 mm with a Hamilton syringe. The targeted injection site was the right caudate putamen. Incision line was sutured and disinfected. Thereafter, mice were monitored for anesthetic recovery. At 17 days after cell inoculation, mice were randomized into three groups (n=4 per group) based on total flux of BLI. Then 5 or 20 mg/kg of bevacizumab (Avastin, Roche) or vehicle (1xDPBS, Gibco) was administered intraperitoneally for a total of 17 times from the day of randomization. Dose volume was 10 mL/kg.
BLI, MRI, and PET/CT were used to monitor treatment response. For all images, mice were anesthetized in the induction chamber containing 2.0–2.5% isoflurane. Small animal masks were then used to maintain anesthesia with 1.5–2.0% isoflurane within the imaging system. The mice were monitored daily for clinical sign and survival assessment. Body weight was measured twice a week and before each scan. The detailed schedule including administration and imaging is illustrated in Figure 1.
Mice were intraperitoneally injected with 100 µL D-luciferin (30 mg/mL). To allow substrate absorption and luciferase/luciferin reaction, mice were anesthetized for 10 minutes with isoflurane. They were then transferred into an IVIS Imaging System 200 (Caliper Life Science, Waltham, MA, USA) in prone position and continuously anesthetized to obtain BLI images. Images were acquired with exposure time of one second which was adjusted to optimize the signal without saturating the image. Living Image 2.50 software (Xenogen Corp., Alameda, CA, USA) was used to analyze bioluminescence data. A region of interest (ROI) covering the bioluminescence signal on the mouse skull was manually drawn and total photon flux (photons/sec/cm2/sr) in the ROI was measured.
All MRIs were obtained using an Agilent 9.4T scanner (Agilent Technologies, Santa Clara, CA, USA) with 31 cm horizontal-bore. Anesthetized mice were placed in prone position on an animal bed surrounded by 2-channel array mouse head surface coil (Rapid Biomedical GmbH, Rimpar, Germany). In order to check the condition of mouse, respiratory rate was monitored using a MR-compatible system with physiological monitoring and gating (SA Instruments, NY, USA). Brain images in transverse and coronal planes were acquired with Fast Spin Echo Multi-Slice (FSEMS) T2 weighted sequences as follows: repetition time (TR)=3500 ms; echo time (TE)=30 ms; echo train length (ETL)=64; field of view (FOV)=20×20 mm; slice thickness=0.8 mm; matrix size =192×192; number of excitation (NEX)=3; number of slice=10; voxel size=0.104×0.104×0.8 µm; and scan time =5 m 43 s.
To determine tumor size on T2 weighted image, tumor width and length on transverse plane and tumor high on coronal plane were measured using Image J software (version 1.51, National Institutes of Health, MD, USA). Based on the tumor diameter, tumor volume was calculated with the following formulation:
PET/CT imaging was performed with a small animal PET/CT scanner (NanoScan, Mediso Medical Imaging Systems, Budapest, Hungary). Mice were anaesthetized with isoflurane and injected with [18F]FET (200 µCi) in 200 µL of saline via the tail vein. For attenuation correction and anatomical reference, micro-CT imaging was obtained during 2.5 minutes before PET imaging using 50 kVp of X-ray voltage and 0.16 mAs of anode current. Subsequently, PET images were acquired with an energy window of 400–600 keV during 20 minutes at 1 hour after tracer injection. All obtained images were reconstructed using four iterations of 3-dimensional ordered subset expectation maximization (3D-OSEM) algorithm with six subsets.
To quantify [18F]FET uptake, standardized uptake value (SUV) which adjusted voxel value within a volume of interest (VOI) was calculated using PMOD software (version 3.8, PMOD Group, Graubünden, Switzerland). The SUV (g/mL) of each voxel was calculated as follows. Activity of each voxel (kBq/mL) was multiplied by mouse body weight (g) and divided by decay-corrected-activity (kBq). Three-dimensional VOI showing high activity was manually drawn on the brain region using CT images as a guide. Maximum SUV value was obtained based on VOI.
Statistical analyses were performed using SPSS Statistics version 23 (IBM Corp., Armonk, NY, USA). Continuous parameters were expressed as mean±standard deviation (SD). All analyses were conducted as two-sided tests. To perform group comparisons, homogeneity of variance was evaluated by Levene's test. For data with confirmed equal distribution and results of ANOVA multiple comparison test were statistically significant (P<0.05), Dunnett's test was performed as post hoc test to determine which pair of group comparison was significantly different. When significant deviations from variance homogeneity were observed, Kruskal-Wallis T Test was conducted as a non-parametric comparison test. As results of Kruskal-Wallis T test, there were no statistically significant differences (P>0.05).
Survival curves were generated by the Kaplan-Meier method and Log rank (Mantel-Cox) test was performed for group comparison. Pearson's correlation analysis and univariate and multivariate Cox regression analyses were performed to identify predictors of survival and assess the effect of significant parameters. Cox multivariate analyses were conducted with a stepwise procedure using parameters obtained on Day 7 and Day 12, respectively.
In all imaging modalities taken, changes in orthotopic xenograft following bevacizumab administration were confirmed both visually and quantitatively. According to BLI, luminescence signals (total flux, p/s) were reduced slightly in bevacizumab administration groups compared to those in the control (Figure 2B; 45 and 44% compared to the control at 5 mg/kg on Days 7 and 12, respectively; 38 and 61% compared to the control at 20 mg/kg on Days 7 and 12, respectively). However, these changes were not accompanied by statistical significance or dose-dependency.
In order to quantify tumor growth, tumor volume and tumor growth rate (ratio compared to Day 0) were evaluated based on T2 weighted MRI. After bevacizumab administration, decreasing tendency of brain tumor was verified in tumor volume (Figure 3B, 41 and 35% compared to the control at 5 mg/kg on Days 7 and 12, respectively; 31 and 27% compared to the control at 20 mg/kg on Days 7 and 12, respectively) and tumor growth rate (Figure 3C, 64 and 46% compared to the control at 5 mg/kg on Days 7 and 12, respectively; 65 and 46% compared to the control at 20 mg/kg on Days 7 and 12, respectively). These changes showed no statistical significance.
Bevacizumab administration decreased [18F]FET uptake at brain tumor in PET/CT images (Figure 4B, 71 and 44% compared to the control at 5 mg/kg on Days 7 and 12, respectively; 54 and 50% compared to the control at 2 mg/kg on Days 7 and 12, respectively). Among imaging techniques used, only PET imaging on Day 12 showed statistically significant differences (Figure 4B; P=0.02 and P=0.03 at 5 and 20 mg/kg, respectively). These changes were observed in both 5 and 20 mg/kg bevacizumab groups, but not in a dose-dependent manner.
Bevacizumab treatment significantly extended overall survival compared to the control (Figure 5; P=0.007 in both 5 and 20 mg/kg groups). However, dose related changes were not observed. Since overall survival was regarded as a gold standard of treatment prognosis, statistical analysis of survival time was performed for each parameter derived from imaging modalities. We assessed Pearson's linear correlation coefficient (r) to determine the strength of associations between results of each imaging modality and survival time following bevacizumab treatment. Survival time and [18F]FET uptake showed a statistically significant linear correlation (a moderate negative linear correlation on Day 7 and a strong negative linear correlation on Day 12, Table 1 and Figure 6; P=0.041, r=−0.687 on Day 7; P=0.007, r=−0.757 on Day 12). Other parameters derived from BLI and T2 weighted MRI showed no significant correlations with survival time.
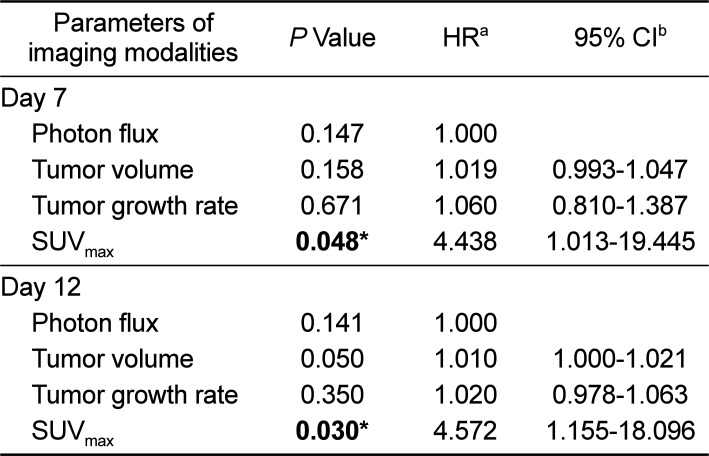
Cox proportional hazards model was used to compare the survival predictive power of [18F]FET PET with that of other imaging modalities. SUVmax was confirmed as a significant predictor of survival (Table 2; P=0.048 and P=0.030 on Days 7 and 12, respectively) in both univariate and multivariate Cox regression analyses. In contrast, photon flux, tumor volume, or tumor growth rate was not a significant predictor for survival time on Day 7 (P=0.147, P=0.158, and P=0.671, respectively) or Day 12 (P=0.141, P=0.050, and P=0.350, respectively).
The goal of this experiment was to demonstrate the value of molecular imaging technique in assessing and predicting the effect of anti-angiogenic agents on GBM orthotopic model. Among imaging methods analyzed in this study, only [18F]FET uptake showed statistical significance after bevacizumab administration compared to the control group. This indicates that [18F]FET PET is a more sensitive method to detect response to anti-angiogenic agents in GBM orthotopic mice model. Our results also demonstrate that [18F]FET uptake is a significant parameter for predicting the prognosis after treatment with anti-angiogenic agents, whereas results of BLI or MRI are not significantly associated with survival time.
BLI was used to confirm and monitor tumor growth over time because it is established as a reliable method for the assessment of brain tumor in non-clinical research due to its convenience in use and sensitiveness [3435]. In relation to these advantages, it was possible to monitor the growth of viable tumor cells from the inoculation with U87MG cells. However, statistically significant change compared to the control or correlation with survival time was not observed after bevacizumab administration. This could be contributed to factors known to impair the reliability of viable tumor cell measurements, including differences in tumor depth, hypoxia, pH, and changes in expression of luciferase [36373839].
In the current study, contrast enhancement was not used in MRI. Only T2 weighted images were taken based on recommendation of the Response Assessment in Neuro-Oncology (RANO) group for assessment of tumor response or progression to overcome pseudoresponse associated with anti-angiogenic drugs [2540]. Besides, it has been revealed that contrast enhancement is not accurately correlated with tumor progression in a non-clinical study using anti-angiogenic agent [41]. In results of MRI, tumor growth was well confirmed anatomically, but treatment response to bevacizumab was not statistically significant. MRI showed no statistical significance in predicting therapeutic effect of the tumor either. Besides infiltrating tumor, edema and necrotic lesion can also be causes of hyperintensity signal in MRI [28]. While MRI provides anatomical structures, PET provides information about metabolic activity of tissue. Thus, it is considered that evaluating and predicting tumor prognosis using PET is more accurate than using MRI, especially in the case of anti-angiogenic agents that induce therapeutic effects by modifying the tumor microenvironment.
Several reports have confirmed that [18F]FET PET is a reliable tool to detect and predict treatment response of bevacizumab in patients with brain tumor than conventional imaging methods [4042]. In a recent non-clinical study, [18F]FET has also been shown to be a better tool than MRI and BLI for detecting anti-VEGF efficacy in GBM mice models [36]. Results of the present study are in line with these clinical and non-clinical researches. In addition, our results revealed remarkable correlation between [18F]FET uptake and survival time, the gold standard of therapeutic effect, based on multiple statistical methods in the non-clinical condition.
In conclusion, our results demonstrate that [18F]FET PET is the most sensitive and predictable tool among imaging modalities used in this study for estimating treatment effects of bevacizumab in GBM orthotopic model. Therefore, [18F]FET PET is a pertinent imaging modality and recommended for non-clinical evaluation of anti-angiogenic drugs in GBM treatment.
Acknowledgments
This research was supported by the National Research Foundation of Korea (NRF) grant funded by the Ministry of Science and ICT, Republic of Korea (NRF-2013M2C2A1074238).
References
1. Gallego O. Nonsurgical treatment of recurrent glioblastoma. Curr Oncol. 2015; 22(4):e273–e281. PMID: 26300678.

2. Cao Y. Future options of anti-angiogenic cancer therapy. Chin J Cancer. 2016; 35(2):21. PMID: 26879126.

3. Kuusk T, Albiges L, Escudier B, Grivas N, Haanen J, Powles T, Bex A. Antiangiogenic therapy combined with immune checkpoint blockade in renal cancer. Angiogenesis. 2017; 20(2):205–215. PMID: 28401381.

4. Eisermann K, Fraizer G. The Androgen Receptor and VEGF: Mechanisms of Androgen-Regulated Angiogenesis in Prostate Cancer. Cancers (Basel). 2017; 9(4):32.

5. Hardee ME, Zagzag D. Mechanisms of glioma-associated neovascularization. Am J Pathol. 2012; 181(4):1126–1141. PMID: 22858156.

6. Galldiks N, Langen KJ, Holy R, Pinkawa M, Stoffels G, Nolte KW, Kaiser HJ, Filss CP, Fink GR, Coenen HH, Eble MJ, Piroth MD. Assessment of treatment response in patients with glioblastoma using O-(2-18F-fluoroethyl)-L-tyrosine PET in comparison to MRI. J Nucl Med. 2012; 53(7):1048–1057. PMID: 22645298.

7. Krcek R, Latzer P, Adamietz IA, Bühler H, Theiss C. Influence of vascular endothelial growth factor and radiation on gap junctional intercellular communication in glioblastoma multiforme cell lines. Neural Regen Res. 2017; 12(11):1816–1822. PMID: 29239327.

8. Fu P, He YS, Huang Q, Ding T, Cen YC, Zhao HY, Wei X. Bevacizumab treatment for newly diagnosed glioblastoma: Systematic review and meta-analysis of clinical trials. Mol Clin Oncol. 2016; 4(5):833–838. PMID: 27123291.

9. Jain RK. Normalization of tumor vasculature: an emerging concept in antiangiogenic therapy. Science. 2005; 307(5706):58–62. PMID: 15637262.

10. Tobelem G. VEGF: a key therapeutic target for the treatment of cancer-insights into its role and pharmacological inhibition. Target Oncol. 2007; 2(3):153–164.
11. Yanagisawa M, Yorozu K, Kurasawa M, Nakano K, Furugaki K, Yamashita Y, Mori K, Fujimoto-Ouchi K. Bevacizumab improves the delivery and efficacy of paclitaxel. Anticancer Drugs. 2010; 21(7):687–694. PMID: 20559127.

12. Borgström P, Bourdon MA, Hillan KJ, Sriramarao P, Ferrara N. Neutralizing anti-vascular endothelial growth factor antibody completely inhibits angiogenesis and growth of human prostate carcinoma micro tumors in vivo. Prostate. 1998; 35(1):1–10. PMID: 9537593.

13. Bagri A, Berry L, Gunter B, Singh M, Kasman I, Damico LA, Xiang H, Schmidt M, Fuh G, Hollister B, Rosen O, Plowman GD. Effects of anti-VEGF treatment duration on tumor growth, tumor regrowth, and treatment efficacy. Clin Cancer Res. 2010; 16(15):3887–3900. PMID: 20554752.

14. Warren RS, Yuan H, Matli MR, Gillett NA, Ferrara N. Regulation by vascular endothelial growth factor of human colon cancer tumorigenesis in a mouse model of experimental liver metastasis. J Clin Invest. 1995; 95(4):1789–1797. PMID: 7535799.

15. Mabuchi S, Terai Y, Morishige K, Tanabe-Kimura A, Sasaki H, Kanemura M, Tsunetoh S, Tanaka Y, Sakata M, Burger RA, Kimura T, Ohmichi M. Maintenance treatment with bevacizumab prolongs survival in an in vivo ovarian cancer model. Clin Cancer Res. 2008; 14(23):7781–7789. PMID: 19047105.

16. Zhang J, Wang S, Liu H, Du X, Chen X, Guo Y, Zhang J, Fang J, Zhang W. Quantitative MRI assessment of glioma response to bevacizumab in a mouse model. Int J Clin Exp Med. 2017; 10(10):14232–14243.
17. Friedman HS, Prados MD, Wen PY, Mikkelsen T, Schiff D, Abrey LE, Yung WK, Paleologos N, Nicholas MK, Jensen R, Vredenburgh J, Huang J, Zheng M, Cloughesy T. Bevacizumab alone and in combination with irinotecan in recurrent glioblastoma. J Clin Oncol. 2009; 27(28):4733–4740. PMID: 19720927.

18. Vredenburgh JJ, Desjardins A, Herndon JE 2nd, Dowell JM, Reardon DA, Quinn JA, Rich JN, Sathornsumetee S, Gururangan S, Wagner M, Bigner DD, Friedman AH, Friedman HS. Phase II trial of bevacizumab and irinotecan in recurrent malignant glioma. Clin Cancer Res. 2007; 13(4):1253–1259. PMID: 17317837.

19. Jakobsen JN, Hasselbalch B, Stockhausen MT, Lassen U, Poulsen HS. Irinotecan and bevacizumab in recurrent glioblastoma multiforme. Expert Opin Pharmacother. 2011; 12(5):825–833. PMID: 21385110.

20. Odia Y, Iwamoto FM, Moustakas A, Fraum TJ, Salgado CA, Li A, Kreisl TN, Sul J, Butman JA, Fine HA. A phase II trial of enzastaurin (LY317615) in combination with bevacizumab in adults with recurrent malignant gliomas. J Neurooncol. 2016; 127(1):127–135. PMID: 26643807.

21. Heiland DH, Masalha W, Franco P, Machein MR, Weyerbrock A. Progression-free and overall survival in patients with recurrent Glioblastoma multiforme treated with last-line bevacizumab versus bevacizumab/lomustine. J Neurooncol. 2016; 126(3):567–575. PMID: 26614518.

22. Al-Abd AM, Alamoudi AJ, Abdel-Naim AB, Neamatallah TA, Ashour OM. Anti-angiogenic agents for the treatment of solid tumors: Potential pathways, therapy and current strategies - A review. J Adv Res. 2017; 8(6):591–605. PMID: 28808589.

23. Ozel O, Kurt M, Ozdemir O, Bayram J, Akdeniz H, Koca D. Complete response to bevacizumab plus irinotecan in patients with rapidly progressive GBM: Cases report and literature review. J Oncol Sci. 2016; 2(2-3):87–94.

24. Huang RY, Neagu MR, Reardon DA, Wen PY. Pitfalls in the neuroimaging of glioblastoma in the era of antiangiogenic and immuno/targeted therapy - detecting illusive disease, defining response. Front Neurol. 2015; 6:33. PMID: 25755649.

25. Wen PY, Macdonald DR, Reardon DA, Cloughesy TF, Sorensen AG, Galanis E, Degroot J, Wick W, Gilbert MR, Lassman AB, Tsien C, Mikkelsen T, Wong ET, Chamberlain MC, Stupp R, Lamborn KR, Vogelbaum MA, van den Bent MJ, Chang SM. Updated response assessment criteria for high-grade gliomas: response assessment in neuro-oncology working group. J Clin Oncol. 2010; 28(11):1963–1972. PMID: 20231676.

26. Norden AD, Drappatz J, Muzikansky A, David K, Gerard M, McNamara MB, Phan P, Ross A, Kesari S, Wen PY. An exploratory survival analysis of anti-angiogenic therapy for recurrent malignant glioma. J Neurooncol. 2009; 92(2):149–155. PMID: 19043778.

27. Nedergaard MK, Michaelsen SR, Perryman L, Erler J, Poulsen HS, Stockhausen MT, Lassen U, Kjaer A. FFET and (18)F-FLT small animal PET for the assessment of anti-VEGF treatment response in an orthotopic model of glioblastoma. Nucl Med Biol. 2016; 43(3):198–205. PMID: 26924500.
28. Hutterer M, Nowosielski M, Putzer D, Waitz D, Tinkhauser G, Kostron H, Muigg A, Virgolini IJ, Staffen W, Trinka E, Gotwald T, Jacobs AH, Stockhammer G. O-(2-18F-fluoroethyl)-L-tyrosine PET predicts failure of antiangiogenic treatment in patients with recurrent high-grade glioma. J Nucl Med. 2011; 52(6):856–864. PMID: 21622893.

29. Schwarzenberg J, Czernin J, Cloughesy TF, Ellingson BM, Pope WB, Geist C, Dahlbom M, Silverman DH, Satyamurthy N, Phelps ME, Chen W. 3′-deoxy-3′-18F-fluorothymidine PET and MRI for early survival predictions in patients with recurrent malignant glioma treated with bevacizumab. J Nucl Med. 2012; 53(1):29–36. PMID: 22159180.

30. Gulyás B, Halldin C. New PET radiopharmaceuticals beyond FDG for brain tumor imaging. Q J Nucl Med Mol Imaging. 2012; 56(2):173–190. PMID: 22617239.
31. Isselbacher KJ. Sugar and amino acid transport by cells in culture--differences between normal and malignant cells. N Engl J Med. 1972; 286(17):929–933. PMID: 4335317.
32. BUSCH H, DAVIS JR, HONIG GR, ANDERSON DC, NAIR PV, NYHAN WL. The uptake of a variety of amino acids into nuclear proteins of tumors and other tissues. Cancer Res. 1959; 19(10):1030–1039. PMID: 13806375.
33. Holzgreve A, Brendel M, Gu S, Carlsen J, Mille E, Böning G, Mastrella G, Unterrainer M, Gildehaus FJ, Rominger A, Bartenstein P, Kälin RE, Glass R, Albert NL. Monitoring of Tumor Growth with [(18)F]-FET PET in a Mouse Model of Glioblastoma: SUV Measurements and Volumetric Approaches. Front Neurosci. 2016; 10:260. PMID: 27378835.

34. Ramasawmy R, Johnson SP, Roberts TA, Stuckey DJ, David AL, Pedley RB, Lythgoe MF, Siow B, Walker-Samuel S. Monitoring the Growth of an Orthotopic Tumour Xenograft Model: Multi-Modal Imaging Assessment with Benchtop MRI (1T), High-Field MRI (9.4T), Ultrasound and Bioluminescence. PLoS One. 2016; 11(5):e0156162. PMID: 27223614.

35. Jarzabek MA, Sweeney KJ, Evans RL, Jacobs AH, Stupp R, O'Brien D, Berger MS, Prehn JH, Byrne AT. Molecular imaging in the development of a novel treatment paradigm for glioblastoma (GBM): an integrated multidisciplinary commentary. Drug Discov Today. 2013; 18(21-22):1052–1066. PMID: 23792334.

36. Nedergaard MK, Michaelsen SR, Urup T, Broholm H, El Ali H, Poulsen HS, Stockhausen MT, Kjaer A, Lassen U. 18F-FET microPET and microMRI for anti-VEGF and anti-PlGF response assessment in an orthotopic murine model of human glioblastoma. PLoS One. 2015; 10(2):e0115315. PMID: 25680186.

37. Christoph S, Schlegel J, Alvarez-Calderon F, Kim YM, Brandao LN, DeRyckere D, Graham DK. Bioluminescence imaging of leukemia cell lines in vitro and in mouse xenografts: effects of monoclonal and polyclonal cell populations on intensity and kinetics of photon emission. J Hematol Oncol. 2013; 6(1):10. PMID: 23343252.

38. Khalil AA, Jameson MJ, Broaddus WC, Lin PS, Dever SM, Golding SE, Rosenberg E, Valerie K, Chung TD. The Influence of Hypoxia and pH on Bioluminescence Imaging of Luciferase-Transfected Tumor Cells and Xenografts. Int J Mol Imaging. 2013; 2013:287697. PMID: 23936647.

39. O'Farrell AC, Shnyder SD, Marston G, Coletta PL, Gill JH. Non-invasive molecular imaging for preclinical cancer therapeutic development. Br J Pharmacol. 2013; 169(4):719–735. PMID: 23488622.
40. Galldiks N, Law I, Pope WB, Arbizu J, Langen KJ. The use of amino acid PET and conventional MRI for monitoring of brain tumor therapy. Neuroimage Clin. 2016; 13:386–394. PMID: 28116231.

41. Jalali S, Chung C, Foltz W, Burrell K, Singh S, Hill R, Zadeh G. MRI biomarkers identify the differential response of glioblastoma multiforme to anti-angiogenic therapy. Neuro Oncol. 2014; 16(6):868–879. PMID: 24759636.

42. Götz I, Grosu A-L, Spehl TS. Role of PET Imaging in Patients with High-Grade Gliomas Undergoing Anti-Angiogenic Therapy with Bevacizumab-Review of the Literature and Case Report. Eur Assoc NeuroOncology Mag. 2014; 4(3):102–108.
Figure 1
Timeline of the experimental design. The initiation date of treatment was considered as Day 0. Grey boxes indicate bevacizumab administration (one time per day). Arrows indicate imaging modalities taken.

Figure 2
Monitoring response to anti-angiogenic drug in GBM bearing mice by BLI. Representative BLI images showing bevacizumab response on Days 0, 7, and 12 after initiation of treatment (A). Mice received 0, 5 or 20 mg/kg bevacizumab from 17 days after U87MG cell inoculation. Scale bar represents 107–108 photons/sec/cm2/sr. Bioluminescence signal in tumor of each group over time is shown (B). Values represent mean±SD of each group.
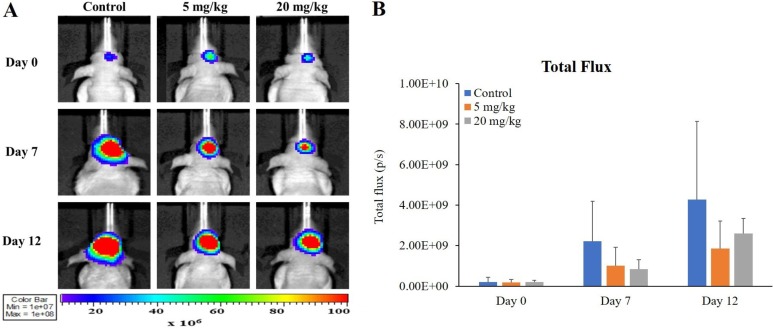
Figure 3
Monitoring the response to anti-angiogenic drug in GBM bearing mice by MRI. Representative transverse plane of T2 weighted MRI images showing bevacizumab response on Days 0, 7, and 12 after initiation of treatment (A). Tumor volume (B) and tumor growth rate (C) of each group over time are shown. Values represent mean±SD of each group.
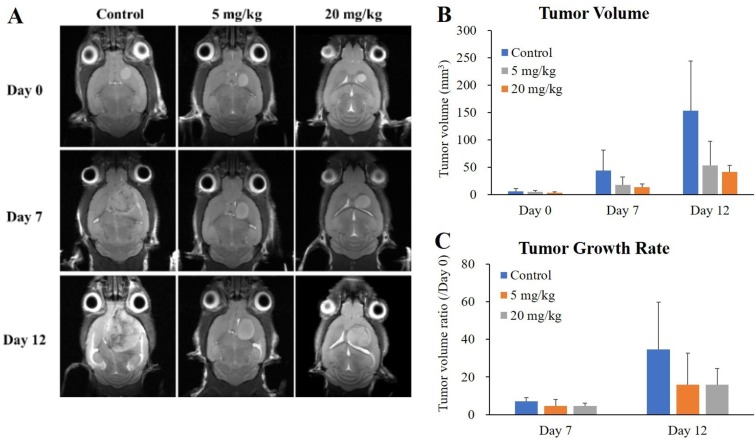
Figure 4
Monitoring the response to anti-angiogenic drug in GBM bearing mice by [18F]FET PET imaging. Representative transverse plane of PET image showing bevacizumab response on Days 7 and 12 after initiation of treatment (A). Scale bar represents 0.5–2.0 g/mL of [18F]FET. Quantitative [18F]FET uptake in tumor of each group over time is shown (B). Values represent mean±SD of each group. *P<0.05 vs. control group determined by the Dunnett's test after ANOVA multiple comparison.
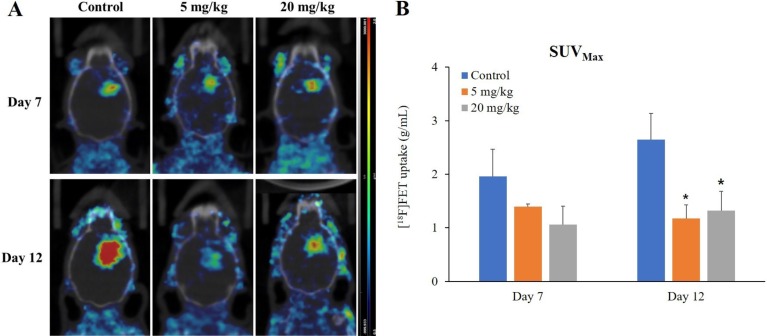
Figure 5
Kaplan-Meier survival curves for control or bevacizumab treatment groups of GBM orthotopic model. *P<0.05 vs. control group determined by log-rank test.
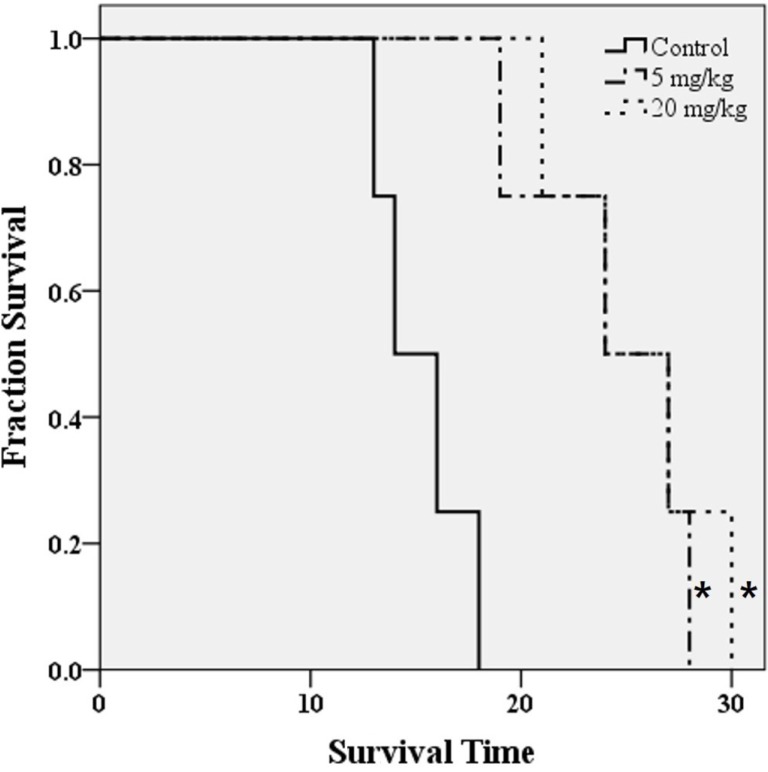
Figure 6
Dispersion charts demonstrating correlation between survival time and maximum SUV of [18F]FET on Days 7 (A) and 12 (B) in the orthotopic GBM model (n=8 and 11, respectively).
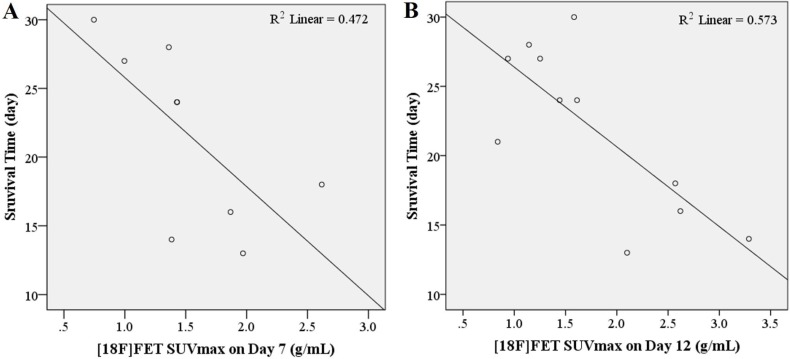
Table 1
Correlations between survival time and parameters of imaging modalities
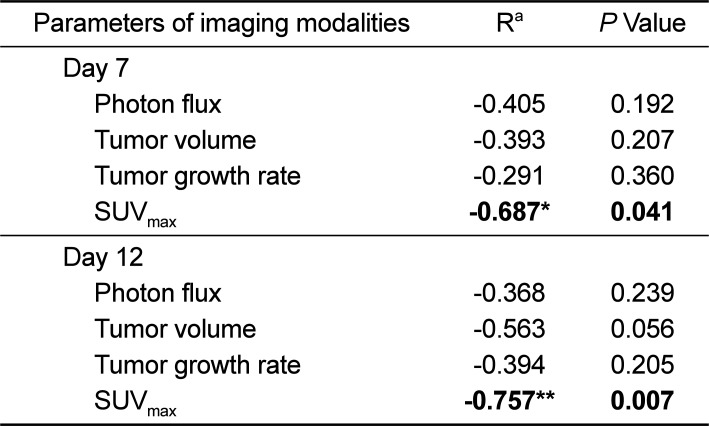
Table 2
Cox proportional hazards model to identify predictors of survival time


 PDF
PDF ePub
ePub Citation
 Print
Print


 XML Download