

 PDF
PDF ePub
ePub Citation
 Print
Print


Ischemic stroke is one of most dangerous neurological diseases and is associated with high mortality and morbidity [1]. The oxidative stress in ischemic stroke play a critical role in the progression of brain tissue injury [23]. Reactive oxygen species (ROS) can bind to membrane phospholipids and lead to formation of lipid peroxidation products [45]. When lipid peroxidation occurs in neurons, they cause changes in cell permeability, fluidity, ion transportation, and metabolism, leading to neuronal cell damage [6]. In addition, mitochondrial damage caused by lipid peroxidation induces more ROS production, further intensifying oxidative stress [7]. Also, controlling lipid peroxidation in brain ischemia can alleviate nerve damage [89]. The synuclein family consists of three proteins: α-, β-, and γ-synuclein. Among these proteins, α-synuclein exists abundantly in neuronal tissue, is especially expressed in presynaptic terminals, and contributes to formation of synaptic vesicles [10]. α-Synuclein inhibits lipid oxidation by binding to lipid membranes, and four of its methionine residues are vulnerable to oxidation to sulfoxide by hydrogen peroxide [11]. Thus, α-synuclein plays an essential role in the regulation of membrane stability. Expression change of α-synuclein occurs in neuronal diseases such as Parkinson's disease, Alzheimer's disease, and traumatic brain injury [121314]. α-Synuclein induces pathological changes such as neuronal dystrophy and axonal swelling by forming Lewy bodies and Lewy neurites in nerve cells, which eventually lead to the neuronal cell death [15]. Importantly, α-Synuclein mediates lipid peroxidation in neuronal cells, and lipid peroxidation contributes to ischemic injury.
Hyperglycemia leads to diabetes mellitus. Diabetes mellitus is associated with a high risk of mortality, and a high incidence rate of diabetes is seen after stroke [16]. Diabetes aggravates neuronal dysfunction and damage associated with stroke by activating apoptosis-related proteins following cerebral ischemia [17]. Diabetes causes a more extensive infarct volume after stroke than that seen under normoglycemic conditions [1718]. The degrees of neuronal destruction and deficit during cerebral ischemia are more serious in diabetes compared to normal glycemic conditions [17181920]. We hypothesized that there are changes in α-synuclein expression in cerebral ischemic injury under diabetic conditions. We previously reported a decrease in α-synuclein expression in middle cerebral artery occlusion (MCAO)-induced cerebral ischemia [21]. Thus, we speculated that a more severe decrease would occur in a stroke model under diabetic conditions. The aim of this study was to elucidate whether diabetes modulates α-synuclein expression in cerebral ischemic injury.
Materials and Methods
Experimental animals
We purchased male Sprague-Dawley rats (200–220 g, n=64) from Samtako Co. (Animal Breeding Center, Osan, Korea). Animals were divided into four groups: non-diabetic + sham, diabetic + sham, non-diabetic + MCAO, and diabetic +MCAO. Streptozotocin (40 mg/kg, Sigma, St. Louis, MO, USA, dissolved in 0.1 mM citrate buffer pH 4.2) was given intraperitoneally to induce diabetes [2223]. Citrate buffer was injected to non-diabetic animals as a vehicle. Fasting blood glucose levels were obtained by Accu-Chek sensor (Roche, Mannheim, Germany). A fasting blood glucose level of >300 mg/dL was considered as diabetic as compared to normal <100 mg/dL. Animals were kept under controlled light (12 hours light/12 hours dark cycle) and temperature (25℃). Experimental procedures on animals were carried out according to the approved guidelines of the Institutional Animal Care and Use Committee of Gyeongsang National University. Blood glucose and body weight were measured before MCAO surgical operation.
Middle cerebral artery occlusion
Focal cerebral ischemia was induced by a MCAO surgical operation as a previously described method at 4 weeks after streptozotocin injection [24]. Zoletil (50 mg/kg; Virbac, Carros, France) was used as an anesthetic agent and was given by an intramuscular injection. Surgical process was carried out on the heating pad to maintain a constant body temperature of the experimental animals. The midline portion of the ventral neck skin was incised to expose blood vessels for surgical procedure. After incision, right common carotid artery (CCA), internal carotid artery (ICA) and external carotid artery (ECA) was separated from surrounding nerves and muscle tissues. Subsequently, occipital, superior thyroid and pterygopalatine artery was exposed, ligated permanently and cut. The right CCA was temporarily blocked with a micro-vascular clip and right ECA was ligated permanently. The right ECA was cut and small incision was made. A blunt end of the 4/0 monofilament was inserted through the incision of the ECA and occluded the middle cerebral artery. After occlusion, inserted monofilament nylon suture was fixed by ligation with ECA and skin incision was sutured with 3/0 black silk. Animals were sacrificed and brain tissue was isolated at 24 hours after the start of the occlusion. Animals with same surgical process except insertion of nylon is consider as sham-operated animals. Animals with following conditions were excluded from the study: failed to wake up from anesthesia, died within 24 hours after surgery. In this study, 2 animals in the non-diabetic +MCAO group and 3 animals in the diabetic +MCAO group were excluded due to MCAO failure.
Neurological functional test
Neurological functional test was performed on a 5 point scale after MCAO operation as follows: normal behavior with no observed neurological disorders (deficit grade 0), when pulled up by the tail, the forelimb of the contralateral side extended incompletely (deficit grade 1), circling is observed on the contralateral side and normal posture when there is no movement (deficit grade 2), leaning or lying on contralateral side when there is no movement (deficit grade 3), flaccid paralysis with no spontaneous movement (deficit grade 4).
2,3,5-Triphenyltetrazolium chloride (TTC) staining
Whole brains were extracted after 24 h of MCAO surgery, placed on steel brain matrix (Ted Pella, Redding, CA, USA), and sliced from the frontal pole by coronal section at 2 mm-thickness. Sliced brain tissues were immersed with 2% triphenyltetrazolium chloride (TTC) for 20 min at 37℃. The intact brain areas were stained as red color while infarcted brain areas were unstained as white color. Brain tissues were fixed in 10% buffered formalin and tissue images were obtained by Agfar ARCUS 1200™ (AgfarGevaert, Mortsel, Belgium). The infarcted area volume was measured by Image-ProPlus 4.0 software (Media Cybernetics, Silver Spring, MD, USA).and results were expressed as a percentage of infarcted area/total hemisphere area.
Two-dimensional gel electrophoresis
Proteomic analysis was performed according to a previously described method [25]. Right cerebral cortex tissues were homogenized in lysis buffer (8 M urea, 4% CHAPS, ampholytes, 40mM Tris-HCl). After centrifugation at 16,000×g for 30 min at 4℃, supernatant was collected and proteins were precipitated with 10% trichloroacetic acid. Precipitated proteins were pelleted by centrifugation and washed with 1M Tris-HCl (pH 7.6) and dried for 1 hour. Lysis buffer was added to dried pellets and total protein concentrations were measured using Bradford protein assay kits (Bio-Rad, Hercules, CA, USA) according to the manufacturer's protocol. Immobilized pH gradient (IPG) gel strips (pH 4–7 and pH 6–9, 17 cm, Bio-Rad) were reacted in rehydration solution (8 M urea, 2% CHAPS, 20 mM DTT, 0.5% IPG buffer, and bromophenol blue) for 13 hours at room temperature. Protein samples (50 µg) were loaded onto IPG strips using a sample cup and isoelectric focusing was carried out using an Ettan IPGphor 3 (GE Healthcare, Uppsala, Sweden) at 250 V (15 min), 10,000 V (3 hours), and then 10,000–50,000 V. After the first dimension, strips were reacted with equilibration buffer (6 M urea, 30% glycerol, 2% sodium dodecyl sulfate, 50mM Tris-HCl, bromophenol blue) with 1% DTT for 10 min. Strips were loaded on 7.5–17.5% gradient gels and second-dimension electrophoresis was performed at 10℃ using electrophoresis equipment (Protein-II XI, Bio-Rad) at 5 mA for 2 hours. Loading was continued at 10 mA until the bromophenol blue dye reached the bottom of the gel.
Silver staining, image analysis and protein identification
After electrophoresis, gels were incubated in fixing solution (12% acetic acid in 50% methanol) for 2 hours and washed two times with 50% ethanol for 20 min each. Gels were sensitized with 0.02% sodium thiosulfate for 1 min and rinsed with distilled water three times for 3 min. Sensitized gels were stained with silver stain solution (0.2% silver nitrate, 0.75 mL/L formaldehyde) for 20 min and washed with distilled water twice times for 1 min. Gels were reacted in developing solution (2% sodium carbonate, 0.5 mL/L formaldehyde) until protein spots were visible. Stained gels were scanned using an Agfar ARCUS 1200™ (Agfar-Gevaert, Mortsel, Belgium) and images were analyzed using PDQuest 2-DE analysis software (Bio-Rad). Protein spots were cut from stained gels and prepared for MALDI-TOF. Gel spots were dehydrated with 50 mM ammonium bicarbonate and acetonitrile, dried by vacuum centrifuge for 20 min. Protein particles were incubated with reduction solution at 56℃ for 45 min and alkylation solution (55 mM iodoacetamide in 0.1M ammonium bicarbonate) for 30 min. Dried gel spots were incubated with digestion solution (12.5 ng/mL trypsin, 0.1% octyl beta-D glycopyranside in 50 mM ammonium bicarbonate) at 37℃ overnight. Proteins were collected by extraction buffer (1% trifluoroacetic acid in 66% acetonitrile) and dehydrated for 2 hours by vacuum centrifuge. Nitrocellulose (20 mg/mL) was dissolved into acetone and isopropanol was added at the same volume as acetone. Nitrocellulose solution and alpha-cyano-4-hydroxycinnamic acid solution were mixed at 1:4. Calibrants were added to the matrix solution and dried proteins were dissolved in matrix solution by pipetting. Samples were loaded on matrix associated laser desorption ionization-time of flight mass spectrometry (MALDI-TOF) plates. MALDI-TOF used a Voyager-DETM STR biospectrometry workstation (Applied Biosystem, Foster City, CA, USA) and peaks were analyzed by the MS-Fit and ProFound programs. SWISS-PROT and NCBI were the protein sequence databases.
Western blots
Protein of cerebral cortex was extracted by homogenization with lysis buffer [1% Triton X-100 and 1 mM EDTA in PBS (pH 7.4)] containing 200 µM phenylmethylsulfonyl fluoride. Homogenate were centrifuged at 15,000×g, 4℃ for 1 hour and supernatants were isolated. The concentrations of total proteins were measured with a bicinchoninic acid protein assay kit (Pierce, Rockford, IL, USA). Extracted total proteins were loaded equal amount (30 µg) per lane and electrophoresed on 10% sodium dodecyl sulfate-polyacrylamide (SDS-PAGE) gel. Subsequently, separated proteins were blotted on polyvinylidene difluoride membrane (Millipore, Billerica, MA, USA) and membranes were blocked by 5% skim milk in order to block non-specific reaction. After blocking, membranes were washed with tris-buffered saline containing 0.1% Tween-20 (TBST) and incubated with following primary antibodies: anti-α-synuclein (1:1,000, BD Biosciences, San Jose, CA, USA) and anti-β-actin (1:1,000, Santa Cruz Biotechnology, Santa Cruz, CA, USA) for an overnight at 4℃. Membranes were washed with TBST to remove the unreacted primary antibody and incubated with horseradish peroxidaseconjugated anti-mouse IgG (1:5,000, Cell Signaling Technology, Beverly, MA, USA) for 2 hours at room temperature. Membranes were washed with TBST and finally reacted with by enhanced chemiluminescence (ECL) Western blot analysis system (Amersham Pharmacia Biotech, Piscataway, NJ, USA) according to the manufacturer's protocol. Signal of reaction was visualized on X-ray film (Fuji Film, Tokyo, Japan). Band signals were quantified as optical density value using Image J software and intensity of the band signal was expressed as a ratio, intensity to the β-actin signal.
Reverse-transcription PCR
Cerebral cortex tissues were homogenized with Trizol Reagent (Life Technologies, Rockville, MD, USA). Total RNA extraction from tissue homogenates was carried out by centrifugation at 13,000×g for 20 min at 4℃ in combined with additional chloroform extraction protocol and 70% ethanol washing step. The extracted RNA samples were dissolved in RNase-free water and subjected to spectrophotometric analysis at a wavelength of 260 nm to measure the RNA concentration. The quantified RNA sample was used to synthesize first-strand cDNA at 500 ng. The reverse-transcript reaction was carried out using the Superscript III first strand system (Invitrogen, Carlsbad, CA, USA) by the manufacturer's recommended protocol. PCR was performed to amplify the target sequence through the prepared cDNA by using AccuPower® PCR PreMix (Bioneer, Daejeon, Korea) and a primer with the following sequences for target gene detection: 5′-TGCTGTGGATATTGTTGTGG-3′ (forward primer) and 5′-AGGTGCATAGTCTCATGCTC-3′ (reverse primer) for α-synuclein, 5′-TTGCTACCCTAACCTTGACC-3′ (forward primer) and 5′-TCCCGTTCGACTTTCTTTT-3′ (reverse primer) for β-actin. PCR conditions were as follows: initial denaturation for 5 min at 94℃; 30 cycles of 30 sec at 94℃, 30 sec at 54℃, and 1 min at 72℃; and final extension for 10 min at 72℃. PCR products were then mixed with Loading STAR (Dyne bio, Sungnam, Korea) and loaded on 1% agarose in tris acetate-EDTA buffer. The loaded PCR products were visualized by UV light and captured.
Data analysis
The experimental data are expressed as the mean±S.E.M. The intensity analysis was performed using SigmaGel 1.0 (Jandel Scientific, San Rafael, CA, USA) and SigmaPlot 4.0 (SPSS Inc., Point Richmond, CA, USA). The results for each group were compared with two-way analysis of variance (ANOVA) followed by a post-hoc Scheffe's test. Differences were considered statistically significant at P<0.05.
Results
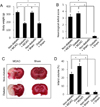
We confirmed the hyperglycemic condition in streptozotocin-treated animals. Blood glucose level was 103.7±2.5 and 319.6±21.5 mg/dL in non-diabetic +MCAO and diabetic +MCAO animals, respectively. We showed that diabetic animals have a lower body weight compared to non-diabetic animals with vehicle treatment. Body weight was 328.3±21.7 and 183.6±22.5 g in non-diabetic +MCAO and diabetic +MCAO animals, respectively (Figure 1A). Moreover, we confirmed that MCAO leads to neurological functional deficits. Neurological deficits score was a higher in diabetic +MCAO animals than that of non-diabetic +MCAO animals (Figure 1B). The results of TTC staining showed the degree of infarction in each group. MCAO injury caused cerebral infarction in both non-diabetic and diabetic animals. MCAO animals with diabetes had a more extensive infarct volume compared to MCAO animals without diabetes (Figure 1C). Infarct volume was 23.45±2.15 and 34.65±2.25% in non-diabetic +MCAO and diabetic +MCAO animals, respectively (Figure 1D).
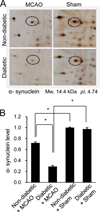
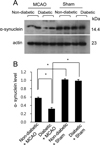
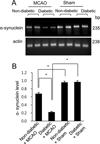
Using proteomics, we identified a decrease in α-synuclein expression in MCAO-injury animals. MCAO animals with diabetes had an extensive decrease in α-synuclein expression compared to non-diabetic +MCAO animals. However, α-synuclein expression was similar between sham-operated animals regardless of the presence of diabetic conditions. α-synuclein level in each group was analyzed in relation to the intensity of non-diabetic + sham. α-synuclein level was 0.71±0.03 in non-diabetic +MCAO animals and 0.29±0.02 in diabetic +MCAO animals, respectively (Figure 2). Western blot analysis demonstrated that the protein level of α-synuclein was decreased in both groups of MCAO-injured animals, regardless of blood glucose level. Diabetic animals with MCAO injury showed greater decreases in α-synuclein expression than non-diabetic animals with MCAO injury (Figure 3A). The protein levels are represented as the ratio relative to the intensity of the α-synuclein band to that of the actin band. α-Synuclein protein level was 0.58±0.02 and 0.32±0.03 in non-diabetic and diabetic animals with MCAO injury, respectively (Figure 3B). Moreover, reverse transcription PCR analysis also showed that α-synuclein transcript level was decreased in the cerebral cortex of MCAO-injury animals, and we observed a greater decrease in diabetic MCAO animals compared to non-diabetic MCAO animals (Figure 4A). α-Synuclein level was 0.68±0.03 in non-diabetic +MCAO animals and 0.21±0.02 in diabetic +MCAO animals (Figure 4B).
Discussion
Diabetes significantly aggravates cerebral ischemic injury-induced neurological deficits and infarction. Moreover, diabetes exacerbates brain damage through activation of neuronal apoptosis and necrosis [1718]. In this study, we confirmed that diabetes causes worse outcomes after MCAO injury than those associated with cerebral ischemia alone under normoglycemic conditions. Streptozotocin is the most common research agent that leads to high blood glucose level, ultimately causing diabetes. Streptozotocin treatment has been reported to markedly increase vascular density and blood-brain barrier leakage after stroke [26]. Moreover, many apoptotic proteins and inflammatory-related proteins are activated by streptozotocin treatment after ischemic stroke [2627]. Our results corresponded to data from previous studies on streptozotocin treatment-induced diabetes.
α-Synuclein is mainly expressed in brain tissue, where it is localized at the presynaptic terminals of neurons and is involved in regulation of synaptic vesicles and inhibition of lipid peroxidation [1011]. Lipid peroxidation caused by ROS can lead to cell damage. Thus, lipid peroxidation is a critical event in the pathogenic process during focal cerebral ischemia. Lipid peroxidation in neuronal cells can be regulated by α-synuclein. α-Synuclein aggregates in the form of a toxic beta sheet that form ROS which ultimately leads to lipid peroxidation in neuronal cells [28]. Metabolites such as 4-hydroxy-2-nonenal produced through the lipid peroxidation reaction interact with α-synuclein to induce the formation of toxic α-synuclein oligomer [2930]. Our previous study demonstrated that MCAO-injury leads to a reduction in α-synuclein expression [21]. The results of this study confirmed this decrease. Moreover, we identified a significant decrease in α-synuclein expression in diabetic MCAO-injured animals using a proteomic study. Western blot and reverse-transcription PCR analyses also confirmed that hyperglycemic conditions induce a greater reduction in α-synuclein expression compared to that seen in normoglycemic animals after MCAO. Abnormal expression of the α-synuclein gene is involved in some cases of neurodegenerative disorders, such as Alzheimer's disease and Parkinson's disease [3132]. Overexpression of wild-type α-synuclein has been shown to delay neuronal cell death caused by serum deprivation or hydrogen peroxide [33]. α-Synuclein also prevented reduction in glutathione level after serum withdrawal. However, mutant α-synuclein increases lipid peroxidation and accelerates cell death in response to various insults [33]. Glutathione exhibits an anti-oxidative effect and protects cells from toxins, such as lipid peroxides and free radicals [34]. α-Synuclein contributes to regulation of glutathione expression and inhibition of lipid peroxidation, consequently prevents cell death caused by ROS [34]. The results of this study showed a greater decrease in α-synuclein expression after cerebral ischemia in diabetic animals than in non-diabetic animals. Decreases in α-synuclein have been shown to contribute to lipid peroxidation and neuronal cell death. This study showed that diabetes exacerbates decrease of α-synuclein after ischemic brain injury compared to that of after injury under normal glycemic conditions. Although further study is needed to elucidate the protective mechanism of α-synuclein under diabetic conditions, these results suggest that diabetic condition leads to an excessive decline of α-synuclein in focal cerebral ischemia, consequently a reduction of α-synuclein cause more extensive brain damage in ischemic injury with diabetes.
 XML Download