

 PDF
PDF ePub
ePub Citation
 Print
Print


Islet quantity and function of domestic pigs might not necessary correlate with economic traits but importantly, matters diabetes mellitus studies of pig model, as well as animal selection for genetic manipulation in islet xenotransplantation [c.f. 1]. A recent dramatic increase in the incidence of diabetes worldwide has encouraged glucose homeostasis studies in diabetes-pig model and in islet-xenograft production; in both cases, the genetic concern is vital as it determines the islet vulnerability that may chiefly due to gene polymorphisms.
There are different forms of diabetes mellitus, although the common forms are type 1 (T1DM) and type 2 (T2DM). The lack of insulin production because of beta cell destruction typifies T1DM, whereas insulin receptor defects and the inability of beta cells to compensate with increased insulin release characterizes T2DM [2]. Despite distinctively different etiological mechanisms between T1DM and T2DM, the genetic susceptibility shows a degree of overlapping, and transcription factor 7-like 2 (TCF7L2) gene polymorphisms have been suggested as contributing factors to diabetogenesis in patients with either T1DM [34] or T2DM [56] or gestational diabetes in overall population and racial/ethnic subgroups [7].
In humans, the allele variants of TCF7L2 can be characterized into diabetes protective (C/C) and diabetes risk (C/T and T/T) types [6] and their role in glucose homeostasis has drawn intensive attention. Investigations have demonstrated that C allele protects beta-cells against apoptosis, stimulates beta-cell proliferation and mediates glucose-stimulated insulin secretion; yet, T risk allele associates with impaired insulin secretion, incretin effects as well as an enhanced rate of hepatic glucose production [5]. Therefore, TCF7L2 typing is becoming a prerequisite for the use of animal models for metabolic syndrome research.
Pigs may be the best large animal model for studying appetite, metabolic syndromes and obesity [8], and they are also used in studies on human bariatric surgery [9]. In commercial pigs, TCF7L2 variants are known to correlate with body fat-associated traits [10] and meat quality features [11], but the effects of different TCF7L2 variants (protective vs. risk) on the sensitivities to diabetes induction have not been studied. Heterogeneous genetic backgrounds can lead to dramatic responses to experimental procedures since, without TCF7L2 genotype information, the existing pig models would lose its referential values in diabetes understandings.
Porcine models have provided valuable insights into different aspects of glucose homeostasis; however, the vulnerability of these models to T1DM or T2DM is not well understood, which may be related to the TCF7L2 types. The present experiment was conducted to test the reaction of growing pigs with different TCF7L2 variants to diabetes induction using a low dose of streptozodocin (STZ), and the results should provide useful insights into the use of porcine models and the selection of animals, which will contribute to the design of more effective insulin-dependent and/or resistant experiments or other related purposes.
Materials and Methods
Animals
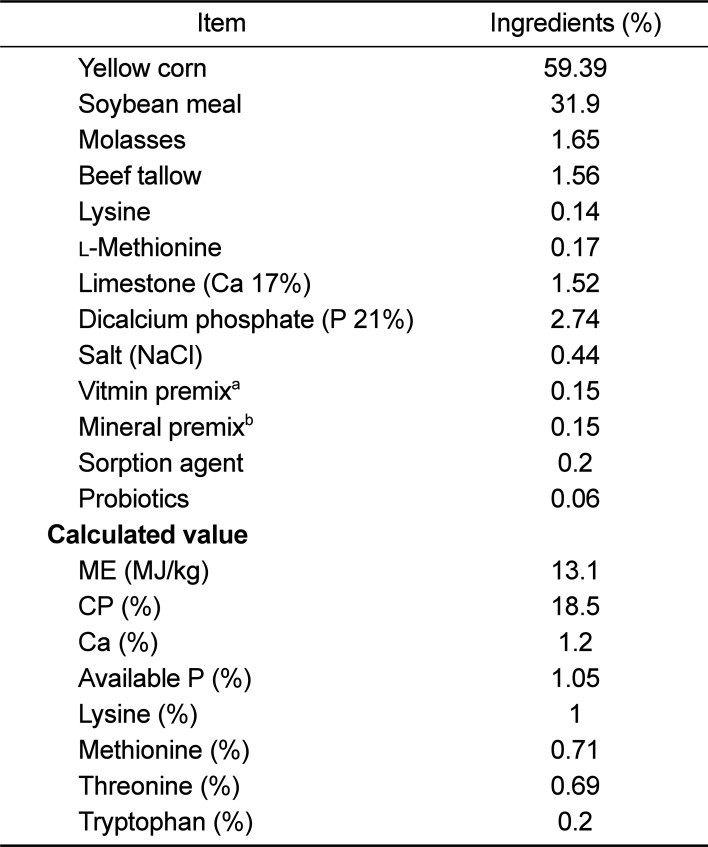
Growing pigs of both male and female (Landrace; 3 months old; 50–60 kg) reared in a station free from specific pathogens (atrophic rhinitis, Mycoplasma hyopneumoniae, pseudorabies, Actinobacillus pleuropneumoniae, swine dysentery, scabies, classical swine fever, foot and mouth disease and porcine reproductive and respiratory syndrome) and their TCF7L2 genotypes were screened and selected for the study. All animals were indoor-housed, kept on concrete floors with a back ditch covered by metal mesh for defecation, and the accommodation was artificially lit (450–600 lux for 9 hours a day) plus window sun light. They were fed a commercial diet formulated to meet the requirements recommended by the National Research Council [12] with an ad libitum water intake before the beginning of the study. The control diet contained 18.5% crude protein and 13.1 MJ/kg of metabolic energy (Table 1); the treatment diet was high fat/high sucrose (HFHS) ration composed of 53% control feed with 10% lard and 37% sucrose according to Liu et al. [13]. This mixture increased the energy content to 32.5 MJ/kg and sucrose to 15.0 MJ/kg. Six confirmed pigs of C/C type and 8 confirmed pigs of T/T type were allocated into the groups C/C (n=4 C/C, 1 male and 3 females), T/T (n=5 T/T, 3 males and 2 females), and control (n=5, all females, 2 C/C and 3 T/T). After grouping, the animals were fed normally for 2 weeks to acclimate to the new environment (2 m2/pig). All of the animals were managed and treated according to the Guidance on the Usage and Care of Laboratory Animals [14], and permission was granted by the institution (IACUC Approval No. 99024, Agriculture Technology Research Institute) where the animal study was conducted.
Gene PCR/RFLP typing
Pig genomic DNA was extracted from an ear tissue sample and the TCF7L2 genomic typing was conducted according to Du et al. [10] but with a different primer pair. Briefly, 100 ng DNA were denatured at 95℃ for 10 min and annealed with 10 nM of TCF7L2-E8 primer pair (forward: 5′-GTGGGGCGATGTCATTTTAG-3′ and reversed: 5′-GAGGCTGCACCAACAAAGTC-3′), instead of TCF7L2-E8G, at 57℃ for 5 min [10]. Then, 35 cycles of PCR amplification were conducted, which produced a 614 bp amplicon. The single nucleotide polymorphism was confirmed by digesting the PCR products with HphI, which revealed a 614 bp band (T/T type), 169 and 445 bp bands (C/C type) and 614, 445, and 169 bp bands (T/C type).
Diabetic induction and oral glucose tolerance test (OGTT)
The study was conducted under an environment of 18–31℃ and started with an injection of citrate-dissolved STZ (Sigma, USA) into the ear vein of restrained pigs through an IV catheter (40 mg/kg, 1 g/10 mL/10 min) for both treatment groups. Citrate solution was administered to the control animals through the same route. A second injection at the same dosage was administered one week later. The treatment animals were then fed a HFHS diet, and the control animals remained on normal ration feeding. All of the pigs were weighed weekly, and the daily allowance of feed was adjusted weekly using the standard of 4% body weight; and their health and welfare were inspected by a stationed veterinary in the meantime. All pigs were fed once daily during 08:00~10:00. The fasting and postprandial glucose were measured using the sera sampled from pigs immediate before and 2 h after daily feeding, respectively. At 14 and 28 days after HFHS feeding, the OGTT was conducted. All pigs were withheld from morning feeding, a blood sample was collected according to the method described by Sankari [15], and approximately 10 min later, they pigs were offered a mixture of glucose (2 g/kg) (Shimakyu's Pure Chemicals, Japan) and an equal amount of control feed. Blood samples were again collected at 0- (glucose mixture completely consumed), 15-, 30-, 60-, 90- and 120-min post glucose ingestion. The OGTT was also repeated on the first day at weeks 8 and 12 of the study, although blood was only sampled once at 120-min post prandial.
Pancreas procuring, blood analysis and insulin determination
The study was terminated at the end of 12 weeks post treatment by slaughtering through electrical stunning and exsanguination and the entire pancreas was obtained and weighed after towel cleaning. Each pancreas was incised to obtain 3 samples (1 cm3 in size) from the anterior (close to duodenum), median (close to superior mesenteric artery) and the most posterior sites. The obtained tissues were fixed in 10% formalin immediately. All of the blood samples were centrifuged and the obtained plasma was stored in vials at −80℃ until analysis.
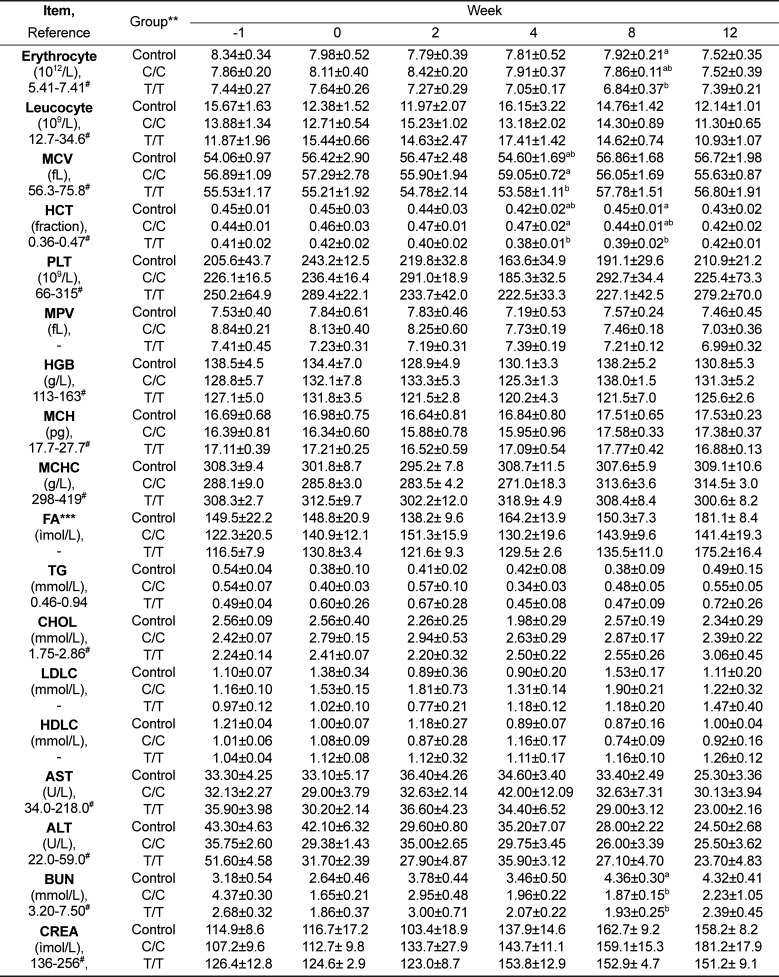
The blood clinical profile was analysed using a VITROS DT60II and a DTSC II (Johnson & Johnson Clinical Diagnostics, Inc., USA), and glucose, triglycerides, cholesterol, low density lipoprotein-cholesterol, high density lipoprotein-cholesterol, aspartate aminotransferase, alanine aminotransferase, urea nitrogen and creatinine measurements were performed. The plasma insulin and fructosamine concentrations were determined using enzyme-linked immunosorbent assay kits designed for pig insulin (Shibayagi, Japan) and fructosamine (EIAab® Science, Co., Ltd., China). The homeostatic model assessment-insulin resistance index (HOMA-IR) was calculated using the equation HOMA-IR=fasting blood insulin (µIU/mL)×fasting blood glucose (mmol/L)/22.5 [16].
Immunohistochemistry (IHC)
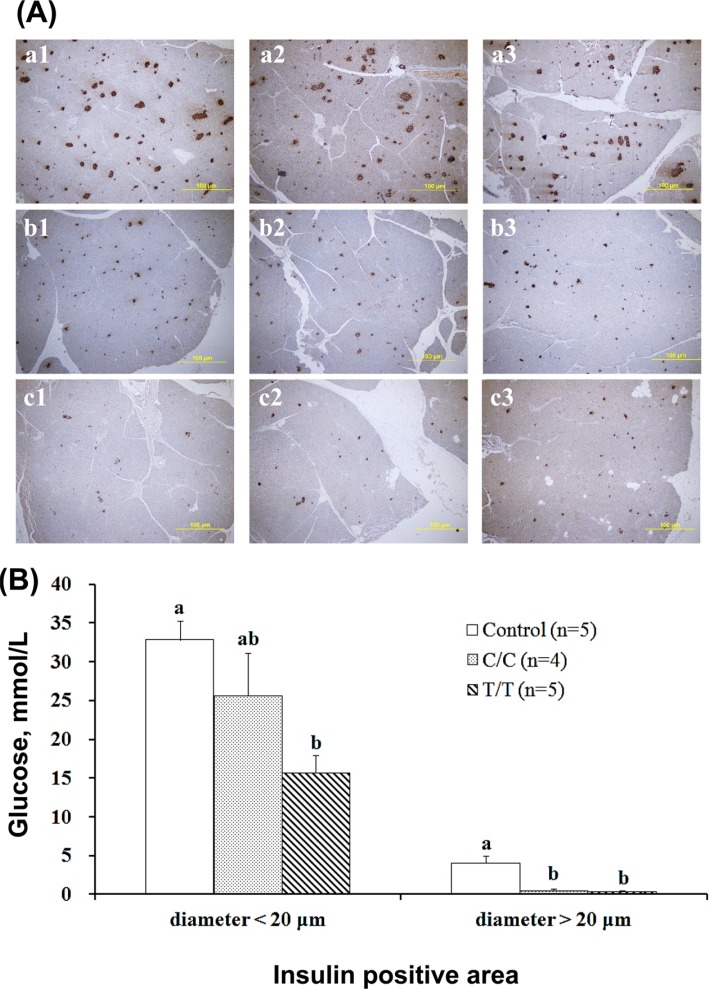
After fixation in 10% formalin for 24 hr, the pancreas tissues were sliced and embedded in paraffin. Then, tissue was sectioned at 3 to 4 µm thickness. The section slide was de-waxed, further sequentially treated with 100, 95, 80, and 70% ethanol, and then heated to activate the antigen. After washing with PBST (phosphate-buffered saline mixed with Tween 20, 100: 0.05), the tissues were stained with a Super Sensitive™ IHC detection system (BioGenex, USA). Then, the signals were revealed by DAB Quanto Chromogen with Substrate (1:30). The insulin positive areas (IPAs) were observed under a microscope. IPA diameters larger than 20 µm and smaller than 20 µm were counted in triplicate on the anterior, median and posterior sides of the pancreas, and the IPA value represented the mean value of 9 counts.
Results
Growth performance and blood analysis
The treated animals appeared and behaved normally, and polyuria was not observed. During the study period, the C/C type with an initial weight of 54.4±2.0 kg and the T/T type with an initial weight of 58.2±1.2 kg all gained weight and showed increased back-fat thicknesses to values similar to those of the control, which started at 56.5±2.1 kg; however, the C/C and T/T type pigs showed increased energy intakes of 16 and 12% compared with the control animals, respectively. The measured plasma parameters, including fructosamine, all were within normal range during the study except for glucose and insulin; also blood urea nitrogen (Table 2) was significantly reduced due to lower protein intake than that of control.
Blood glucose and OGTT
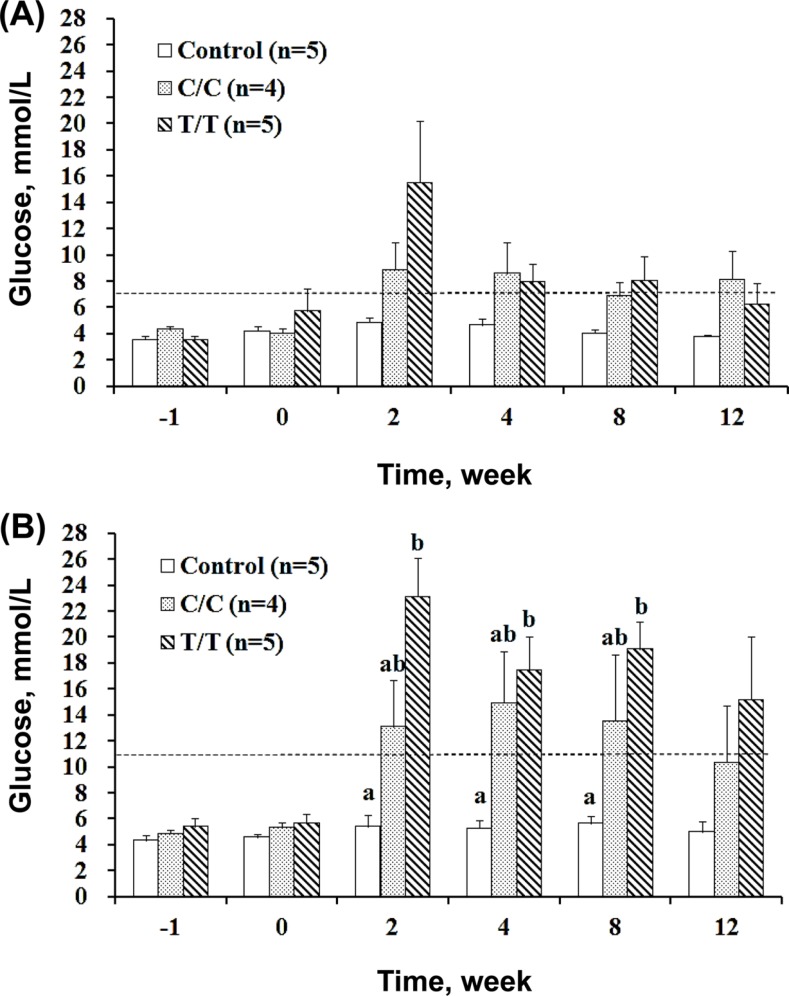
According to the ADA in 2015 [2], diabetes is diagnosed when patients show a fasting plasma glucose level higher than 7.0 mmol/L (or 126 mg/dL) or a postprandial plasma glucose concentration greater than 11.1 mmol/L (or 200 mg/dL). In this investigation, these criteria were adopted for the porcine model.
The effect of the treatment on the plasma glucose level of pigs is shown in Figure 1. The fasting glucose level evaluation (Figure 1A) indicated that hyperglycemia was more prominently induced in the T/T than C/C genotype carriers two weeks after the treatment, and it only lasted for a short period of time (less than 2 weeks) because the plasma glucose gradually returned to normal. By the postprandial standard, hyperglycemia was induced at a greater level (P<0.05) at 2 weeks after treatment in the pigs with the T/T genotype, which indicates a greater risk of diabetes. The symptoms lasted for at least 10 weeks (2 to 12 weeks post treatment) in the pigs with the T/T genotype and for at least 6 weeks (2 to 8 weeks post treatment) in those with the C/C genotype. The plasma glucose elevation of the T/T pigs but not the C/C pigs reached statistical significance at 6 weeks when compared with that of the control (Figure 1B). Figure 1A and Figure 1B illustrate that T/T pigs were more vulnerable to developing hyperglycemia after the treatment compared with the C/C carriers. In addition, the T/T pigs required a longer period to restore normal glucose homeostasis than the C/C animals.
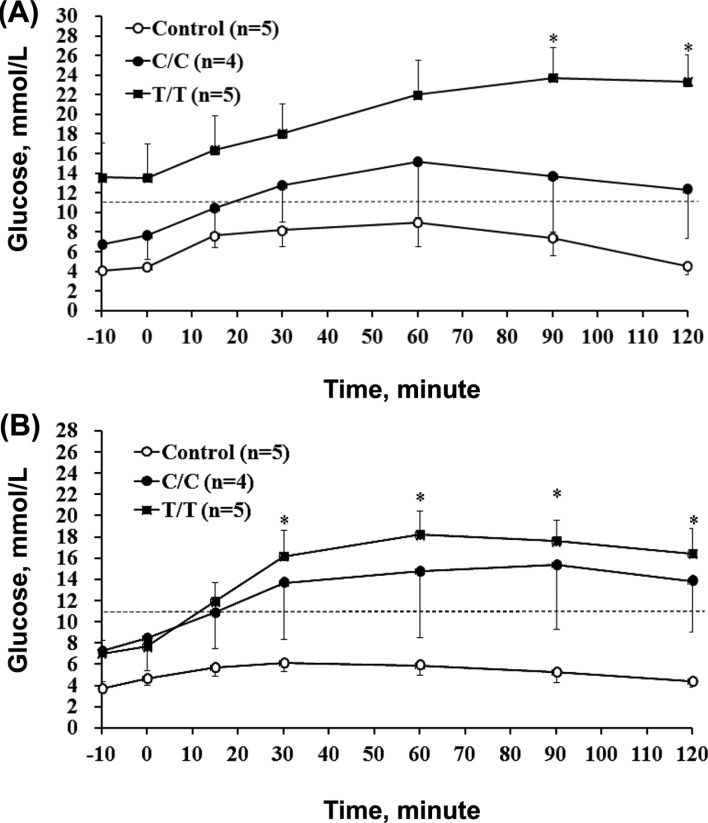
The OGTT was conducted in the 2nd and 4th week, and the results are shown in Figure 2A and 2B, respectively. Normal glycemic regulation was observed in the controls because the level stayed within the normal range. Impaired regulation was displayed in the treated pigs from the 2nd to 4th week after treatment because the concentration curves were all above the upper limit from 30 min after glucose loading (glucose absorption began at this point). More deviated curves were observed with by the T/T genotype than the C/C genotype as shown in Figure 2A and Figure 2B, which suggests that the regulation was more compromised. The results of Figure 2 further support the finding that T/T pigs were more susceptible than C/C genotype carriers to STZ-diabetes.
Insulin concentration and resistance
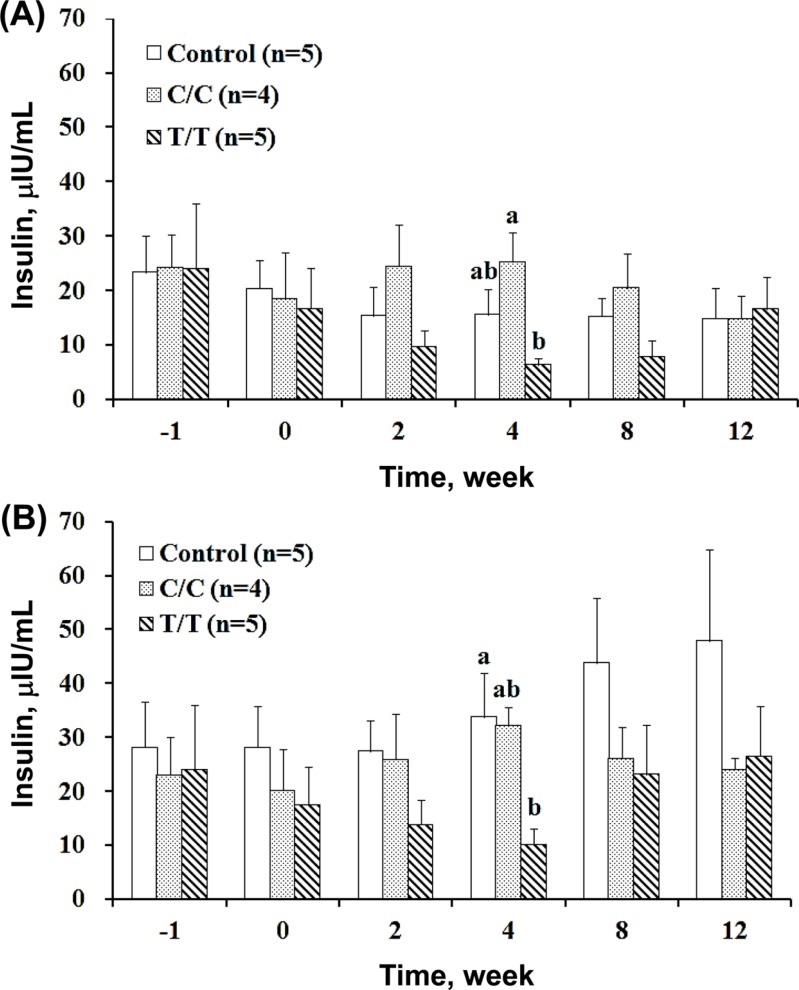
The fasting and 2 h postprandial plasma insulin contents were measured at different study time periods, and the data are shown in Figure 3A and 3B, respectively. Figure 3A shows that the C/C pigs had a similar insulin level to those of the control throughout the entire study, although the C/C pigs exhibited hyperglycemia as shown in Figure 1A and 1B. However, the T/T pigs also developed hyperglycemia and showed a gradual decline in plasma insulin concentration after treatment. The plasma insulin concentration reached the lowest at the 4th week post treatment and then returned to normal steadily as the plasma glucose level changed. The 4th week fasting insulin concentration of the T/T animals was 6.37±1.15 µIU/mL, which was only one fourth of the level showed by the C/C animals at 25.27±5.33 µIU/mL despite the identical treatments (Figure 3A). The postprandial plasma insulin level (Figure 3B) of the control pigs (33.79±8.10 µIU/mL) or C/C animals (32.14±3.49 µIU/mL) was three times higher than that of the T/T pigs (10.12±2.93 µIU/mL). Parallel changes were observed in the plasma glucose and insulin levels in the T/T pigs but not in the C/C pigs, which is shown in Figure 1A, 1B, 3A, and 3B. The disassociation of the plasma glucose and insulin levels in the C/C pigs suggested hormone dysfunction and insulin resistance.
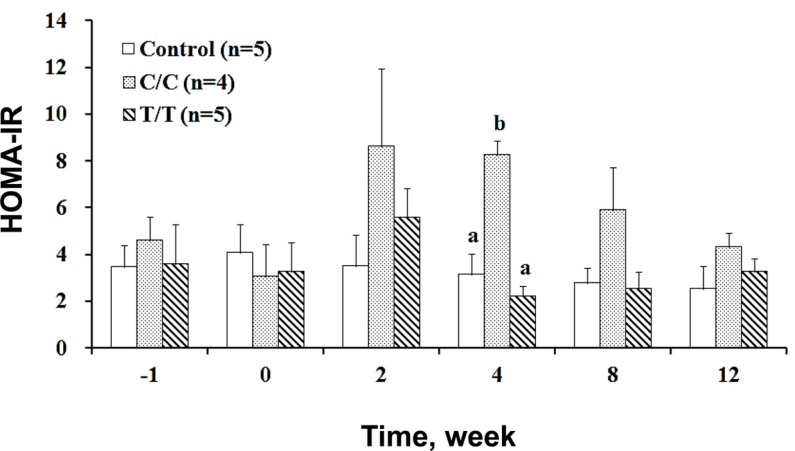
Insulin resistance can be quantified by the HOMA-IR, and the results are shown in Figure 4, which clearly illustrated that resistance only occurred in the C/C pigs for a period of approximately 2 weeks (from the 2nd to 4th week post treatment) and gradually retreated. Although the pigs of the T/T genotype developed hyperglycemia, they showed no signed of insulin resistance throughout study. Clearly, the same treatment induced insulin-dependent diabetes in the T/T pigs and insulin resistance in the C/C pigs.
Pancreas weight and immunohistochemistry analysis of the islets
The pancreas mass in primates is exponentially correlated with body weight according to the equation y (g)=2.0×kg0.91 [17]. The pig pancreases in this study were weight adjusted accordingly by 1.84 kg0.91 in control animals, 1.46 kg0.91 in the C/C carriers and 1.55 kg0.91 in the T/T carriers. The STZ treatment resulted in a reduction in the pancreas mass by 21% in the C/C pigs (P<0.05) and 16% (P<0.10) in the T/T pigs, and the pigs with the C/C and T/T genotypes showed slight differences.
The histological examination results of the pancreas tissue are shown, and we compared the number of endocrine functioning sites represented by IPAs greater and less than 20 µm in size (Figure 5). The total control number of IPAs less than 20 µm in size was 33±2, which was not significantly lower (26±6) in the C/C pigs and significantly lower (16±2) in the T/T pigs (Figure 5B). The larger IPAs (>20 µm) were 2 to 7 (4±1) in the control, 0 to 1 in the C/C pigs and 0 or immeasurable in the T/T pigs (Figure 5B). The reduced number of IPA sites of either size displayed by the T/T pigs clearly indicated that their pancreases were more damaged because of the treatment.
Discussion
Genetic signals from both T1DM and T2DM are observed in the TCF7L2 loci, and its role in metabolic homeostasis has drawn intense attention, especially at the T allele, which is a significant risk factor that is strongly associated with susceptibility to T2DM in humans [56]. The present study revealed that the C/C pigs exhibited a protective effect against beta cell destruction caused by STZ injection because the treatment had little effect on the insulin concentration, whereas it induced hypoinsulinemia in the risky T/T carriers. However, hyperglycemia was found in both types, indicating that the C/C pigs developed insulin resistance and the T/T pigs became an insulin-dependent model, which was quantified by the HOMA-IR calculation. This finding is inconsistent with the general conclusion that T/T genotype is vulnerable to insulin resistance [5] rather than dependent hyperglycemia. The most likely reason for the discrepancy is that the STZ-induced damage to the beta cells is too severe to allow insulin secretion in risky type pigs with the T/T allele, whereas the damage to the C/C carriers was not high enough to prevent insulin secretion, although the protective effect was reduced. Nevertheless, the protective effect of the C/C genotype exerted a defensive action; therefore, pigs with different TCF7L2 variants showed a dissimilar susceptibility to the same STZ dose and developed different models of hyperglycemia.
Currently, STZ is the most frequently used drug to induce T1DM as well as T2DM in rats and mice, and multiple low doses of STZ (20 to 40 mg/kg) are used to cause beta cell destruction [1819]. The administration of STZ to pigs is problematic for determining the dosage, which should not be determined by direct extrapolation from suggestions for rats because the metabolic rate and size adjustment must be taken into consideration. Assuming a low level of 40 mg/kg STZ is used for a rat of 0.5 kg, then 20mg should be administered; however, once metabolic weight is related, then the dosage is changed to 33.6 mg kg0.75. In the present study, pigs of 50–60 kg were also treated with (a considered low level of) 40 mg/kg STZ, but this equals to approximately 110 mg kg0.75, thus representing a 3.3-fold higher metabolic loading of the chemical compared with that of the rats mentioned above. Therefore, the pigs treated in this experiment physiologically endured a relatively high dose of STZ, which may explain the finding that there was a significant decrease in both the total pancreas mass and functional beta cells 12 weeks after treatment.
The results obtained in this study suggest that the pancreas of Landrace pigs in their growing stage (60 kg to 110 kg) was too damaged in the diabetes state induced by the two injections of 40mg STZ/kg. However, previous studies have indicated that to induce diabetes in early growth stage pigs at 20–35 kg, a single high STZ dose of 150 mg/kg is required [2021]. However, pigs of a young age under such a high dosage failed to become fully diabetic. Hara et al. [22] treated similar young pigs at 25 kg with a further higher dose of 200 mg/kg and successfully induced complete diabetes for at least 20 weeks. Our results clearly demonstrated for 60 kg pigs, that such a high level is unnecessary and showed that two injections of 40 mg/kg STZ in weekly intervals could sufficiently produce temporary hyperglycemia because of insulin deficiency or insulin resistance depending on the TCF7L2 variant of the pig. Temporary symptoms with changing clinical parameters, such as plasma glucose and insulin concentrations, are not acceptable for a reliable diabetic research model. Thus, additional STZ treatments may be required to induce lasting complications for steady diabetes to create more controllable experiments for diabetes research using a commercial pig model.
The variations in response to STZ injections in pigs in the literature can be partially attributed to the unidentified genetic background of TCF7L2 types. The other main effect may be variations in the ages of the animals. Commercial pigs at 20 kg are juvenile (couple of weeks after weaning), and in this early pre-adolescent stage, their tissues are actively proliferating. Thus, a high dose of STZ is required to induce diabetes. The pigs used in this study were in the growing period, and their relatively lower growth vigour might have increased their sensitivity to STZ toxicity when compared to younger pigs. Thus, less STZ was needed to destroy the beta cells. Several induced diabetic pig models have been reported in the literature, although direct comparisons of the results are meaningless, as the TCF7L2 background is unknown and different animal sizes and STZ dosages were used. A reliable procedure to induce diabetes using STZ in growing or growing pigs with steady complications for controllable follow-up experiments has not been established because syndromes vary with different growth stages and treatment dosages, and are further complicated by TCF7L2 types.
When using domestic pigs as animal models for human medicine, their physiological maturity is also a concern. Commercial boars attain full adulthood at approximately 3 years old because semen quality characteristics are the highest at that age [23]. In men, semen volume and sperm motility peak at 22 years of age [24]. Thus, in principle, a 3-year-old boar of a commercial breed and a 22-year-old man are similar in their physiological age. This analogical comparison is important for interpreting the results because testosterone is known to be involved in T1DM [25] and more notably in T2DM complications [26]. Because estrogen also plays a role in diabetic pathophysiology [27] and gender differences in the risk of T2DM have become an important issue [28], adolescence and sex difference must be evaluated in diabetic animal models. Thus, growing pigs were used in the study and believe the gender differences should be minimal.
In rats, the beta cell number increased from 2,300 to 5,000 cells as they aged from 2 to 18 months, and the islet insulin content doubled. In addition, the insulin secretion per beta cell was decreased despite increased stores of insulin per cell [29]. This beta cell growth pattern likely occurs in pigs as well. Therefore, growing commercial pigs of 20 to 60 kg and 60 to 100 kg may indicate two different phases of islet growth, and they may represent pediatric and juvenile models for studies of diabetic children, which is now increasingly common [3031].
The T allele of TCF7L2 in mouse appears to mediate beta cell proliferation [32] and regeneration [33]. However, whether pancreas size and function vary with different TCF7L2 genotypes in pigs has not yet been revealed, although it is reasonable to speculate that C/C type carriers may have a greater beta cell mass, higher beta cell number or greater islet insulin content to allow these animals to exert a higher endurance and protective effect. This speculated defensive mechanism requires scientific evidence, although the present study showed certain indications. As shown in Figure 5, approximately 80% of the insulin active sites had been eradicated by the STZ treatment, although the remaining sites functioned effectively and not only restored normal insulin levels but also allowed the insulin resistance index to show type difference. Therefore, compensation occurred in both types but in different ways, thus causing the index to differ.
Modern domestic pigs are heavily selected for economics traits, and they have relatively smaller heart and liver sizes with higher cardiac output and metabolic rate compared with unselected breeds, which are usually smaller in mature body weight [3435]. The pancreas weight across mammals can be expressed by the allometric equation y (g)=2.0×0.91 [17], although it corresponded to 1.84 kg0.91 in the control animals used in this study, suggesting that commercial pigs have a relatively smaller pancreas mass. Additionally, their heart and liver are smaller compared with that of other mammals, including wild pigs, which is an additional concept that must be considered during results comparisons or interpretations of models in which domestic pigs are shown to be different from miniature pigs that have not been selected for the economic burden of metabolic traits. This difference may result in changes in several organ sizes and functions.
Diabetes genetic risk variants have become an issue in humans and in pig models of various interaction forms, including pediatric, juvenile, male, female, and castrated plus domestic verses miniature pig models that address insulitis-T1DM or T2DM. Recently, porcine islets have received more attention for xenotransplantation because once these islets have been genetically modified; they can overcome rejection to some extent [36]. Thus, in theory, genetic modified pigs preselected with the TCF7L2 protective type C/C may provide better or longer lasting islet xenografts to diabetic patients compared with pigs with the T/T sensitive type. The present study points out genetics and other related concerns of diabetes-pig model and emphasizes that well-designed diabetic pig studies could provide useful insights for metabolic syndromes and would likely be of interest for investigations of the glucose homeostasis of pigs, which is similar to that of humans.
Conclusions
Commercial growing pigs with different polymorphisms in the TCF7L2 gene distinctively showed a dissimilar susceptibility to the same STZ dose and developed different models of hyperglycemia. Allele variants of C/C pigs developed insulin resistance and the T/T carriers became an insulin dependent model. Growing pigs may be an excellent model for diabetics in children or islet xenograft only when the animals are TCF7L2 polymorphisms pre-selected.
 XML Download