

 PDF
PDF Citation
 Print
Print


INTRODUCTION
According to the world report on disability (2011) by the World Health Organization (WHO), approximately 15% of the world's population, i.e., approximately one billion people, are estimated to have disabilities.1 In Korea, as of 2016, registered individuals with disabilities account for 4.9% of the total population. The population with disabilities increased in number until 2011 and stabilized since 2012.2
Korea implemented a registration system for individuals with disabilities to better generate disability statistics.3 According to the registration system, disability is registered as one of the following fifteen categories: physical, brain lesions, vision, hearing, language, facial, kidney, heart, liver, respiratory, intestinal and urinary fistula, epilepsy, intellectual, mental, and autism. Each disability is classified into six grades according to severity.
Individuals with disabilities are vulnerable to preventable secondary diseases, comorbidities, untreated mental health statuses, poor oral health, high obesity rates, and early mortality.4 Furthermore, approximately 87% of the population with disabilities has one or more health problems, while 75.9% has two or more health problems; a report indicated that the average number of health problems was 4.1.4 These statistics indicate that individuals with disabilities are subject to poorer health management than individuals without disabilities, which increases their risk of developing more health problems and early death.
High morbidity and premature death are major problems affecting populations with disabilities. However, most studies on mortality and causes of death in the population with disabilities have focused on specific types of disabilities, such as intellectual disabilities, instead of examining the overall population with disabilities. For example, a British study on individuals with intellectual disabilities reported that all-cause mortality was approximately 3.6 times higher individuals with intellectual disabilities than in those without.5 Furthermore, a US study on individuals with intellectual and developmental disabilities reported that all-cause mortality was approximately 1.8 times higher in individuals with disabilities than in those without.6
Similarly, an Irish study on individuals with intellectual disabilities reported that mortality was approximately 4 times higher in individuals with disabilities than in those without.7 A systematic review and meta-analysis of 203 studies also reported a 2.22 times higher all-cause mortality in the individuals with mental disabilities than in those without, and potential life lost was approximately 10 years.8 However, few studies have examined the burden of premature death in the overall population with disabilities—as opposed to premature death due to specific types of disabilities—in comparison with the population without disabilities and analyzed disability-specific features. In Korea, studies investigating mortality in overall population with disabilities are rare, even for specific types of disabilities.
Therefore, the present study aims to compare the disease burden of premature death between the overall population with disabilities and total population, and examine the effects with specific causes of death amongst age groups and gender. This study also identifies disability-specific features of years of life lost (YLLs) due to premature death.9
METHODS
We measured the disease burden of premature death in people with disabilities using YLLs. YLLs are an indicator of mortality due to premature deaths and used to measure disability-adjusted life years (DALYs), a metric introduced by the global burden of disease (GBD) study designed to measure the disease burden of premature death. This study compared the burden of disease between the population with disabilities and total population using the methodology suggested by the 2012 burden of disease study on Koreans, and the results of that study were compared with ours. The comparisons were made in units of YLLs. The meaning and calculations of YLLs are detailed in the previous literature, and the methodology for studying burden of disease in Koreans has also been described in another study.10 Here we only outlined the method of calculating YLLs in this study.
In this study, YLLs were calculated using the equation below, with a 3% age-weighting rate and 4% time-discount rate.11 To calculate YLLs due to death, we multiplied the number of deaths by standard life expectancy for each gender and age group, and summed YLLs of all age groups. The standard life expectancy suggested by the 2012 Statistics Korea survey was applied for the calculations.12

r = discount rate, β = age-specific weight parameter, K = use of age-specific weight (using age-weight, applied 1; not using age-weight, applied 0), C = constant, a = age at death, L = life expectancy at death.
To calculate the disease burden of premature death in people with disabilities, we combined disability registration data from the Ministry of Health and Welfare (2002–2011) and the causes of mortality data by Statistics Korea for 3,158,231 people by personal identification number. After excluding people with incomplete data, such as omissions in gender, age, type of disability, or grade of disability, a total of 3,156,038 people were analyzed. The causes of mortality of 68,323 deaths that occurred in 2012 were identified and classified using the Korean National Burden of Disease (KNBD) study classification, a Korean-adapted version of the disease classification system used in the GBD study by the WHO in 2010.10 The KNBD study classification system comprises four levels. Level 1 is divided into three categories: communicable, maternal, neonatal, and nutritional disorders; non-communicable diseases; and injuries. Diseases are subdivided into 21 categories in level 2, which are further subdivided in level 3, and further still in level 4.9
To improve the accuracy of causes of death, in cases where garbage codes were input, the causes of death were redistributed according to the garbage code algorithm originally developed by the GBD 2010 study and was adapted for use in Korea in the KNBD 2012 study.10 YLLs were calculated for each cause of death, based on deaths that occurred in 2012, and groups with high YLLs were identified among different groups of age (10-year age groups) and types of disabilities.
All analyses were conducted using SAS 9.3 (SAS Institute, Cary, NC, USA).
RESULTS
In 2012, 28,000 people with disabilities died, which accounted for 10% of the deaths in the total population. YLLs of people with disabilities were 517,337, which accounted for 23.4% of YLLs of the total population. YLLs per 100,000 people in the total Korean population were 4,344, but those for people with disabilities were approximately 3.8 times higher (16,392). YLLs of men with disabilities were higher than those of women with disabilities, and YLLs per 100,000 were also higher in men with disabilities than women with disabilities. In terms of age, the population with disabilities demonstrated marked differences compared to the total population. Among the population with disabilities, YLLs were highest in the 70–79-year-old group (25.9%), followed by the 60–69-year-old group (22.2%) and 50–59-year-old group (20.4%). However, in the total population, YLLs were highest in the 50–59-year-old group (19.8%), followed by the 70–79-year-old group (18.0%) and 60–69-year-old group (16.2%). YLLs per 100,000 for the 0–9-year-old group were 14.9 times higher in population with disabilities (27,031) than the total population (1,815); this gap between total population and population with disabilities decreased with advancing age and was 14.0 times higher in population with disabilities than the total population in the 10–19-year-old group and 7.2 in the 20–29-year-old group. In contrast, in the ≥ 80-year-old group, YLLs per 100,000 were higher in the total population than in the population with disabilities (Table 1).
Table 1
Total YLL by gender and age group for the total population and people with disabilities in 2012
![]()
For causes of mortality, YLLs due to non-communicable diseases were highest (417,625), accounting for 80.7% of all YLLs, followed by YLLs due to injuries (78,545; 15.2%) and YLLs due to communicable, maternal, neonatal, and nutritional disorders (21,167; 4.1%). Among non-communicable diseases, cardiovascular and circulatory diseases were associated with the highest YLLs (YLLs, 130,856), followed by neoplasms (YLLs, 124,567) and diabetes, urogenital, blood, and endocrine diseases (YLLs, 60,909). For injuries, self-harm and interpersonal violence were associated with the highest YLLs (YLLs, 37,924), followed by unintentional injuries, except for transport injuries (YLLs, 26,404) and transport injuries (YLLs, 13,187). Among communicable, maternal, neonatal, and nutritional disorders, diarrhea, lower respiratory infections, meningitis, and other common infectious diseases were associated with the highest YLLs (YLLs, 9,568), followed by human immunodeficiency virus/acquired immune deficiency syndrome (HIV/AIDS) and tuberculosis (YLLs, 7,921). For level 2 diseases, cardiovascular and circulatory diseases were associated with the highest YLLs per 100,000 people (4,146), which accounted for 25.3% of the total YLLs. Neoplasms had the second-highest YLLs per 100,000 people (3,947; 24.1%), followed by diabetes, urogenital, blood, and endocrine diseases (1,930; 11.8%), and self-harm and interpersonal violence (1,202; 7.2%). YLLs due to these four diseases were 354,256, accounting for 68.5% of the total YLLs (Table 2).
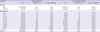
Table 2
YLL for 21 causes of death in individuals with disabilities in 2012
YLL = years of life lost, HIV/AIDS = human immunodeficiency virus/acquired immune deficiency syndrome.
![]()
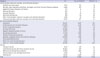
We examined diseases that caused the greatest YLLs in each age group. For the 0–9-year-old group, neonatal disorders caused the greatest YLLs, accounting for 36.6% of the total YLLs (YLLs per 100,000 people, 9,896). Neurological disorders were responsible for the most YLLs in the 10–19-year-old group with disabilities (24.8% of YLLs in the 0–9-year-old group; YLLs per 100,000 people, 2,855), and self-harm and interpersonal violence caused the most YLLs in the 20–39-year-old group with disabilities (22.8% of YLLs in the 20–29-year-old group; 19.0% of YLLs in the 30–39-year-old group). Neoplasms caused the highest YLLs in the 40–69-year-old group with disabilities (21.0% of YLLs in the 40–49-year-old group; 26.4% of YLLs in the 50–59-year-old group; 29.1% of YLLs in the 60–69-year-old group). Cardiovascular and circulatory diseases were associated with the highest YLLs in the ≥ 70-year-old group with disabilities (32.8% of YLLs in the 70–79-year-old group; 38.4% of YLLs in the ≥ 80-year-old group). YLLs due to cardiovascular and circulatory diseases tended to increase with advancing age. Self-harm and interpersonal violence accounted for the highest proportion of YLLs in the 20–29-year-old group; however, this proportion demonstrated a decreasing trend from 20 years of age (Fig. 1).
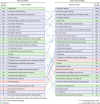
 | Fig. 1Percentage of YLL for people with disability by cause and age group in 2012.YLL = years of life lost, HIV/AIDS = human immunodeficiency virus/acquired immune deficiency syndrome.
|
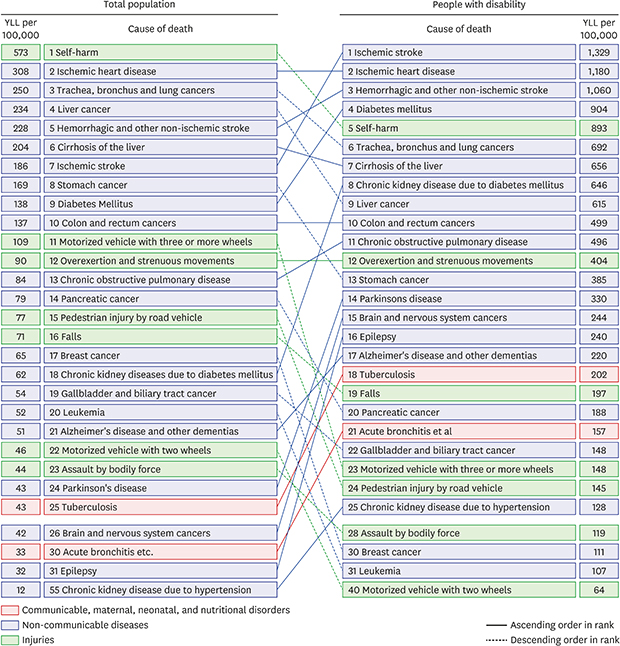
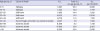
We analyzed the burden of disease for each disease group. Ischemic stroke was associated with the highest YLLs per 100,000 people (1,329), followed by ischemic heart disease (YLLs per 100,000 people, 1,180), hemorrhagic and other non-ischemic stroke (YLLs per 100,000 people, 1,060), diabetes mellitus (YLLs per 100,000 people, 904), and self-harm (YLLs per 100,000 people, 893). YLLs from these five causes of mortality were 169,337, which accounted for 32.7% of total YLLs. The highest cause of mortality in the total population was self-harm (YLLs per 100,000 people, 573), which was the fifth highest cause of mortality in the population with disabilities. Ischemic heart disease ranked second in the total population and population with disabilities, while ischemic stroke ranked seventh in the total population, but first in the population with disabilities. Chronic kidney disease due to hypertension was the cause of mortality with the greatest difference in rank between the total population and the population with disabilities; from 55th in the total population to 25th in the population with disabilities. Furthermore, epilepsy, brain and nervous system cancers, chronic kidney disease due to diabetes mellitus, and Parkinson's disease demonstrated a large increase in rank in the population with disabilities. In contrast, motorized vehicles with two wheels demonstrated the greatest fall in rank; from 22nd in the total population to 40th in the population with disabilities. Pedestrian injury by road vehicle, leukemia, and breast cancer also demonstrated huge decreases in rank in the population with disabilities (Fig. 2).
 | Fig. 2YLL ranks for the top 25 causes of death for the total population and people with disability in 2012.YLL = years of life lost.
|
In terms of age-specific burden of disease, epilepsy was the greatest cause of YLLs in individuals aged 0–19 years, while self-harm, hemorrhagic and other non-ischemic stroke, and ischemic stroke were the greatest causes of YLLs in individuals aged 20–49 years, 50–59 years, and ≥ 60 years, respectively (Table 3). In the total population, preterm birth complications were the greatest cause of YLLs in individuals aged 0–9 years, while self-harm contributed the most among those aged 10–59 years. Among individuals aged 60–69 years lung cancer was the highest cause of YLLs, and for those over 70 years, ischemic heart disease contributed the most YLLs.10
Table 3
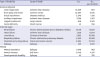
Top cause of death and YLL by age group in individuals with disabilities in 2012
![]()
We also analyzed the burden of disease based on specific types of disabilities. Among individuals with physical disabilities, which account for the highest proportion of disabilities in Korea, ischemic heart disease was associated with the highest YLLs. Furthermore, the most common disabilities in Korea following ischemic heart disease are brain disorders, hearing disabilities, and visual disturbances. Ischemic stroke was associated with the highest YLLs in individuals with brain disorders, while ischemic heart disease and diabetes mellitus were associated with the highest YLLs in individuals with hearing impairments and visual disturbances, respectively. For individuals with intellectual disabilities, the next most frequent disability in Korea, epilepsy caused the highest YLLs. For individuals with mental disabilities, which constitute 3.5% of the population with disabilities, self-harm caused the highest YLLs (Table 4).
Table 4
Top cause of death and YLL by type of disability in 2012
![]()
DISCUSSION
We compared the disease burden of premature death (YLLs) in the population with disabilities and the total population. We also compared the causes of death associated with the highest YLLs for each type of disability. Our findings demonstrate that YLLs in the population with disabilities in 2012 was 517,337, which accounted for 23.4% of YLLs in the total population, and YLLs per 100,000 people were approximately 3.8 times higher in the population with disabilities than in the total population. Self-harm was associated with the highest YLLs in the total population, while ischemic stroke ranked first in the population with disabilities. The burden of disease was highest for ischemic heart disease, followed by hemorrhagic and other non-ischemic stroke, diabetes mellitus, and self-harm. YLLs from these five causes of mortality accounted for 32.7% of total YLLs in the population with disabilities. For diseases associated with the highest YLLs for each type of disability, ischemic heart disease resulted in the highest YLLs in the individuals with physical disabilities, ischemic stroke in individuals with brain disorders, ischemic heart disease in individuals with hearing disabilities, diabetes mellitus in the visually impaired, and epilepsy in individuals with the intellectual disabilities.
In our study, the burden of disease was higher in the population with disabilities than the total population. YLLs per 100,000 people were 16,392 in the population with disabilities, which was approximately four times higher than those in the total population, suggesting that health problems are more significant in individuals with disabilities than in those without. This result was also supported by other studies on individuals with disabilities. According to Hosking et al.,5 mortality was 3.6 times higher in individuals with intellectual disabilities than in the general population in England. Another study also reported that all-cause mortality was three times higher in individuals with disabilities than in the general population.13 Mortality was especially high in younger individuals with disabilities, which according to the literature, is due to an increase in infant mortality or early neonatal death.1415
In this study, mean age of the population with disabilities was higher than that of the population without disabilities; high YLLs in individuals with disabilities may be partially affected by age. However, when we compared YLLs in specific age groups, it remained higher in the age groups with disabilities than in the corresponding general population groups. YLLs per 100,000 people were considerably higher in most age groups of the population with disabilities than in those without. For example, the burden of disease was 3.9 times and three times higher in the 30-year-old group with disabilities and 40-year-old group with disabilities, respectively, while this value increased to 14 times in the 10-year-old group. This is also because mortality and YLLs were lowest in the 10-year-old group in the general population. The only exception for higher YLLs in the group with disabilities was the ≥ 80-year-old group, where YLLs per 100,000 people was lower in the population with disabilities than the general population. This result supports that of a previous study that reported that differences in mortality between the population with and those without disabilities decrease as age increases.16
Cardiovascular diseases and cancer had a higher burden of disease than other disease groups in the population with disabilities; this indicates that overall, non-communicable diseases have a higher burden of disease than communicable diseases or injuries in the population with disabilities. Relative importance was markedly different according to age. For example, neurological disorders were most significant in individuals aged 0–19 years, while self-harm and cardiovascular diseases were more significant in individuals in their 20s and 40s, respectively.
Among individual diseases, epilepsy had highest significance in individuals aged 0–19 years, while stroke was the most significant contributor to YLLs in individuals aged ≥ 50 years. This trend is different from the characteristics observed in the general population, where self-harm was the most significant in individuals aged 10–59 years, which may be due to the diseases present in individuals with physical and developmental disabilities. Another marked difference between the population with disabilities and general population is that YLLs due to cancer were consistently high in all age groups except the 0–9-year-old group in the population with disabilities, but the burden of disease from cancer was concentrated in the older age groups in the general population. Such differences indicate that the characteristics of health problems in individuals with disabilities not only differ from the general population, but also vary among different age groups; therefore, it is necessary to consider age differences when evaluating disease characteristics and intervention policies in individuals with disabilities.
Meanwhile, the ranks of ischemic stroke, ischemic heart disease, and diabetes mellitus were elevated in the population with disabilities, which may be due to their association with underlying diseases in individuals with brain disorders. Similarly, chronic kidney disease from diabetes mellitus (8th) and epilepsy (16th) ranked high, which also may be associated with individuals with kidney impairments and intellectual disabilities. On the other hand, traffic accident-related diseases, such as those involving motorized vehicles with ≥ 3 wheels and pedestrian injuries by road vehicles, in addition to suicide, were lower in the individuals with disabilities than those without. Nevertheless, the absolute values of YLLs in most disease groups, including the abovementioned disease groups, were high in the individuals with disabilities. For example, YLLs per 100,000 people due to self-harm were 893 in the population with disabilities, higher than those in total population (573), alluding to the seriousness of the burden of disease among the individuals with disabilities.
For cause of mortality with each type of disability, ischemic stroke was found to be the leading cause of mortality in individuals with brain disorders, and underlying diseases causing disability were also the leading cause of mortality in people with visual disturbance and epilepsy. Meanwhile, self-harm, including suicide, was the leading cause of mortality in individuals with intellectual disabilities. This was similar to previous findings, where history of mental illnesses, such as depression, bipolar disorder, schizophrenia, and personality disorder, were greatest risk factors for suicide and where risk of suicide was 3–12 times higher in individuals with mental disabilities than in the general population.1617181920212223 Similarly, we noted that YLLs from suicide were highest for people with mental illnesses.
For people with physical disabilities or hearing impairments, YLLs from ischemic heart disease were higher than those from underlying diseases. This alludes to the poor health management of the individuals with disabilities, necessitating better chronic disease management for such patients. Our findings demonstrated that diseases associated with high YLLs varied with the type of disability, calling for differential health promotion policies according to the type of disability.
Death is a meaningful indicator of the burden of disease.1024 It is also an important indicator of burden of disease in people with disabilities. For example, the number of registered people with disabilities in a given year is calculated by adding the number of new registrations to and subtracting the number of exclusions from the previous year's registration. Thus, the number of people with disabilities is determined by the number of new registrations and exclusions in a given year. Death accounts for the highest proportion of exclusions. Since death accounted for 85.4% of exclusions from the Korea disability registration system in 2014, the number of mortalities greatly influences the size of the population with disabilities. The mortality rate in the individuals with disabilities in Korea is on the rise, increasing from 2.16% in 2004 to 2.82% in 2014, which emphasizes the urgency of reducing the disease burden of premature death in individuals with disabilities to improve their health.
This study has a few limitations. First, we measured the burden of disease for people with disabilities based on YLLs. According to the burden of disease study in Koreans by Yoon et al.,9 years lived with disability (YLDs) and YLLs were analyzed and accounted for 88.7% and 11.3% of the total DALYs in 2012, respectively. Since a significant proportion of DALYs account for YLDs, future studies should also calculate YLDs for people with disabilities. Second, this study only examined those who were registered in the disability registration system and not the entire population with disabilities. However, in Korea, individuals with disabilities who are issued disability certificates from healthcare institutions and who register as those having disabilities are entitled to disability pensions, tax exemption, and medical cost reimbursements, as stipulated by the Welfare Law for the Disabled. The 2014 disability survey revealed that approximately 91.7% of the estimated population with disabilities (as of December 2013) has been registered in the disability system.25 The Korean disability registration data encompasses data from the majority of the population with disabilities.
The burden of disease related to premature death in people with disabilities is larger than that in the general population. This means that the health status of persons with disabilities is disadvantageous compared to the general population. This can be interpreted as the difference in health behaviors such as high smoking rates of the people with disabilities and the difficulty in using medical services like low primary care access. Therefore, in order to improve the health status of people with disabilities, it is necessary to improve accessibility to the system and the introduction of health promotion policies in accordance with the characteristics of persons with disabilities. As shown in this study, since the diseases with high YLL varied according to the type of disability, it is necessary to approach the policy for health promotion and prevention according to the type of disability. For people with disabilities, it is especially necessary to utilize services such as remote monitoring and home healthcare using information and communicating technology, as communication can be difficult or uncomfortable.
It is not known exactly how the risk factors such as smoking and drinking influence YLL. Therefore, future studies should focus on population attributable fractions according to risk factors in the population with disabilities group to better understand the effects of other risk factors on YLL.
 XML Download