

 PDF
PDF ePub
ePub Citation
 Print
Print


INTRODUCTION
Atrial fibrillation (AF) is the most common cardiac arrhythmia and catheter ablation of AF has become a standard treatment option for maintaining sinus rhythm.1) Three-dimensional (3D) electroanatomic systems can facilitate ablation procedures of AF by visualization of the left atrium (LA) and ablation catheters, which lead to the reduction of fluoroscopy and procedure time.2) However, these procedures still require radiation exposure for intracardiac catheter manipulation because of the complexity of the LA anatomy and ablation procedure.
Recently, a sensor-based electromagnetic catheter tracking system (MediGuide™; St. Jude Medical, Minnetonka, MN, USA) has been introduced that is capable of non-fluoroscopic navigation of sensor-enabled tools in the pre-recorded 2-dimensional X-ray images. Some reports have shown a significant reduction in fluoroscopy time and radiation dose using this technology.3)4) In addition, this system (MediGuide™) can offer electromagnetic catheter localization to the EnSite Velocity™ system (St. Jude Medical), which is impedance-based electric catheter localization. It was reported that electromagnetic field technology showed a higher accuracy of catheter localization than impedance-based electric field technology in a phantom model.5)6) Therefore, the accuracy of cardiac anatomy in non-fluoroscopically magnetic-based mapping (MediGuide technology) may be superior to those in conventional impedance-based mapping. However, the accuracy and applicability of this technology have not been fully studied in the clinical practice. This study aimed to investigate the anatomical accuracy, the procedure and the fluoroscopy time in non-fluoroscopically electromagnetic-scaled mapping system for pulmonary veins (PVs) isolation and cavo-tricuspid isthmus (CTI) ablation in patients with paroxysmal AF.
METHODS
Study population
A total of 55 patients (39 males, mean age 57±8 years) with drug-refractory symptomatic paroxysmal AF were enrolled from 2015 to 2016. A total of 15 consecutive patients (MediGuide group) who received radiofrequency catheter ablation for the first time under the guidance of a MediGuide™ mapping system were studied. A control group of 40 age- and sex-matched patients (Conventional group) who received radiofrequency catheter ablation for the first time under the guidance of an EnSite Velocity™ mapping system were also investigated. Catheter ablation was performed in MediGuide group and Conventional group during the same period. All patients received circumferential PVs isolation and CTI ablation. Ethical approval was granted by the Institutional Review Board (IRB) of the Veterans General Hospital, Taipei, Taiwan (IRB No. 2017-03-001AC). All subjects gave written informed consent.
Cardiac computed tomography imaging
The LA and PVs were evaluated with an electrocardiographically gated, 64-slice multidetector computed tomography (CT) scanner (Aquilion 64 CFX; Toshiba Medical System, Tokyo, Japan) before catheter ablation. All patients underwent contrast-enhanced CT scanning during sinus rhythm. The mean duration from CT scan to ablation procedure was 1.8±1.5 days. There was no significant difference between the MediGuide group (2.1±1.2 days) and the Conventional group (1.8±1.6 days). The detailed protocol and analysis of cardiac CT imaging have been described before.7) In brief, the patients were instructed to hold their breath to acquire the images, which covered an area from the superior margin of the pulmonary hilum to the cardiac apex (collimation 64×0.5 mm, gantry rotation time 350 ms, table speed 6.3 mm/rotation, tube voltage 120 kV, and effective tube current 545 mA). The acquisition time was 8 to 12 seconds depending on the heart rate. The LA and PVs were segmented and reconstructed in 3D from CT slices using EnSite Verismo™ software (St. Jude Medical). We excluded the patients with PV anatomical variants (ex: common PV ostium or existence of middle PV) from this study. The CT reconstruction was not fused in Velocity™ system during ablation procedure in all patients.
MediGuide technology
The MediGuide technology has been previously described.3)4) Briefly, this system is comprised of a transmitter unit generating a low-powered electromagnetic field and a miniaturized single-coil sensor (<1 mm3) contained in the distal end of a specialized catheter such as diagnostic catheter and ablation catheter. The transmitter unit is installed in the fluoroscopy detector of a conventional X-ray imaging system (Siemens Artis, Erlangen, Germany) and can provide real-time 3D electromagnetic catheter localization. At the beginning of the ablation procedure, 2 short fluoroscopy loops (3 seconds each) are acquired. The position and orientation of catheter tips are non-fluoroscopically visualized on the previously acquired fluoroscopic images. A reference sensor fixed on the patient's chest and a real-time electrocardiogram (ECG) signal allows compensation for cardiac and respiratory motions or patient movement. The mapping data of this system are linked to EnSite Velocity™, which can offer electromagnetic scaled-data to impedance scaled-data.
Electrophysiological study
Before the electrophysiological study and radiofrequency catheter ablation, antiarrhythmic agents were ceased for a minimum of 5 half-lives (except for amiodarone), and transesophageal echocardiography was performed to exclude any LA thrombi and evaluate cardiac anatomy. A standardized electrophysiology study was performed for all patients in the fasting state without sedation and local anesthesia was given during the procedure for pain relief. The surface electrocardiogram and bipolar intracardiac electrogram were stored on a digital recording system (LabSystem PRO™; Bard Electrophysiology, Lowell, MA, USA). In MediGuide group, the catheters utilized for mapping were the following: 1) A sensor-equipped decapolar electrophysiology catheter (MediGuide-Enabled Livewire™; St. Jude Medical), 2) a multipolar circular mapping catheter (Inquiry™ Afocus™ II; St. Jude Medical), and 3) a 4-mm open-irrigated tip catheter (CoolPath™ DUO MediGuide-enabled; St. Jude Medical). The sensor-equipped decapolar catheter was advanced into the heart from the right jugular vein, tracked, and visualized on the pre-recorded cine loop (right anterior oblique 30 degree and left anterior oblique 60 degree). The catheters were non-fluoroscopically inserted into coronary sinus on the dynamic models. In the Conventional group, the catheters utilized for mapping were the following: 1) A conventional decapolar electrophysiology catheter (RESPONSE™; St. Jude Medical) inserted from the right jugular vein to the coronary sinus, 2) a multipolar circular mapping catheter (Inquiry™ Afocus™ II), and 3) a 4-mm open-irrigated tip catheter (FlexAbility™; St. Jude Medical).
Creation of 3-dimensional geometry
Before a transseptal approach for LA access and isolation of PVs, right atrial angiography and esophagography were simultaneouly performed to delineate the location of both atria and esophagus. After that, a transseptal puncture by modified Brockenbrough technique (BRK™ Transseptal needle; St. Jude Medical) was performed using fluoroscopic landmarks, and an 8.5F long vascular sheath (St. Jude Medical) was introduced into the LA. The coronary sinus catheter was used as a positional reference for the 3D mapping system. In the MediGuide group, the sensor-equipped ablation catheter was carefully used to define PV branches and PV ostia and create the outline of LA body on the pre-recorded cine loop. These mapping data were integrated with the EnSite Velocity™ system. Additional mapping points were collected using the multipolar circular mapping catheter on the Ensite Velocity™ screen and the original geometry of LA was completed (Figure 1). In the Conventional group, the Ensite Velocity™ with the multipolar circular mapping catheter was used to create the outline of the LA body and the PVs under fluoroscopic guidance. Additional mapping points were collected using the ablation catheter and the original geometry of LA was completed (Figure 2). After the creation of the original LA geometry, a field scaling algorithm was applied to the original geometry. This field scaling adjusts for the non-linearity of the geometry and compensates for the distortion of the geometry.8) In the present study, 3D geometry of LA was created based on the same impedance field scaling algorithm in both groups.
Figure 1
The creation of 3D geometry of the LA using MediGuide™ system. Upper panel shows original LA geometry. After the creation of the original LA geometry, a field scaling algorithm is applied to the original geometry. Lower left panel shows the impedance field scaled geometry (M-IM-GEO). Lower middle panel shows the electromagnetic field scaled geometry (M-EM-GEO). Lower right panel shows the CT-based geometry. To evaluate the anatomical accuracy, pulmonary vein angles (①-④), posterior LA surface area (⑤) and anterior-posterior diameter of the LA (⑥) were measured in each geometry.
3D = 3-dimensional; CT = computed tomography; LA = left atrium; M-EM-GEO = MediGuide group, electromagnetic field-scaled geometry; M-IM-GEO = MediGuide group, impedance field-scaled geometry.
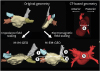
Figure 2
The creation of 3D geometry of the LA) using Ensite Velocity™ system. Upper panel shows original LA geometry. After the creation of the original LA geometry, a field scaling algorithm is applied to the original geometry. Lower left panel shows the impedance field scaled geometry (C-IM-GEO). Lower right panel shows the CT based geometry.
3D = 3-dimensional; C-IM-GEO = conventional group, the impedance field-scaled geometry; CT = computed tomography; LA = left atrium.
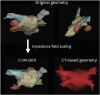
In the MediGuide group, the electromagnetic field-scaled and impedance field-scaled geometries (M-EM-GEO and M-IM-GEO) were created as shown in Figure 1. In the Conventional group, the impedance field-scaled geometry (C-IM-GEO) was created as shown in Figure 2. To evaluate the accuracy of cardiac anatomy between magnetic-based geometry and impedance-based geometry in MediGuide technology, M-EM-GEO, and M-IM-GEO were compared. In addition, to validate the superiority of non-fluoroscopic magnetic-based mapping compared with the conventional impedance-based mapping, M-EM-GEO and C-IM-GEO were also compared.
The assessment of anatomical accuracy of left atrium
The measurement of PV angles has been previously described.9) In brief, the longitudinal axis of the LA was defined as the line between the center points of the ipsilateral PVs. Right superior pulmonary vein (RSPV), right inferior pulmonary vein (RIPV), left superior pulmonary vein (LSPV), and left inferior pulmonary vein (LIPV) angles were measured between the main trunk of each PV and the longitudinal axis of the LA (Figure 1, ①–④). Additionally, we measured the posterior LA surface area, which was defined as the area encircled with the posterior PV-LA junction, roof line and floor line (Figure 1, ⑤). In the present study, anterior LA points were not used for the evaluation of accuracy because of the inherent mobility of this structure. We calculated the actual change {(EM-GEO or IM-GEO)−CT-based geometry} and the relative change (actual change)/(CT-based geometry) of 4 PV angles and the posterior LA surface area in each field scaled geometry, compared to those of CT-based geometry. Cardiac CT has been considered as a gold standard for assessment of the anatomy of the LA.
In the present study, to assess spatial accuracy of the electromagnetic and impedance field scaling, the anterior-posterior diameter of the LA was also measured as the distance between the central part of the posterior wall to the central part of anterior part in MediGuide group (Figure 1, ⑥).
Ablation procedure
After the creation of the 3D geometry of the LA, continuous circumferential lesions were created to encircle the right and left PV ostia. When the patients experienced intolerable pain during the ablation procedure, they received local anesthesia and/or mild sedation with midazolam and fentanyl for pain relief. In the MediGuide group, the sensor-equipped ablation was visualized on the pre-recorded cine loop. The mapping and ablation data were integrated with the EnSite Velocity™ System and non-fluoroscopic PV isolation was performed. In the Conventional group, PV isolation was performed using the EnSite Velocity™ system under fluoroscopic guidance. All procedures were performed by well-experienced operators (cumulative AF case number >400). The method of PV isolation has been previously described in our previous publications.10)11) Radiofrequency energy was continuously applied using an irrigated tip ablation catheter while repositioning the catheter tip every 40 seconds. The standard ablation setting consisted of a power of 25–30 W, and irrigation flow rate of 30 mL/min. When a radiofrequency energy delivery to the posterior wall near the esophagus was necessary, power delivery was reduced to 20–25 W. After completion of the circumferential lesion set, the ipsilateral superior and inferior PVs were mapped carefully by the multipolar circular mapping catheter. Additional ablation applications were applied along the circumferential lines close to the earliest ipsilateral PV potentials. Furthermore, ablation of the residual PV potentials was performed using the electrogram-guided approach to obtain entrance block. Successful circumferential PV isolation was demonstrated by the absence of any electrical activity inside the PV or dissociation of the PV potentials (entrance and/or exit blocks). In all procedures, fluoroscopy and procedure times (from transseptal puncture to the completion of ablation) were measured.
The standard ablation setting in CTI ablation consisted of a power of 40 W, and irrigation flow rate of 30 mL/min. In the MediGuide group, CTI ablation was performed under the pre-recorded cine loop guidance. In the Conventional group, CTI ablation was performed under fluoroscopy guidance. Bi-directional isthmus block was defined as the endpoint of the ablation procedure. In all procedures, fluoroscopic and procedure times were measured.
Clinical follow-up
Patients were followed up in the cardiology outpatient clinic with 12-lead ECGs and 24-hour Holter monitoring (2 weeks after the catheter ablation, then every 1–3 months). Antiarrhythmic drugs were prescribed for 8 weeks to prevent the early recurrence of paroxysmal AF. For patients who could not come for outpatient follow-up in our institution, they were followed up by the referring physicians and also contacted over telephone for recurrent symptoms and recurrent arrhythmias. These patients were also advised to complete follow-up screening and the medical reports were obtained from these referring physicians. Arrhythmia recurrence after ablation followed Heart Rhythm Society/European Heart Rhythm Association/European Cardiac Arrhythmia Society guidelines.12) Recurrence was defined as any office ECG demonstrating AF or atrial tachycardia, or any episode of AF or atrial tachycardia >30 seconds on 24-hour Holter monitoring after a 90-day blanking period.
Statistical analysis
Continuous data were reported as mean values ± standard deviation. Categorical data were reported as absolute values and percentages. Numerical variables were compared by the Mann-Whitney U test. Categorical data were compared by the χ2 test or Fisher's exact test. The p<0.05 was considered to indicate statistical significance. Single-measure intraclass correlation coefficients (ICCs) and associated 95% confidence intervals (CIs) were estimated using a 2-factor random effect model to estimate the test-retest reliability of electromagnetic- and impedance-scaled geometry and CT-based geometry. ICC in the range 0 to 0.20 is slight reliability, 0.21 to 0.40 is fair reliability, 0.41 to 0.80 is moderate reliability, and 0.81 to 1.00 is good reliability.13) Event-free rate for arrhythmia recurrence was evaluated with the Kaplan-Meier method, and analyzed by a log-rank test. The analysis was performed by a senior biostatistician using SPSS statistical software (version 22.0; SPSS Institute, Chicago, IL, USA).
RESULTS
Clinical characteristics of study subjects
The baseline clinical characteristics of the study subjects are shown in Table 1. There were no statistically significant differences between the 2 groups in age, gender, body mass index, or in the presence of hypertension, diabetes mellitus, or coronary artery disease. The LA dimension and left ventricular ejection fraction based on the echocardiographic findings, and the baseline medical therapy were not different between the 2 groups. In addition, the 4 PV angles and the posterior LA surface area measured from CT image were similar between the 2 groups.
Table 1
Clinical characteristics between 2 groups

Values are presented as mean±standard deviation or number of patients (%).
BMI = body mass index; CAD = coronary artery disease; CT = computed tomography; DM = diabetes mellitus; HT = hypertension; LA = left atrium; LAD = left atrial diameter; LVEF = left ventricular ejection fraction; PV = pulmonary vein.
The anatomical accuracy between electromagnetic- and impedance-based mapping systems
The study data of the PV angles and posterior LA surface area are shown in Table 2 and Table 3. The PV angles and posterior LA surface area were measured in MediGuide group (M-EM-GEO and M-IM-GEO) and Conventional group (C-IM-GEO). The actual change and the relative change of 4 PV angles and the posterior LA surface area in each field-scaled geometry were calculated, compared to those of CT-based geometry. The actual change and the relative change of all PV angles and posterior LA surface area were significantly smaller in M-EM-GEO than those data in M-IM-GEO and C-IM-GEO. However, the actual change and the relative change of all PV angles and posterior LA surface area were similar between the two groups. Table 4 shows ICC and associated 95% CI between EM- or IM-GEO and CT-based geometry. ICCs of all PV angles and posterior LA surface area in M-EM-GEO demonstrated “good reliability”. In contrast to M-EM-GEO, ICCs of all PV angles and posterior LA surface area in M-IM-GEO and C-IM-GEO demonstrated “moderate reliability”.
Table 2
Study data of PV angles

Table 3
Study data of posterior LA surface area

Table 4
Reliability of PV angles and posterior LA surface area

In the MediGuide group, the actual change and the relative change of the anterior-posterior diameter of the LA were significantly smaller in M-EM-GEO than those data in M-IM-GEO (actual change, 3.3±2.1 vs. 7.8±4.7 mm; relative change, 9.3±5.5 vs. 22.3±11.3%; p<0.05 and p<0.01), respectively. ICC and associate 95% CI between M-EM-GEO and CT-based geometry were 0.934 and 0.775–0.982, respectively. On the other hand, the ICC and associated 95% CI between M-IM-GEO and CT-based geometry were 0.755 and 0.318–0.482, respectively.
Ablation procedure
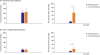
Successful circumferential PVs isolation and CTI ablation were achieved in all patients (100%). Although the procedure time of PVs isolation and CTI ablation were similar between the 2 groups, the fluoroscopy time was significantly shorter in MediGuide group compared to Conventional group (Figure 3A and B).
Figure 3
Comparison of procedure and fluoroscopy times between MediGuide and Conventional groups. (A) Comparison of pulmonary veins isolation between the 2 groups. Left panel: procedure time and right panel: fluoroscopy time. (B) Comparison of cavo-tricuspid isthmus ablation between the 2 groups. Left panel: procedure time and right panel: fluoroscopy time.
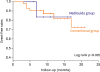
Arrhythmia recurrence was observed in 10 patients (18%) during a follow-up of 12.2±4.5 months. There was no difference in arrhythmia recurrence between MediGuide group (13%) and Conventional group (20%). In the Kaplan-Meier analysis, the event-free for arrhythmia recurrence did not differ between the two groups as shown in Figure 4. During the ablation procedure and the follow-up period, the procedure related complications (e.g., death, pericardial effusions, strokes, PVs stenosis, esophageal injury, phrenic nerve palsy, and vascular access complications) were not observed in each group.
DISCUSSION
The main findings of this study are: 1) When compared to CT-based geometry, the actual change and the relative change of all PV angles, posterior LA surface area and anterior-posterior diameter of the LA were significantly smaller in electromagnetic field-scaled geometry than those in impedance field-scaled geometry. 2) ICCs of all PV angles, posterior LA surface area and anterior-posterior diameter of the LA between electromagnetic field scaled geometry and CT-based geometry demonstrated “good reliability”. 3) Although the procedure time of PVs isolation and CTI ablation was similar between MediGuide group and Conventional group, the fluoroscopy time was significantly shorter in MediGuide group compared to Conventional group. Our results suggest that image integration with electromagnetic field technology enables high accurate visualization of cardiac anatomy and allows us to reduce the fluoroscopy time for catheter ablation procedure without prolongation of procedure time.
PV isolation is the current standard therapy in patients who suffer from drug refractory AF.1) The 3D electroanatomic systems can support ablation procedures by visualizing the LA anatomy.2) Although both electromagnetic- and impedance-scaled mapping systems can provide accurate anatomical information, Bourier et al.5)6) reported that electromagnetic field technology showed a higher accuracy of catheter localization than impedance-based electric field technology in a phantom model. In their study, the authors stated that unlike impedance-based electric field technology, electromagnetic field technology for catheter localization was not influenced by the different types of tissue or cardiac anatomy. In the clinical practice, different respiration patterns and cardiac motion may also influence the localization accuracy of the 3D electroanatomic systems. However, the MediGuide technology may provide a higher accurate visualization of cardiac anatomy and catheter localization compared to Ensite Velocity™ because this system automatically adjusts for changes in heart rate, respiratory motion and patient movement.14) In the present study, PV angles and posterior LA surface area were measured to evaluate the anatomical accuracy of 3D electroanatomic systems. Although the anatomies of the PV and LA are different in the individual patients, current imaging modalities can show detailed and complete imaging of them.7)9) In addition, posterior LA wall is more fixed area compared to other LA walls and it is not influenced by different fluid status or different stretch.9)15) As a result, the electromagnetic field technology showed a higher anatomical accuracy than the impedance based electric field technology.
In the patients with paroxysmal AF, we demonstrated that the fluoroscopy time for both PVs isolation and CTI ablation were significantly shorter in the MediGuide group compared to Conventional group, but the procedure time was similar between the 2 groups. These findings are consistent with previously published results.3)4) In some AF patients including persistent and long standing persistent AF, accurate evaluation of arrhythmogenic substrates is required and adjunctive substrate modification is performed to improve clinical outcomes. Therefore, complex AF ablation leads to prolongation of procedural and fluoroscopic times. In the present study, the anterior-posterior diameter of the LA was measured to assess the spatial accuracy of electromagnetic and impedance field scaling. Our findings demonstrated that the electromagnetic field scaling might have the superiority of spatial accuracy compared to the impedance field scaling. Therefore, the MediGuide technology may facilitate complex catheter ablation procedure and increase procedural safety because this system enables high accurate visualization of cardiac anatomy and allows us to reduce fluoroscopy time without prolongation of procedure time.
While the use of X-ray imaging and complicated intervention procedure are growing, the carcinogenic side-effects of this imaging are clinically significant problems for both medical staff and patients being exposed to radiation.16) Furthermore, in complex ablation procedure, more mapping points and longer procedure time are required to create a higher accurate geometry and achieve higher success rate. The position and orientation of catheter tips in MediGuide technology are non-fluoroscopically visualized on the previously recorded fluoroscopic cine loops. Therefore, additional radiation exposure is limited to complete complex ablation procedure. In the present study, for the first time, we demonstrated the efficacy of MediGuide technology for higher accurate visualization of cardiac anatomy through nonfluoroscopic catheter ablation procedure for the patients with paroxysmal AF. This technology allows us to perform catheter ablation procedure safely and reduce radiation exposure without prolongation of procedure time and inferiority of ablation efficacy.
There were some limitations in our study. First, the results of this study were based on a non-randomized comparison from relatively small samples. Therefore, large study samples may be required to validate our findings. It has been previously demonstrated that 5 to 25 procedures are needed to optimize MediGuide™ technology and reduce fluoroscopy time.4)17) In the present study, the MediGuide group includes first 15 procedures in our hospital. Despite this, we still found that cardiac anatomy was more accurate in electromagnetic field scaled geometry, when compared to impedance field scaled geometry. Second, sample size was different between MediGuide and Conventional groups. However, age and sex were matched and baseline characteristics of 2 groups were similar. Third, in the present study, fluoroscopy time was measured to assess radiation exposure, but information on radiation dose related to CT and ablation procedure was not provided. However, fluoroscopy time can be measured easily and it is considered to be an indicator of radiation exposure for both medical staff and patients during catheter procedure.18) Finally, the study results were a comparison between MediGuide™ and Ensite Velocity™ version 4.0 mapping systems. The new version of the Ensite Velocity™ version 5.0 (Precision™ 2.0) mapping system may be more accurate than the old version. However, Precision™ mapping system is impedance plus magnetic mapping. In the present study, we aimed to compare anatomical accuracy between impedance-based mapping and magnetic-based mapping. Therefore, we used the data from Velocity™ mapping.
MediGude™ technology enables high accurate visualization of cardiac anatomy and a dramatic reduction in fluoroscopy time. In addition, this technology might be noninferior to conventional impedance based electric field technology regarding efficacy and safety of catheter ablation for patients with paroxysmal AF.
 XML Download