Abstract
Purpose
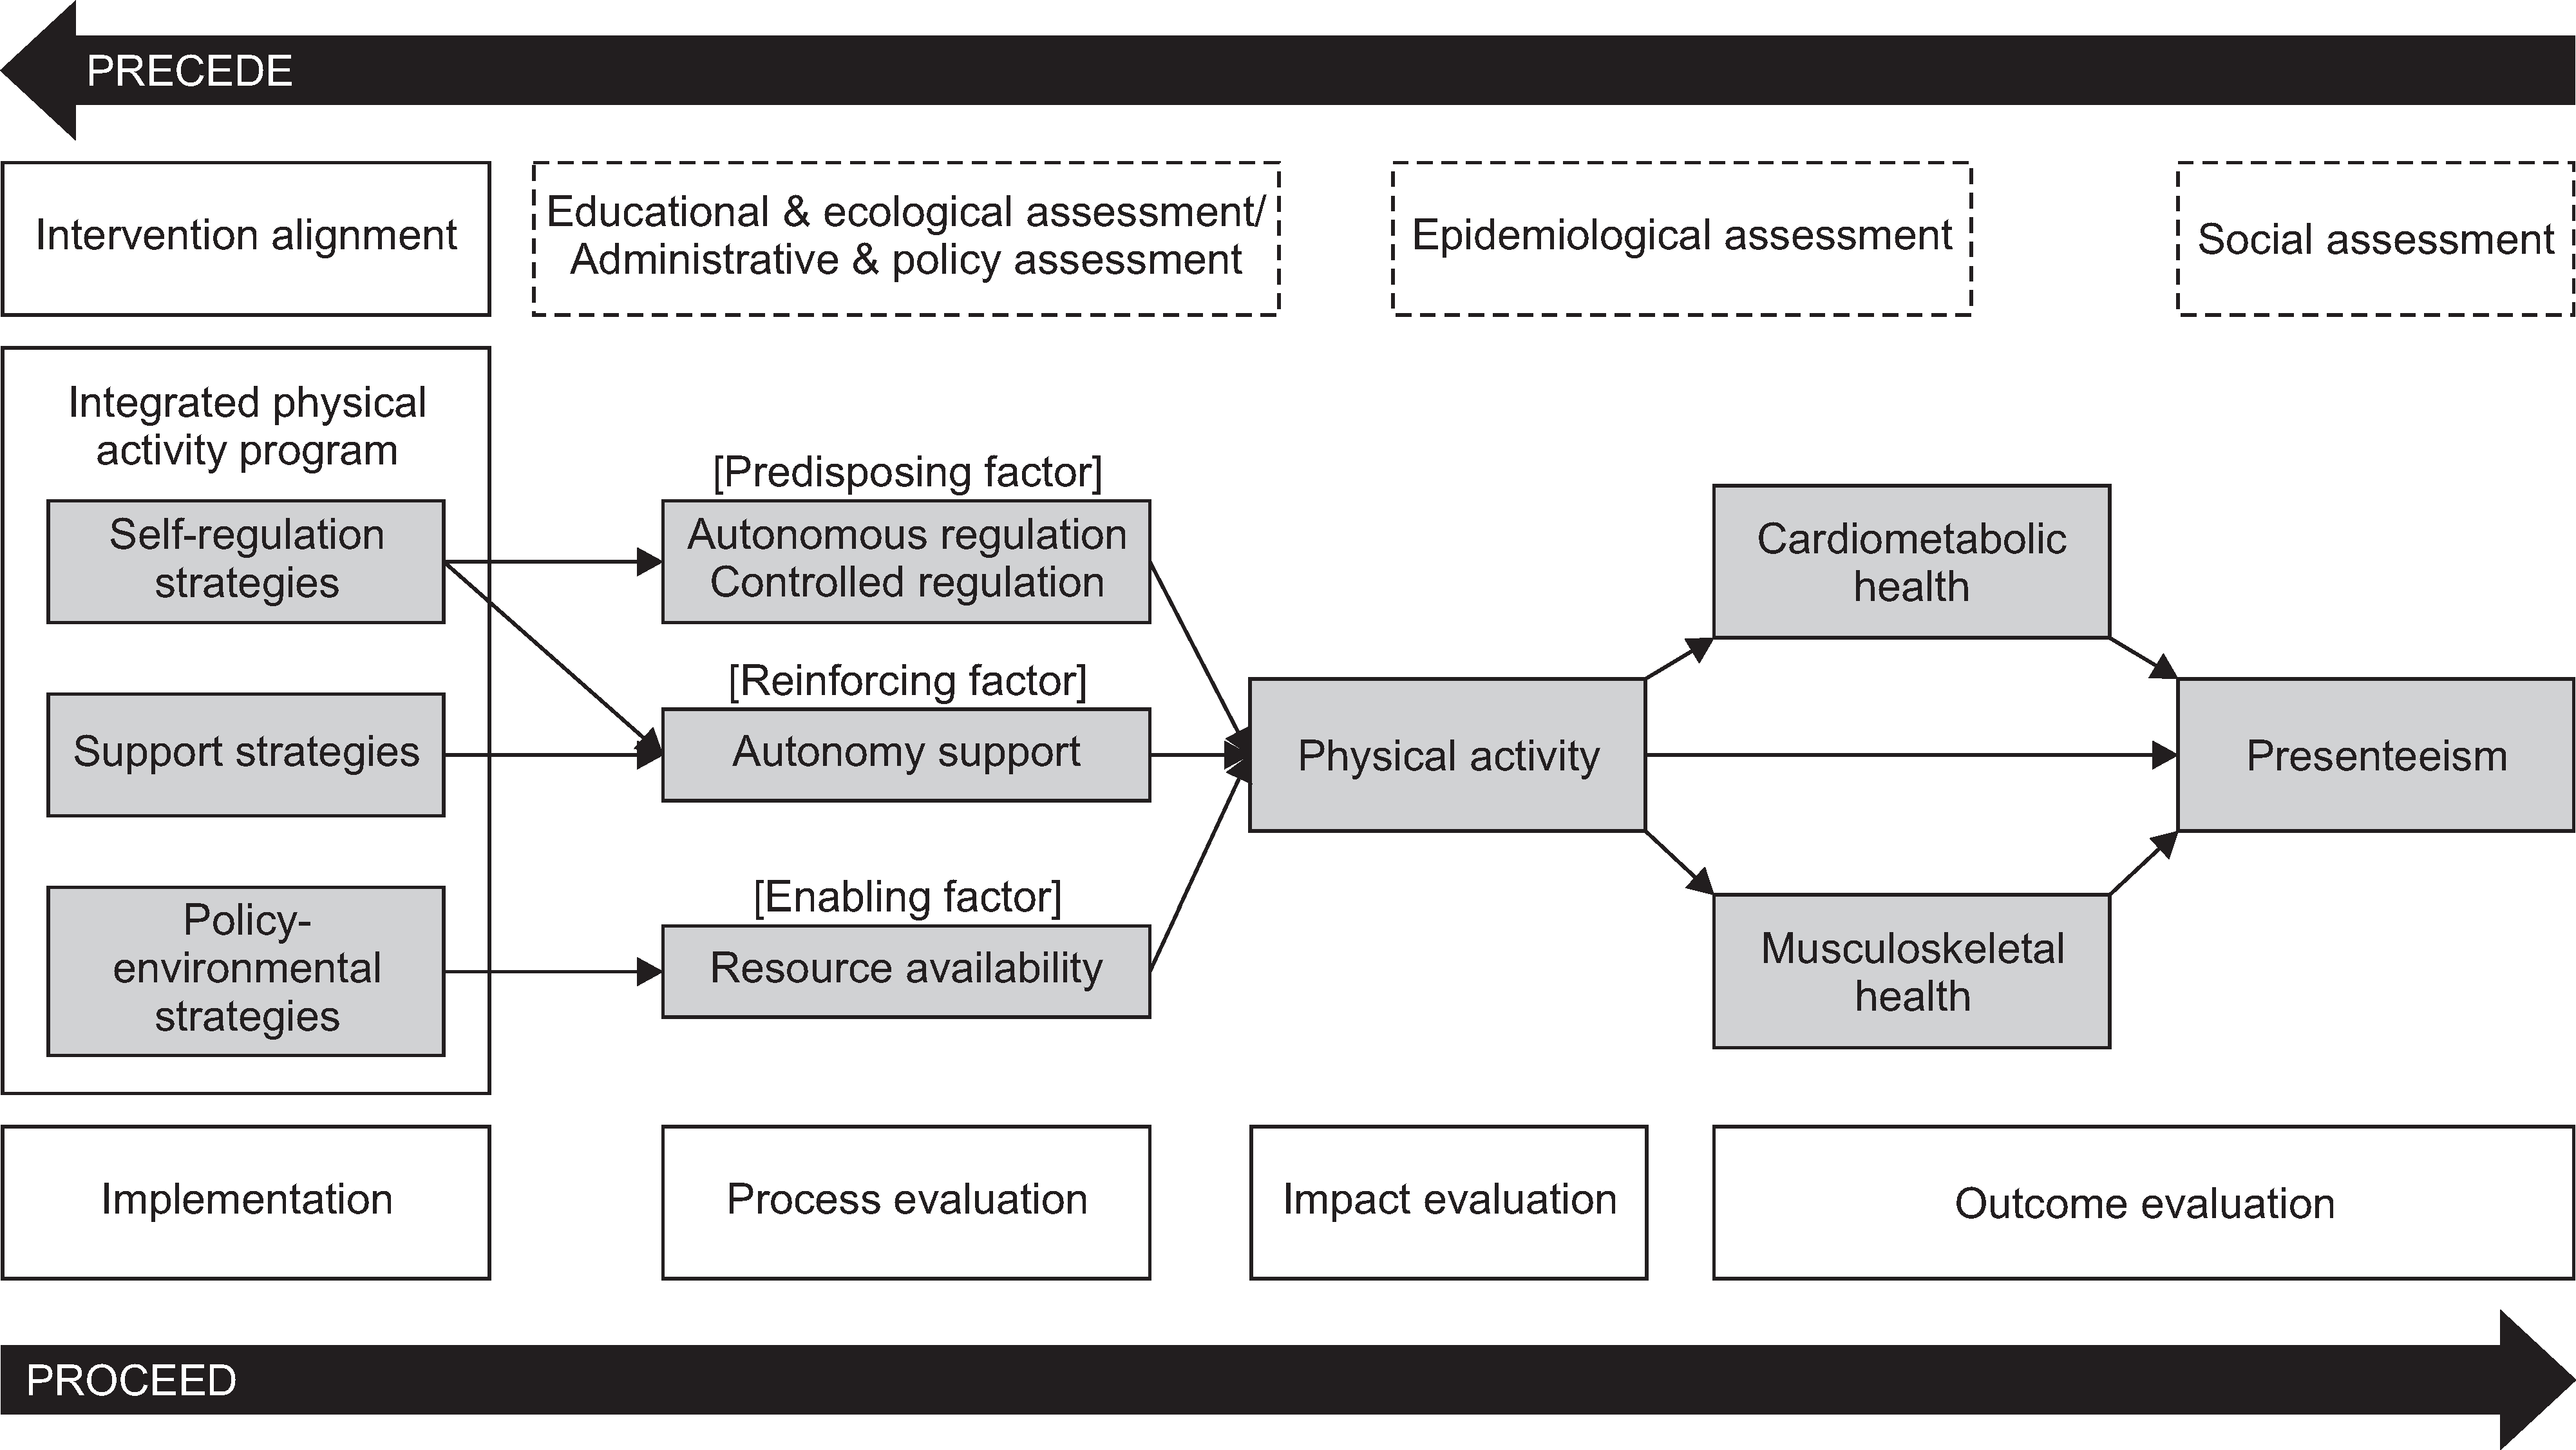
We aimed to examine the effects of an integrated physical activity (PA) program developed for physically inactive workers on the theoretical basis of the PRECEDE-PROCEED model.
Methods
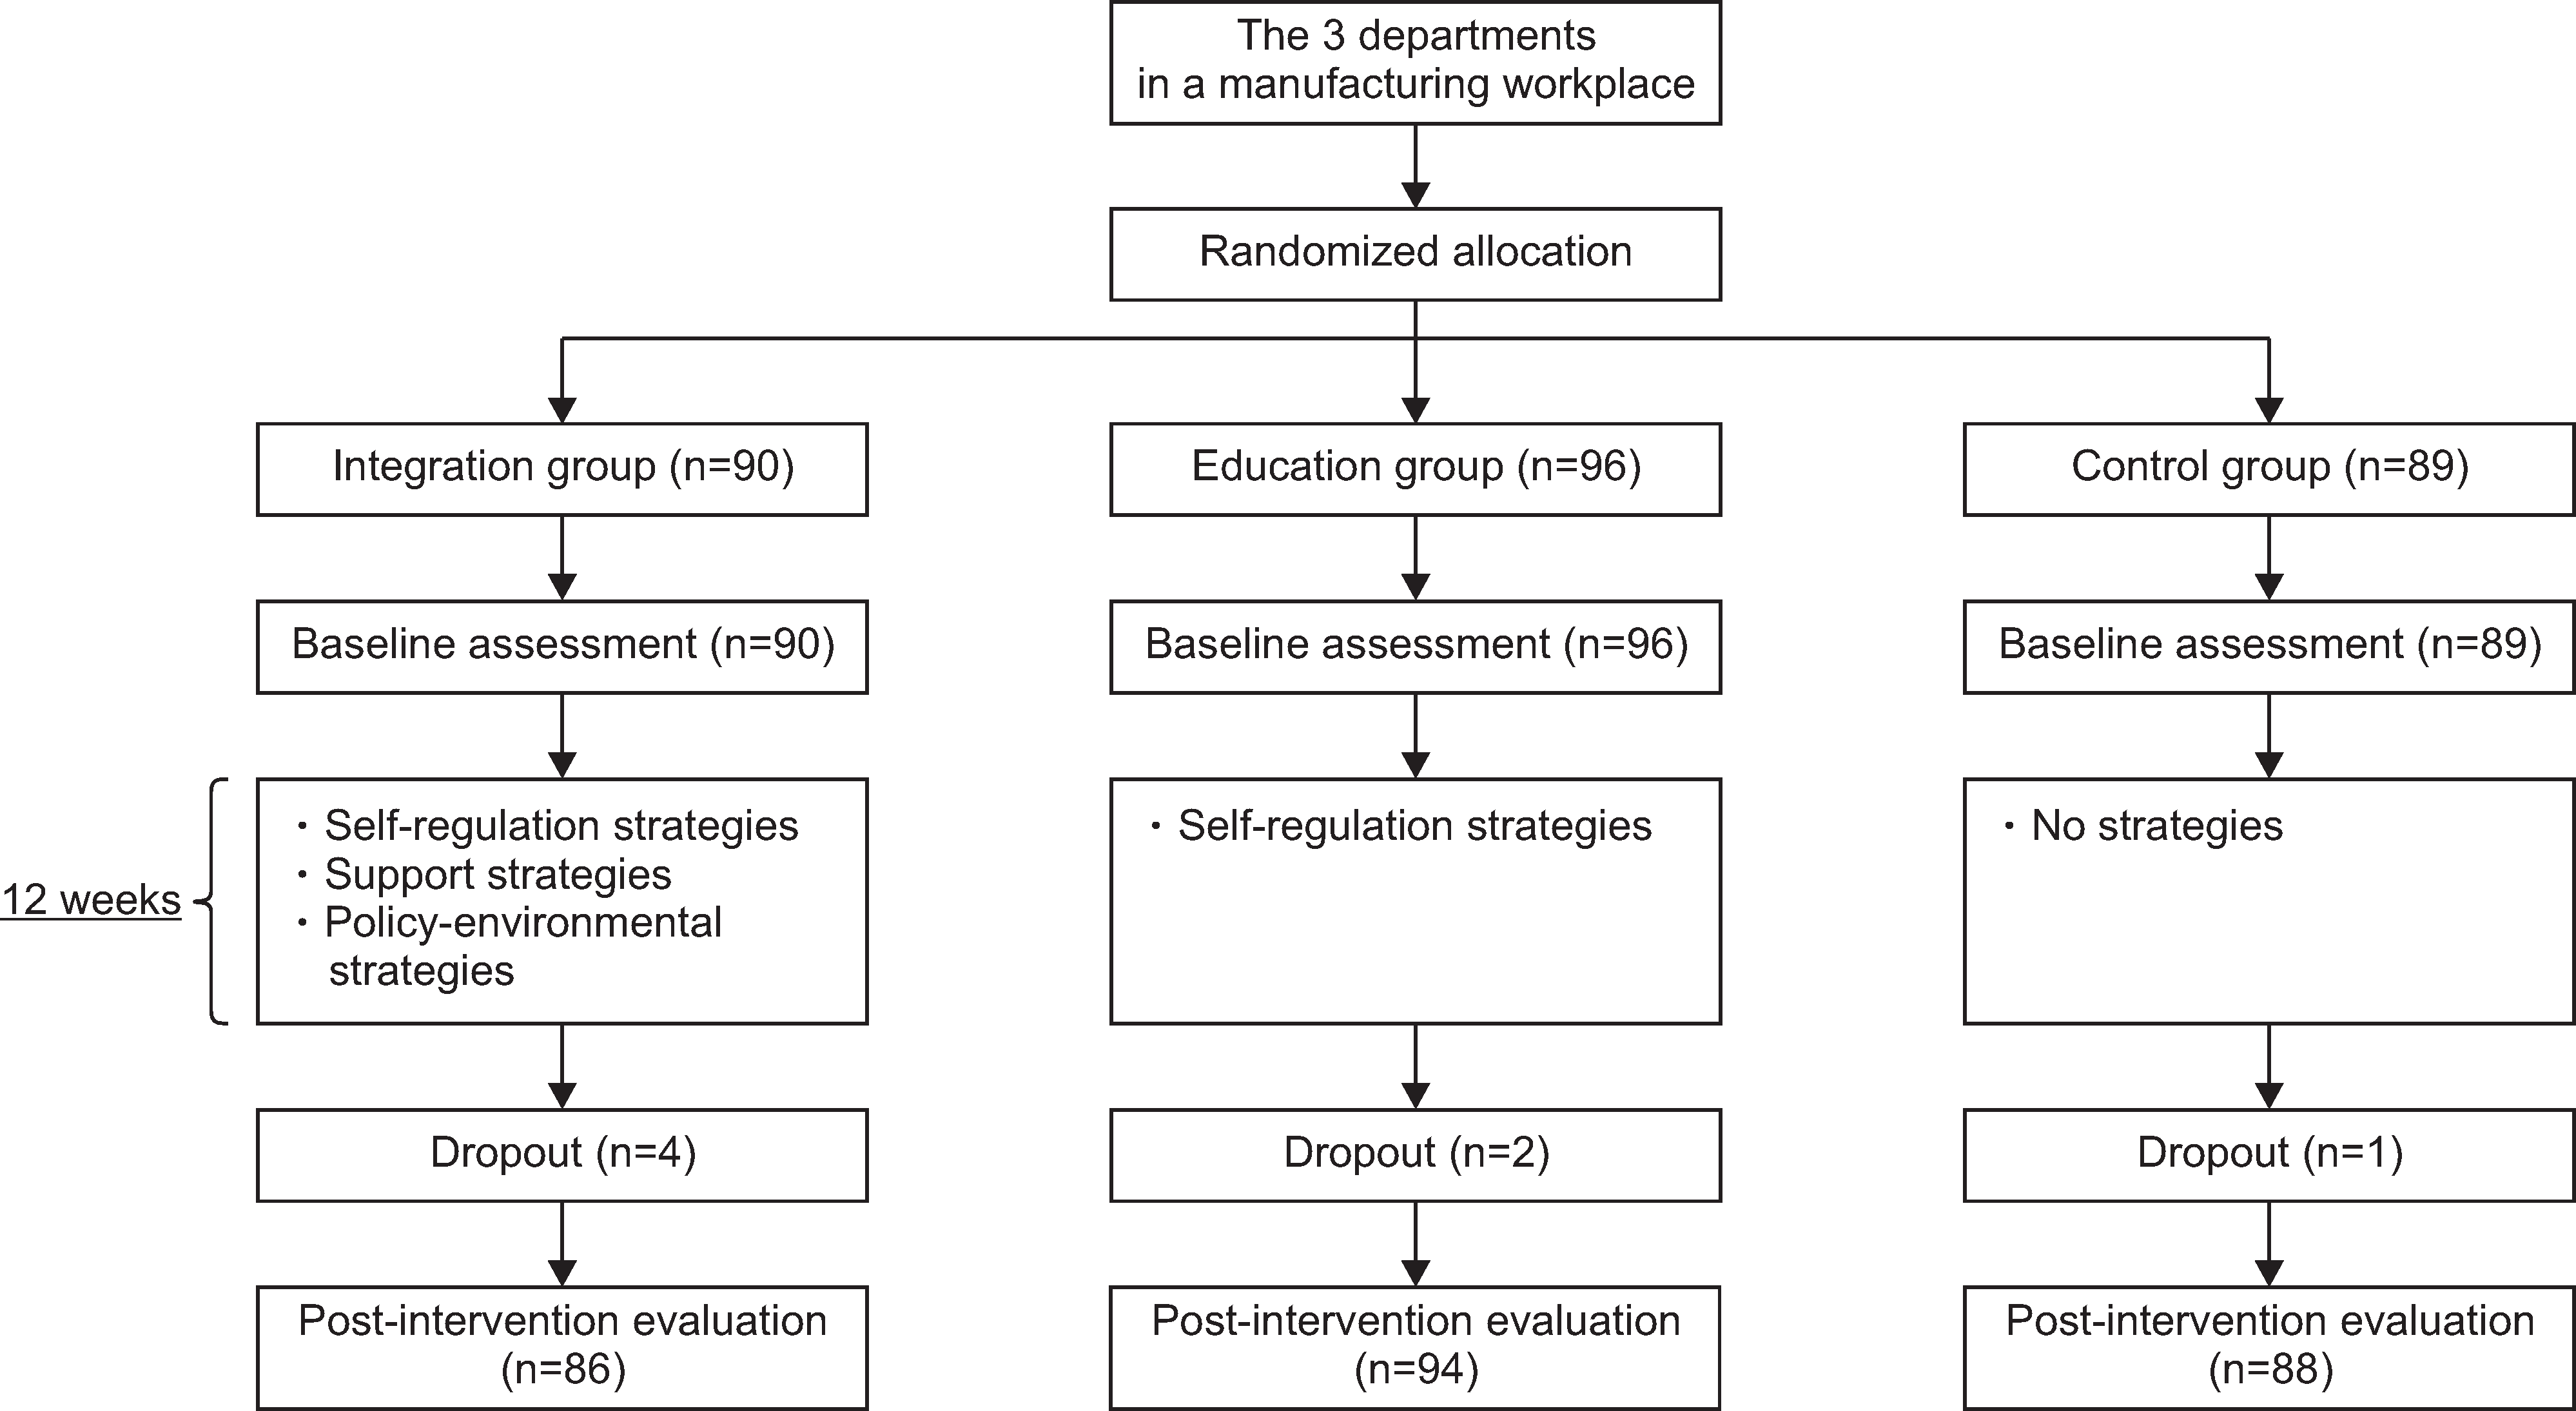
Participants were 268 workers in three departments of L manufacturing unit in South Korea. The three departments were randomly allocated into integration (n=86) (INT), education (n=94) (ED), and control (n=88) (CT) groups. The INT group received self-regulation, support, and policy-environmental strategies of a 12-week integrated PA program, the ED group received self-regulation strategies only, and the CT group did not receive any strategies. After 12 weeks, process evaluation was conducted by using the measures of self-regulation (autonomous vs. controlled regulation), autonomy support, and resource availability; impact evaluation by using PA measures of sitting time, PA expenditure, and compliance; and outcome evaluation by using the measures of cardiometabolic/musculoskeletal health and presenteeism.
Results
Among process measures, autonomous regulation did not differ by group, but significantly decreased in the CT group (p=.006). Among impact measures, PA compliance significantly increased in the INT group compared to the CT group (p=.003). Among outcome measures, the changes in cardiometabolic/musculoskeletal health and presenteeism did not differ by group; however, systolic blood pressure (p=.012) and a presenteeism variable (p=.041) significantly decreased only in the INT group.
Conclusion
The integrated PA program may have a significant effect on increases in PA compliance and significant tendencies toward improvements in a part of cardiometabolic health and presenteeism for physically inactive workers. Therefore, occupational health nurses may modify and use it as a workplace PA program.
Go to : 
References
1. World Health Organization (WHO). Noncommunicable diseases: The slow motion disaster [Internet]. Geneva: WHO;c2017. [cited 2017 May 3]. Available from:. http://www.who.int/pub-lications/10-year-review/ncd/en/index3.html.
2. Occupational Safety and Health Administration (OSHA). Estimating work rates or loads [Internet]. Washington DC: OSHA;c2017. [cited 2017 May 1]. Available from:. https://www.osha.gov/SLTC/heatillness/heat_index/work_rates_loads.html.
3. Leischik R, Foshag P, Strauss M, Garg P, Dworrak B, Littwitz H, et al. Physical activity, cardiorespiratory fitness and carotid intima thickness: Sedentary occupation as risk factor for atherosclerosis and obesity. European Review for Medical and Pharmacological Sciences. 2015; 19(17):3157–3168.
4. Teichtahl AJ, Urquhart DM, Wang Y, Wluka AE, O’Sullivan R, Jones G, et al. Physical inactivity is associated with narrower lumbar intervertebral discs, high fat content of paraspinal muscles and low back pain and disability. Arthritis Research & Therapy. 2015; 17(1):114. https://doi.org/10.1186/s13075-015-0629-y.

5. Yu J, Wang S, Yu X. Health risk factors associated with pre-senteeism in a Chinese enterprise. Occupational Medicine. 2015; 65(9):732–738. https://doi.org/10.1093/occmed/kqv115.

6. Agaliotis M, Fransen M, Bridgett L, Nairn L, Votrubec M, Jan S, et al. Risk factors associated with reduced work productivity among people with chronic knee pain. Osteoarthritis and Cartilage. 2013; 21(9):1160–1169. https://doi.org/10.1016/j.joca.2013.07.005.

7. Turpin RS, Ozminkowski RJ, Sharda CE, Collins JJ, Berger ML, Billotti GM, et al. Reliability and validity of the Stanford presenteeism scale. Journal of Occupational and Environmental Medicine. 2004; 46(11):1123–1133.

8. Shrestha N, Kukkonen-Harjula KT, Verbeek JH, Ijaz S, Hermans V, Bhaumik S. Workplace interventions for reducing sitting at work. Cochrane Database of Systematic Reviews. 2016; 3:CD010912. https://doi.org/10.1002/14651858.CD010912.pub3.

9. Carr LJ, Leonhard C, Tucker S, Fethke N, Benzo R, Gerr F. Total worker health intervention increases activity of sedentary workers. American Journal of Preventive Medicine. 2016; 50(1):9–17. https://doi.org/10.1016/j.amepre.2015.06.022.

10. Lemon SC, Wang ML, Wedick NM, Estabrook B, Druker S, Schneider KL, et al. Weight gain prevention in the school worksite setting: Results of a multi-level cluster randomized trial. Preventive Medicine. 2014; 60:41–47. https://doi.org/10.1016/j.ypmed.2013.12.010.

11. Green LW, Kreuter MW. Health program planning: An educational and ecological approach. 4th ed. New York (NY): Mc-Graw-Hill;2005. p. 1–458.
12. Kattelmann KK, Bredbenner CB, White AA, Greene GW, Ho-err SL, Kidd T, et al. The effects of young adults eating and active for health (YEAH): A theory-based web-delivered intervention. Journal of Nutrition Education and Behavior. 2014; 46(6):S27–S41. https://doi.org/10.1016/j.jneb.2014.08.007.

13. Kim JT, Kim TW, Seo EC. Verification of health promotion motivation model: Focused on pre-diagnostic scales of PRE-CEDE model. Journal of Adapted Physical Activity and Exercise. 2016; 24(4):73–88. https://doi.org/10.17006/kjapa.2016.24.4.73.
14. De Cocker K, De Bourdeaudhuij I, Cardon G, Vandelanotte C. The effectiveness of a web-based computer-tailored intervention on workplace sitting: A randomized controlled trial. Journal of Medical Internet Research. 2016; 18(5):e96. https://doi.org/10.2196/jmir.5266.

15. Ryan RM, Connell JP. Perceived locus of causality and internalization: Examining reasons for acting in two domains. Journal of Personality and Social Psychology. 1989; 57(5):749–761. https://doi.org/10.1037/0022-3514.57.5.749.

16. Hagger MS, Chatzisarantis NLD. Intrinsic motivation and self-determination in exercise and sport. Champaign (IL): Human Kinetics;2007. p. 1–374.
17. Kim HJ. Development and effects of an integrated physical activity program for physically inactive workers: Based on the PRECEDE-PROCEED model [dissertation]. Seoul: Korea University;2017. p. 1–229.
18. Slemp GR, Kern ML, Vella-Brodrick DA. Workplace well-being: The role of job crafting and autonomy support. Psychology of Well-Being. 2015; 5(7):1–17. https://doi.org/10.1186/s13612-015-0034-y.

19. Ahn J, Kim Y, Lee HY, Jang BH, Jang EJ, Hyun MK, et al. A summary of methods for comparative effectiveness research. National Evidence-based Healthcare Collaborating Agency. 2013; 1–141.
20. van Scheppingen AR, de Vroome EM, ten Have KC, Zwetsloot GI, Bos EH, van Mechelen W. Motivations for health and their associations with lifestyle, work style, health, vitality, and employee productivity. Journal of Occupational and Environmental Medicine. 2014; 56(5):540–546.

21. Baard PP, Deci EL, Ryan RM. Intrinsic need satisfaction: A motivational basis of performance and well-being in two work settings. Journal of Applied Social Psychology. 2004; 34(10):2045–2068. https://doi.org/10.1111/j.1559-1816.2004.tb02690.x.
22. Prodaniuk TR, Plotnikoff RC, Spence JC, Wilson PM. The influence of self-efficacy and outcome expectations on the relationship between perceived environment and physical activity in the workplace. International Journal of Behavioral Nutrition and Physical Activity. 2004; 1:7. https://doi.org/10.1186/1479-5868-1-7.
23. Roh MY, Lee H, Lee CY, Kim GS. Correlates of physical activity among Korean Navy Personnel: An ecological approach. Journal of Korean Academy of Community Health Nursing. 2012; 23(3):296–306. https://doi.org/10.12799/jkachn.2012.23.3.296.

24. Chau JY, van der Ploeg HP, Dunn S, Kurko J, Bauman AE. A tool for measuring workers’ sitting time by domain: The Workforce Sitting Questionnaire. British Journal of Sports Medicine. 2011; 45(15):1216–1222. https://doi.org/10.1136/bjsports-2011-090214.

25. International Physical Activity Questionnaire Group (IPAQ group). International Physical Activity Questionnaire [Internet]. Stockholm: IPAQ group;c2010. [cited 2015 Nov 1]. Available from:. https://sites.google.com/site/theipaq/questionnaire_links.
26. Hales T, Sauter S. Health hazard evaluation report: HETA-89-299-2230, US West Communications, Phoenix, Arizona, Minneapolis, Minnesota, Denver, Colorado [Internet]. Cincinnati (OH): National Institute for Occupational Safety and Health;c1992. [cited 2015 Apr 1]. Available from:. http://www.cdc.gov/niosh/nioshtic-2/00210212.html.
27. Lee YM, Jung MH. Economic impact according to health problems of workers. Journal of Korean Academy of Nursing. 2008; 38(4):612–619. https://doi.org/10.4040/jkan.2008.38.4.612.

28. Shah KN, Majeed Z, Yoruk YB, Yang H, Hilton TN, McMahon JM, et al. Enhancing physical function in HIV-infected older adults: A randomized controlled clinical trial. Health Psychology. 2016; 35(6):563–573. https://doi.org/10.1037/hea0000311.

29. Duda JL, Williams GC, Ntoumanis N, Daley A, Eves FF, Mutrie N, et al. Effects of a standard provision versus an autonomy supportive exercise referral programme on physical activity, quality of life and well-being indicators: A cluster randomised controlled trial. International Journal of Behavioral Nutrition and Physical Activity. 2014; 11:10. https://doi.org/10.1186/1479-5868-11-10.

30. LaCaille LJ, Schultz JF, Goei R, LaCaille RA, Dauner KN, de Souza R, et al. Go!: Results from a quasi-experimental obesity prevention trial with hospital employees. BMC Public Health. 2016; 16:171. https://doi.org/10.1186/s12889-016-2828-0.

31. Sarkar S, Taylor WC, Lai D, Shegog R, Paxton RJ. Social support for physical activity: Comparison of family, friends, and coworkers. Work. 2016; 55(4):893–899. https://doi.org/10.3233/WOR-162459.

32. Mair JL, Boreham CA, Ditroilo M, McKeown D, Lowery MM, Caulfield B, et al. Benefits of a worksite or home-based bench stepping intervention for sedentary middle-aged adults - a pilot study. Clinical Physiology and Functional Imaging. 2014; 34(1):10–17. https://doi.org/10.1111/cpf.12056.

33. Lin YP, Hong O, Lin CC, Lu SH, Chen MM, Lee KC. A “sit less, walk more” workplace intervention for office workers: Long-term efficacy of a quasi-experimental study. Journal of Occupational and Environmental Medicine. 2018; 60(6):e290–e299. https://doi.org/10.1097/JOM.0000000000001299.
Go to : 
Table 1.
Contents of a 12 week-Integrated PA Program at the Intervention Alignment Phase
Table 2.
Homogeneity of General Characteristics between Groups (N=268)
Table 3.
Effects of an Integrated PA Program on Outcome Variables (N=268)


 PDF
PDF ePub
ePub Citation
 Print
Print


 XML Download