

 PDF
PDF ePub
ePub Citation
 Print
Print


INTRODUCTION
The accumulating evidence that epilepsy is a network disease has shifted the understanding of focal epilepsy. Earlier it was believed that epilepsy is caused by focal pathology, but we now understand that it may result from dysfunction in a localized network, such as the cortical-subcortical network.12 This is consistent with recent studies demonstrating the importance of subcortical structures in epilepsy, and in seizure generation, maintenance, and propagation.345678
The basal ganglia are centrally located in the brain and comprise several important nuclei that may play crucial roles in the generation of seizures.9 The globus pallidus is part of the basal ganglia-corticothalamic circuit, and it serves as an intermediate bridge between the cerebral cortex and thalamus.810 Several reports have suggested that the globus pallidus plays a pivotal role in epilepsy.345678 In the penicillin monkey model, stimulation of the globus pallidus was found to be proconvulsive,6 whereas lesions of the globus pallidus suppressed the development of epileptic activity and generalized convulsions.11 In addition, injecting kainic acid into the globus pallidus of rats evoked not only epileptic excitation of the cortex but also transient enhancement of the globus pallidus-substantia nigra circuit.4 More recently, during focal motor seizures induced by the injection of penicillin into the primary motor cortex of monkeys, the proportion of oscillatory neurons in the subthalamic nucleus and globus pallidus increased significantly compared with the interictal period, suggesting that the subthalamopallidal pathway is the main subcortical route involved in ictal motor seizures.7
On the other hand, the involvement of other subcortical structures in the epilepsy network of focal epilepsy—such as the caudate nucleus, putamen, substantia nigra, and thalamus—has been well demonstrated in various researches, including neuroimaging studies.121314 The thalamus is the most frequently reported subcortical structure that is affected in patients with focal epilepsy in PET studies.1314 Furthermore, a resting-state functional magnetic resonance imaging (MRI) study identified the thalamus as a common region of brain dysfunction in patients with focal epilepsy, even when the seizures originated at heterogeneous sites.15 In addition, a poststroke epilepsy model showed that thalamocortical neurons connected to the injured epileptic cortex undergo changes in channel expression and become hyperexcitable, with them finally generating spontaneous seizures.16 Moreover, moderate bilateral stimulation of the anterior nucleus of the thalamus was found to reduce seizure activities in a randomized trial of focal epilepsy.17 The thalamus may also exert control over the cortex by inducing a stable hypersynchronization that ultimately leads to seizure termination in focal epilepsy, especially temporal-lobe epilepsy.18
Graph theory is a mathematical tool for analyzing and quantifying brain networks.1 The results obtained when applying graph theory suggest that the human brain has a global topology of small-worldness that maintains high global and local efficiency.19 Studies suggest that the topological organization of brain networks becomes disorganized and random in epilepsy.2021 Graph theoretical approaches can also be used to identify highly connected regions in the brain network, known as hub nodes, which play central roles in integrating diverse information and supporting fast communication with minimal energy cost.1922 Hubs are expected to form the basis of the integrative capacity of the brain, and possess a high degree of connectivity, short neuronal paths, and a high degree of centrality.1922 Cortical hubs in patients with epilepsy may play a role in the initiation and propagation of ictal activity.232425 Previous studies have demonstrated that eigenvector centrality and in-degree measures are effective in localizing the epileptogenic zone,2325 while another study proposed that betweenness centrality is correlated with the location of the resected cortical regions in patients who become seizure-free following surgery.24 However, no studies have investigated the hub reorganization of subcortical structures in patients with focal epilepsy.
We aimed to identify the hub reorganization of subcortical structures in focal epilepsy patients with normal MRI findings using graph theoretical analysis based on diffusion-tensor imaging (DTI). We also investigated differences in the values of diffusion tensors and scalars, fractional anisotropy (FA), and mean diffusivity (MD) of subcortical structures between patients with focal epilepsy and healthy subjects. Our hypothesis was that hub organization and the values of diffusion tensors and scalars of subcortical structures are altered in patients with focal epilepsy. We additionally performed a correlation analysis to investigate the effects of epilepsy duration on these measures.
METHODS
Subjects
This study was conducted with the approval of the review board of our institution (IRB No. 2017-04-008). This study was performed prospectively in a single tertiary hospital. One hundred patients with focal epilepsy diagnosed according to the practical definition suggested by the International League Against Epilepsy were recruited from March 2017 to October 2017; they had at least two unprovoked seizures occurring more than 24 hours apart or one unprovoked seizure with epileptiform discharges in EEG.26 We only enrolled patients who 1) were clinically diagnosed with focal epilepsy by an epileptologist based on clinical history, seizure semiology, and EEG findings, and 2) had normal brain MRI findings on visual inspection. We defined the group with newly diagnosed epilepsy as those patients diagnosed with epilepsy for the first time and in a drug-naïve state, and the chronic epilepsy group as those patients previously diagnosed with epilepsy and already taking antiepileptic drugs (AEDs). We additionally defined the lateralization of epilepsy based on the side of ictal or interictal epileptiform discharges that clearly originated from one hemisphere in EEG. The duration of epilepsy was defined as the age at the time of MRI minus the age at the time of the epilepsy diagnosis. We also enrolled an age- and sex-matched control group of 80 healthy subjects who had no significant past medical, neurological, or psychiatric history.
Brain MRI
All subjects underwent MRI using the same imaging protocol. The obtained scans included sagittal-oriented 3-dimensional (3D) T2-weighted images [TR/TE= 2,500.0/244.6 ms, field of view (FOV)= 256×256 mm2, and isotropic voxel size=1 mm3], sagittal-oriented 3D T1-weighted images (TR/TE=8.6/4.0 ms, FOV= 256×256 mm2, and isotropic voxel size=1 mm3), and coronal-oriented 3D fluid-attenuated inversion recovery images (TR/TE=4,800.0/266.8 ms, FOV=240×240 mm2, and isotropic voxel size=1 mm3). Moreover, all subjects underwent DTI to obtain data suitable for graph theoretical analysis. DTI was performed using spin-echo single-shot echo-planar pulse sequences with a total of 32 different diffusion directions (TR/TE=8,620/85 ms, flip angle=90°, slice thickness=2.25 mm, acquisition matrix=120× 120, FOV=240×240 mm2, and b= 1,000 s/mm2). All scans were performed using a 3.0-Tesla MRI scanner equipped with an eight-channel head coil (Achieva TX, Philips Healthcare, Best, the Netherlands).
Image processing and analysis
Most of the analysis was performed using DSI Studio software (http://dsi-studio.labsolver.org). The following procedures were performed for graph theoretical analysis: The first step was to create a tractograph from the DTI data, which included reading and parsing DICOM files, reconstruction to characterize the main diffusion direction of the fiber, and fiber tracking. The seeding region was placed over the whole brain. The angular threshold was 60°, the step size was 0.9375 mm, tracks shorter than 30 mm were discarded, and 5,000 seeds were placed. The next step involved generating a connectivity matrix, which was calculated using the count of the connecting tracts that passed two regions of interest. The Automated Anatomical Labeling (AAL) template was used to parcellate the brain, and every white-matter fiber was evaluated for extreme points. Only the final connecting region was counted, and a threshold of 0.001 was used to filter out matrix entries with a small number of connecting tracks. This step included obtaining a whole-brain fiber track, placing seeding regions throughout the brain, spatial normalization, defining the region of interest, and creating a connectivity matrix.
The last step was calculating graph theoretical network measures of subcortical structures (right and left caudate nucleus, globus pallidus, putamen, and thalamus) from the connectivity matrix. For weighted measures, the connectivity matrix is normalized so that the maximum value in the matrix is 1. These measures included the node strength, cluster coefficient, eigenvector centrality, and page-rank centrality. The strength is the summed value of the weights of links connected to a node.1927 The clustering coefficient of a node quantifies the likelihood that neighboring nodes are also connected to each other, and is calculated as the number of edges that exist between the neighbors of a node, normalized to the maximum number of edges that could exist between them.28 The eigenvector centrality is a measure that has high values for nodes that are highly connected to nodes that are also central within the network, and is calculated as the positive multiple of the sum of adjacent centralities.29 The page-rank centrality is a variant of the eigenvector centrality, and it is measured by counting the number and quality of links to a node to obtain a rough estimate of the importance of the node.1927 In addition, we normalized the DTI data to the AAL template and computed the FA and MD values in the regions of interest, including the right and left caudate nucleus, putamen, globus pallidus, and thalamus. The measured values for the right and left structures were then summed.
Statistical analysis
Comparisons were performed using the chi-square test for categorical variables and Student's t-test for numerical variables. We quantified correlations between the network measures, the FA and MD values, and the duration of epilepsy using Spearman's rank correlation test. Categorical variables are presented as frequency and percentage values. Numerical variables conforming to a normal distribution are presented as mean±SD values, while other numerical variables are presented as median and range values.
Probability values of p<0.05 were considered to indicate statistical significance in all calculations. However, when analyzing the hub organization and differences in the values of diffusion tensors and scalars between the four subcortical structures, p<0.0125 (0.05/4, Bonferroni correction) was used as the criterion for statistical significance. All of the statistical tests were performed using MedCalc® software (version 17.8, MedCalc, Ostend, Belgium).
RESULTS
Demographic and clinical characteristics of the subjects
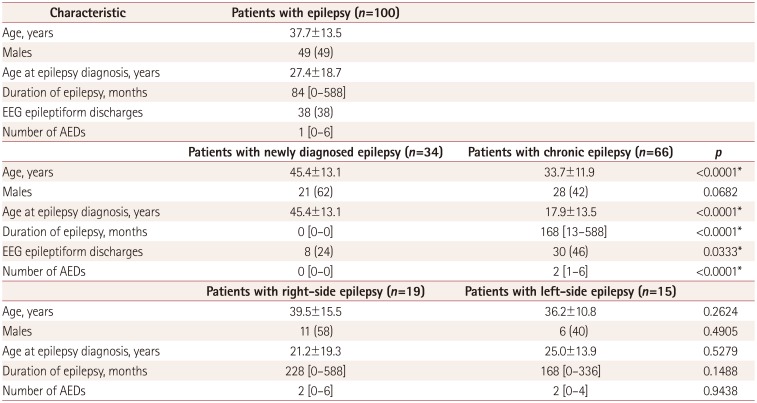
Table 1 presents the demographic and clinical characteristics of the patients with epilepsy. EEG epileptiform discharges were observed in 38 patients (38%), whereas 42 patients (42%) had normal findings. The other 20 patients (20%) had nonspecific findings such as focal slowing. Of the 38 patients with epileptiform discharges, they were on the right side in 19 patients, on the left side in 15, and occurred bilaterally and independently in 4. The median number of AEDs was 1 (range=0–6).
Of these 100 patients, 34 patients (34%) were newly diagnosed with epilepsy while 66 (66%) had chronic epilepsy (Table 1). Of the 34 patients with newly diagnosed epilepsy, 31 had at least 2 unprovoked seizures occurring more than 24 hours apart, and the other 3 patients had only 1 unprovoked seizure with EEG epileptiform discharges. The age, age at the epilepsy diagnosis, presence of EEG epileptiform discharges, and number of AEDs taken differed significantly between the patients with newly diagnosed epilepsy and those with chronic epilepsy.
The 80 healthy subjects comprised 34 (43%) men and 46 (57%) women aged 37.7±11.8 years. All of the healthy subjects had normal findings in neurological examinations and visual inspections of brain MRI scans. The mean age and sex ratio of healthy subjects did not differ significantly from those of the 100 patients with epilepsy overall (p=0.99 and p=0.39, respectively). In addition, in the subgroup analysis, the mean age and the proportion of males among patients with right-side and left-side epilepsy did not differ significantly from those of the healthy subjects (p=0.33 and p=0.23, and p=0.63 and p=0.86, respectively). However, the patients with newly diagnosed and chronic epilepsy were older and younger, respectively, than the healthy subjects. Thus, when we investigated the network measures in patients with newly diagnosed and chronic epilepsy, we matched 50 healthy subjects for analyzing the patients with newly diagnosed epilepsy and 70 healthy subjects for analyzing the patients with chronic epilepsy. In patients with newly diagnosed or chronic epilepsy, the mean age and male ratio did not differ from those in the subgroups of healthy subjects (45.4 vs. 44.6 years, p=0.73; 21/34 vs. 23/50, p=0.16; 33.7 vs. 35.1 years, p=0.47; 28/66 vs. 32/70, p=0.70; respectively).
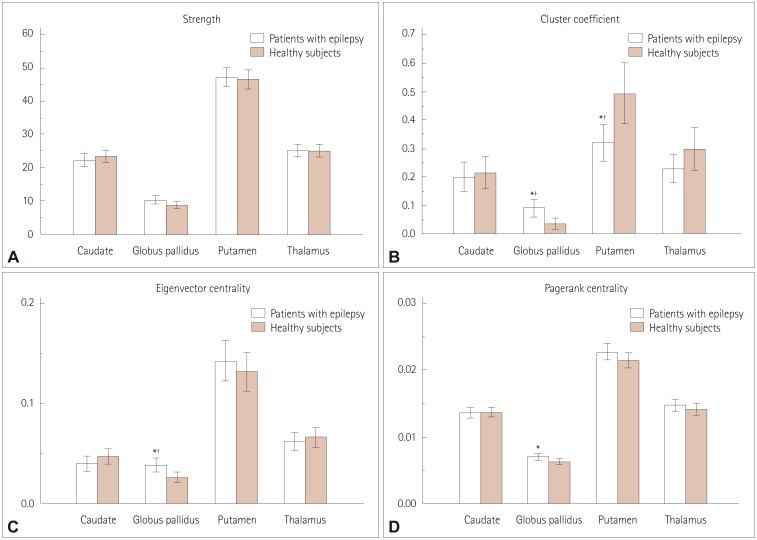
Measures of hub organization in epilepsy
Several network measures of subcortical structures differed significantly between the patients with epilepsy and the healthy subjects (Fig. 1) (Supplementary Table 1 in the online-only Data Supplement). After performing multiple corrections, the cluster coefficient and the eigenvector centrality of the globus pallidus were higher in patients with epilepsy than in healthy subjects (p=0.006 and p=0.008, respectively), whereas the cluster coefficient of the putamen was lower in patients with epilepsy than in healthy subjects (p=0.004).
Our analysis of the network measures of subcortical structures stratified into subgroups also revealed significant differences between patients with newly diagnosed or chronic epilepsy and healthy subjects (Supplementary Table 1 in the online-only Data Supplement). After performing multiple corrections, the cluster coefficient of the globus pallidus was higher in patients with newly diagnosed epilepsy than in healthy subjects (p=0.009).
When we analyzed the network measures classified into 19 right-side and 15 left-side epilepsy subgroups, no significant differences were found between the patients with epilepsy and healthy subjects (Supplementary Table 2 in the online-only Data Supplement). In the patients with right-side epilepsy, none of the network measures of the right subcortical structures—the node strength, cluster coefficient, eigenvector centrality, and page-rank centrality—differed from the values in the healthy subjects. Furthermore, in the patients with left-side epilepsy, none of the network measures of the left subcortical structures differed from those in the healthy subjects after performing multiple corrections.
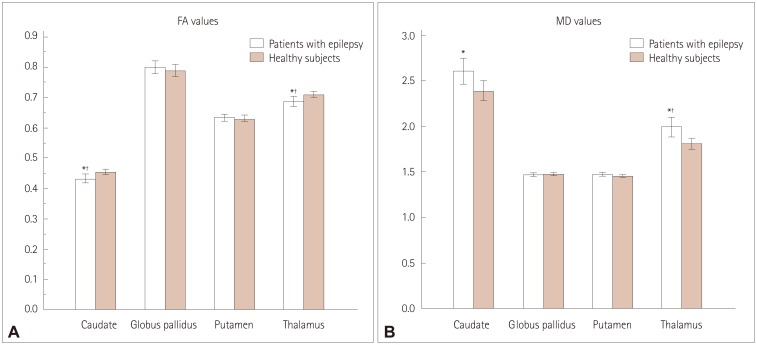
Values of the diffusion tensors and scalars
The FA and MD differed significantly between the patients with epilepsy and the healthy subjects (Fig. 2) (Supplementary Table 3 in the online-only Data Supplement). The FA values of the caudate nucleus and thalamus were lower in patients with epilepsy than in healthy subjects, even after performing multiple corrections (p=0.009 and p=0.007, respectively). The MD values of the thalamus were higher in patients with epilepsy than in healthy subjects after performing multiple corrections (p=0.005). The FA and MD values of the globus pallidus and putamen did not differ between the patients with epilepsy and the healthy subjects.
Our stratification of the values of FA and MD of the subcortical structures into subgroups also revealed significant differences between patients with newly diagnosed or chronic epilepsy and healthy subjects (Supplementary Table 3 in the online-only Data Supplement). The FA values for the thalamus were lower in patients with newly diagnosed epilepsy than in healthy subjects (p=0.012), while the MD values were higher than those in healthy subjects (p=0.009), even after performing multiple corrections.
Analyzing the FA and MD values separately in the right-side and left-side epilepsy subgroups revealed some significant differences between the patients with epilepsy and healthy subjects (Supplementary Table 4 in the online-only Data Supplement). The patients with right-side epilepsy had lower FA values of the right caudate nucleus and thalamus (p<0.001 and p<0.001, respectively), and higher MD values of the right caudate, putamen, and thalamus compared to those in healthy subjects (p=0.005, p=0.010, and p<0.001, respectively). Additionally, the MD value for the left thalamus was higher in patients with left-side epilepsy than in healthy subjects (p<0.001), even after performing multiple corrections.
Findings of the correlation analysis
None of the network measures such as the node strength, cluster coefficient, eigenvector centrality, and page-rank centrality were significantly correlated with the duration of epilepsy (Supplementary Table 5 in the online-only Data Supplement). In addition, none of the FA and MD values were correlated with the duration of epilepsy (Supplementary Table 6 in the online-only Data Supplement).
DISCUSSION
We discovered that the centrality measures of the subcortical structures were significantly altered in patients with epilepsy. This suggests that hub reorganization of subcortical structures occurs in patients with focal epilepsy, and that the subcortical structures play a pivotal role as a hub in the epilepsy network. We additionally found this even in patients with newly diagnosed epilepsy. We have also demonstrated significant alterations of the microstructural integrity in the subcortical structures using the FA and MD values. The results obtained in the present study corroborate the idea that epilepsy is a network disease, and that subcortical structures are closely involved in the epilepsy network.
We found that the subcortical structures, especially the globus pallidus, were significantly altered in patients with epilepsy. Higher values of centrality measures of the globus pallidus in patients with epilepsy are likely to reflect increased connections between the globus pallidus and cerebral cortex via direct or indirect pathways.2930 The output from the globus pallidus to the cerebral cortex is traditionally thought to be relayed via the thalamus. In addition, recent studies have identified the existence of a direct efferent output from the globus pallidus to excitatory pyramidal neurons.2930 We can therefore assume that the increased connectivity between the globus pallidus and cerebral cortex may be responsible for the generation of epileptic seizures. This is consistent with many studies of brain connectivity in epilepsy demonstrating focal epilepsy to be associated with increases in the regional connectivity in epileptogenic zones.3132
However, it is not clear whether increased connectivity induces recurrent seizures or whether it is an adaptive mechanism to prevent seizures. A previous animal study found that electrical stimulation of the globus pallidus reproducibly induced electrographic and clinical seizures,6 and another study revealed that globus pallidus lesions exert a pronounced antiepileptic effect on the development of neocortical epileptic activity.11 Moreover, activation of gamma-aminobutyric acid (GABA)-B receptors by injecting tiagabine or baclofen into the globus pallidus decreased the incidence of pentylenetetrazol-induced tonic seizures in adult rats.5 This could be due to a reduction of globus pallidus activity due to GABA-B activation decreasing inhibition of the substantia nigra pars reticulate, and subsequently increasing inhibition in the thalamocortical circuit.5910 These previous studies suggest that activation of the globus pallidus induces seizures. Conversely, a recent study found that the direct pathway from the globus pallidus externa to the cerebral cortex was mediated by GABA-A receptors, and so the globus pallidus might exert inhibitory effects on the cerebral cortex.2930 Another study using computational modeling also demonstrated that increasing the activation of the globus pallidus externa could suppress synchronous spike-and-wave discharges bilaterally during absence seizures.8
On the other hand, we found that the cluster coefficient of the putamen was lower in patients with epilepsy than in healthy subjects. This might be due to the increased connectivity of the globus pallidus among the subcortical structures decreasing the connectivity of the putamen, because the globus pallidus receives inhibitory input from the striatum including the putamen.2930
Another interesting finding of the present study was that several network measures of the thalamus did not differ between patients with epilepsy and healthy subjects. However, the FA values of the thalamus were significantly lower in patients with epilepsy than in healthy subjects, and the MD values of the thalamus were higher than those in healthy subjects, even after performing multiple corrections. There is strong evidence that a neuronal network of tightly connected cortical and subcortical brain structures (especially the thalamus) are essential for the generation and maintenance of epileptic activity.33 Previous results from humans and experimental models have demonstrated that cortical and thalamic networks that generate and maintain certain sleep rhythms are also critically involved in the production of the generalized spike-and-wave discharges that are typically seen in generalized seizures.34 Thus, the thalamus plays a significant role in seizure activity, in terms of the threshold, duration, or severity of cortical seizures.17 A regulatory role of the thalamus is also strongly suggested by the cortical sleep spindles and alpha activity being coherent with thalamocortical interplay activity and intrathalamic feedback.35 Furthermore, we found that compared with the healthy subjects, the patients with right-side epilepsy had lower FA and higher MD values for the right thalamus, and those with left-side epilepsy had a higher MD value for the left thalamus. It is well known that the thalamus has widespread connections to the cortex, including to the frontal, temporal, parietal, and insular cortices, and it may receive discharges coming from the primary cortical focus.36 Neuronal damage in the brain usually follows an anatomically and functionally connected route for the spread of ictal activity, and so the FA and MD values of the thalamus may be altered.37 This is in a line with a previous DTI study finding regions with significantly low FA and high MD values in the locality of electroclinical seizures.38 This is also supported by another study demonstrating that the seizure-induced signal changes on MRI are usually seen in the thalamus ipsilateral to the cortical epileptic focus.39
The strengths of the present study include its relatively large sample and the use of DTI to examine the brain network. Despite its many advantages, DTI has rarely been used to investigate brain connectivity in patients with focal epilepsy. The reproducibility of graph theory metrics obtained from structural connectomes based on DTI is markedly greater than those obtained from studies of functional connectivity based on EEG, magnetoencephalography, and resting state-functional MRI, which tend to be dynamic over time and have some degree of within-subject variability.2740 Additionally, DTI can be used to focus on the quantification of intuitive measurements of axonal fibers, revealing direct structural reorganization and connections, whereas studies based on cortical thickness or volumes can only indirectly evaluate structural associations using statistical dependences or correlations.41
However, this study was subject to several limitations. First, prolonged video-EEG recordings were not performed in most of the patients, we could not be certain of specific seizure localizations using interictal scalp EEG recording and semiology alone. Second, the globus pallidus consists of the globus pallidus externa and interna, but these two structures were not evaluated separately in our analysis. Future studies should consider performing such segmentation of the globus pallidus. Third, this study had a cross-sectional design. We did not investigate intrapersonal serial MRI scans to evaluate the influence of the duration of epilepsy on network measures, instead inferring this based on an evaluation of a homogeneous population with consideration of the durations of both newly diagnosed and chronic epilepsy. This can be considered a reasonable approach based on the assumption that network changes are progressing uniformly across patients. The present findings of no significant differences in network characteristics in the patients with chronic epilepsy and no correlation between the network measures and the FA or MD values and the duration of epilepsy could have been attributable to this limitation, and so further studies with intrapersonal serial scans might be needed. Last, AEDs can influence patients with chronic epilepsy. All of the present patients with chronic epilepsy were taking AEDs, and their influence on network measures or the FA and MD values cannot be ruled out.
In conclusion, we have discovered that hub reorganization of subcortical structures occurs in focal epilepsy patients with normal MRI findings, which suggests that the pivotal role of the subcortical structures is significantly altered in patients with epilepsy as a hub in the epilepsy network. These results corroborate the concept of epilepsy as a network disease, and that subcortical structures are strongly involved in the epilepsy network.
 XML Download