

 PDF
PDF ePub
ePub Citation
 Print
Print


Introduction
Among bodily tissues, oral tissues have some of the most distinctive stages of development, which are largely dependent upon the age of the person. Individually speaking, the teeth and jawbone are the structures that are most consistent with age. Teeth are a generally reliable comparative feature, as they are naturally preserved over a long period of time, even after tissue and bone have decomposed [123]. Tooth development follows a typical chronological pattern, and fully-formed teeth show characteristic age-related changes [45]. For these reasons, a number of studies have been conducted to analyze changes in teeth according to age. Primary tooth eruption time, timing of permanent tooth replacement, timing of permanent tooth loss, dental pulp cavity size, tooth attrition, secondary dentin deposit, degree of tooth calcification, and mandibular change are all used as data to determine the age of a person. Gustafson [1] introduced the concept of age-related changes occurring in dental tissues and suggested that the estimation of chronological age be derived from six factors: attrition, secondary dentin formation, periodontal change, cementum apposition, transparency, and root resorption. Of note, tooth wear is one of these six factors.
Tooth wear has been widely used as a tool for age estimation [56]. Tooth wear is defined by mechanisms of attrition, abrasion and erosion [78], and overlaps various other processes such as functional or parafunctional habits, patterns of mandibular movement, bite force, saliva production, diet, medications, diseases, and occupational and habitual environments [9]. Tooth attrition is defined as a gradual and regular loss of tooth material as a result of chewing activity [10]. Tooth wear forms a record of an individual's growth and development, and the wear and attritional patterns can provide valuable information for age estimation in anthropological studies and in forensic dentistry [12].
To date, various measurement methods and wear indices utilizing the relationship between the degree of tooth wear and age have been developed and used in studies. Murphy [11] described 8 stages used to classify the degree of attrition, but the methods author used were based on dentin exposure. Miles [12] presented a method that calibrated the rate and pattern of molar attrition with the timing of eruption and established a statistical relationship between tooth wear and real age, enabling independent age assessment based on the degree of tooth wear. Tomenchuk and Mayhall [13] measured cusp height to show a correlation between attrition status and age and conceived of a quantitative method linking the degree of attrition to age. However, most of the current analysis methods have been unable to provide accurate quantitative information about the actual amount of tooth loss, and studies to date have the limitation of being cross-sectional in nature.
Technological developments have prompted the field of dentistry to implement 3D virtual modeling [1415]. Moreover, digitized 3D virtual imaging has made it possible to take measurements on a 3D model, which was impossible to do using prior qualitative tooth wear measurement methods, paving the way for future research [16]. It has been proven that the accuracy of measurement values taken from 3D virtual models does not vary significantly among observers and from the measurements obtained via other measuring methods used in research [17]. Our laboratory has developed a quantitative tooth wear index using a 3D virtual model [1819]. Lee et al. [18] developed more segmented parameters than can be obtained on a standard quantitative analysis of a 3D virtual model. This was accomplished by measuring the angle, height and length aspects of anatomical tooth structures based on a configured reference point, reference vector and reference planes [18].
The aim of this study is to examine the correlation between tooth wear and age using the quantitative measurement parameters described in previous studies. Specifically, we used shortest distance from the buccal occlusal plane to the central pit point (BCPH) and recently developed area and volume measurement methods to assess maxillary first molar wear in children subjects.
Go to : 
Materials and Methods
Selection of dental models and reconstruction
A total of 150 maxillary dental models were acquired from 30 clinically similar Koreans (male, 11; female, 19) with an age range of 6–14 years. The dental models were arranged into five groups according to age at 2-year intervals (i.e., 6, 8, 10, 12, and 14 years old). Subjects with previous orthodontic treatment, cast restorations or cuspal coverage were excluded.
In this study, the dental casts were reorganized into 3D models for quantitative wear measurement. Next, the entire outer shape was obtained using a 3D scanner (optoTOP-HE, Breukmann, Meersburg, Germany), and rendered into 3D virtual models via Rapidform XO (INUS Technology Inc., Seoul, Korea), a 3D reconstruction program [18]. The opto-TOP-HE has a point accuracy of ±0.005 mm and a resolution ±0.040 mm in the x- and y-axes, and 0.002 mm in the z-axis [20].
Quantitative measurements of area, volume, and BCPH
This study obtained quantitative measurements of the maxillary first molars using the reference points and buccal virtual occlusal planes proposed by Lee et al. [18]. Using the quantitative measurement parameters noted in previous studies, BCPH and area and volume measurement methods recently developed by Lee et al. [18], the amount of wear was determined and compared between age groups.
The 3D models of the maxillary first molars were then measured and analyzed with Rapidform 2004 software (INUS Technology Inc.). The area, volume and BCPH of the maxillary first molar were measured in order to quantify wear. The area and volume of part of the tooth cusp were also measured at heights of 0.2-, 0.4-, 0.6-, and 0.8-mm by offset plane, apical plane created from buccal occlusal plane (OSP) and BCPH was measured using software.
Area and volume measurement
Automatic recognition Rapidform 2004 software (INUS Technology Inc.) was used on the virtual maxillary first molar models to identify the highest points on each of the three cusps (mesiobuccal cusp, mesiolingual cusp, and distobuccal cusp), which were subsequently used as three reference points. Next, virtual buccal occlusal planes were created using the three reference points (mesiobuccal cusp point, mesiolingual cusp point, and distobuccal cusp point). Each plane used two reference points on the buccal side and one reference point on the lingual side, or vice versa, to reflect the wear on the buccal or lingual side, respectively [21].
Offset planes were generated from the virtual buccal occlusal planes. The virtual buccal occlusal plane shifted apically in 0.2-, 0.4-, 0.6- and 0.8-mm increments to form distinct OSPs (Table 1, Fig. 1). Using the OSP as a standard, a dental model was cut excluding the distolingual cusp point, and the mesiobuccal cusp point, distobuccal cusp point, and mesiolingual cusp point were measured together (Fig. 2). The shell of each maxillary first molar cusp was reversed and painted using software to obtain the area.
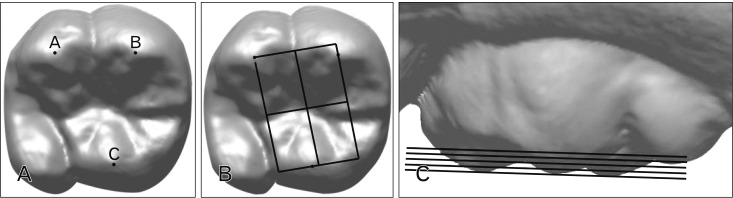 | Fig. 1Reference points, buccal occlusal planes (BOP) and measurement parameters of the maxillary first molar. (A) A, distobuccal cusp point; B, mesiobuccal cusp point; C, mesiolingual cusp point. (B) BOP. (C) Offset plane, apical plane created from buccal occlusal plane from 0.2 to 0.8 mm.
|
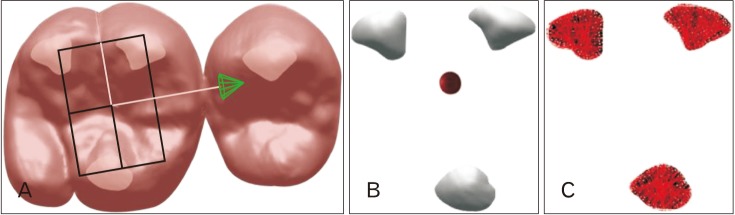 | Fig. 2Area and volume measurement by offset plane, apical plane created from buccal occlusal plane (OSP). (A) Divided by OSP. (B) Volume measurement. (C) Area measurement.
|
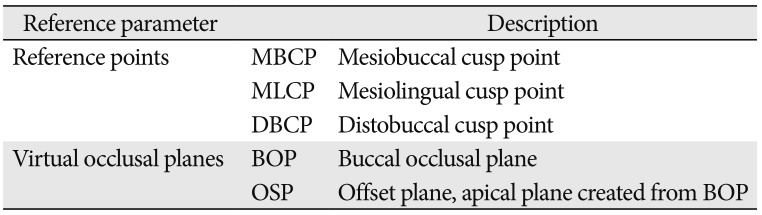
Table 1
Maxillary first molar reference points and virtual occlusal planes
![]()
The amount of wear was quantified in each of the four OSP heights (0.2, 0.4, 0.6, and 0.8 mm) using their respective area and volume measurements, then compared in all five age groups (6, 8, 10, 12, and 14 years old). The area and volume measurement parameters of the maxillary first molar are shown (Table 2).
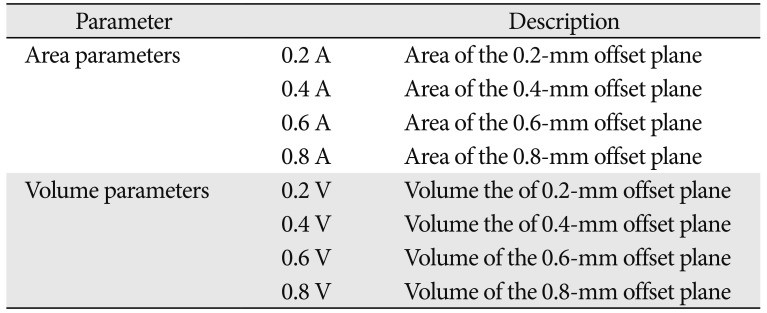
Table 2
Area and volume measurement parameters of the maxillary first molar
![]()
BCPH measurement
The distance from the three cusp points to the lowest point of the central pit was measured to derive the BCPH. The heights of the resultant virtual planes beside each of the three cusps were determined and compared in all five age groups (Table 3, Fig. 3).
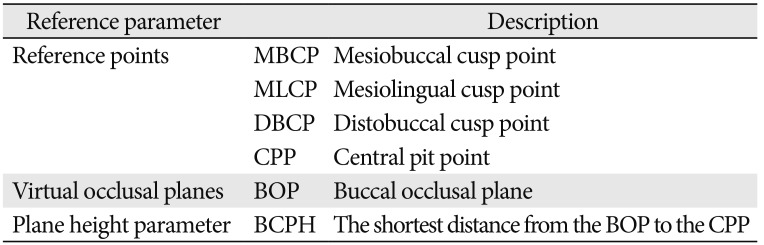
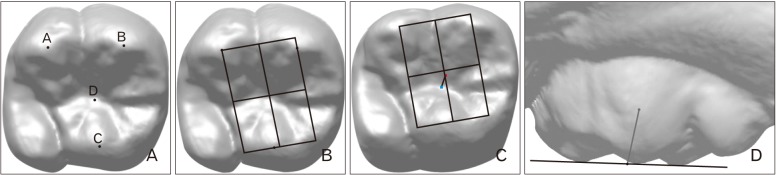 | Fig. 3Reference points for the shortest distance from the buccal occlusal planes (BOP) to the central pit point (CPP) measurement. (A) A, distobuccal cusp point; B, mesiobuccal cusp point; C, mesiolingual cusp point; D, CPP. (B) BOP. (C, D) The shortest distance from the BOP to the CPP.
|
Table 3
Reference points, virtual occlusal planes, and BCPH measurement of the maxillary first molar
![]()
Statistical analysis
Mean and standard deviation were calculated for each area, volume and BCPH measurement. The repeated measures ANOVA test was used to examine the differences between the amount of tooth wear and age (P<0.05), as well as differences in the amount of tooth wear and OSP height (P<0.05). Post hoc analysis was then performed using Duncan's test. Correlation and regression analyses were performed to estimate the relationship between age and amount of wear, as quantified by the area and volume measurements. According to these results, age estimations were obtained using a regression equation. One-way analysis of variance (ANOVA) tests were performed to evaluate the relationship between age and BCPH (P<0.05). All statistical analyses were performed using SPSS version 22 (IBM Corp., Armonk, NY, USA).
Go to :
Results
Area and volume results
The means and standard deviations for the area and volume parameters of the maxillary first molar by age group are presented (Table 4). Repeated measures ANOVA revealed significant differences between age and the amount of wear based on the area and volume measurements at different OSP heights (P<0.05). Except age of 8 and 10, 12 and 14's 0.2-mm offset-plane-measured volume, all area and volume measurement of all ages and offset-plane height showed a significant amount of increase. Among the post hoc Duncan's tests, 0.2 V, 0.4 V, and 0.6 V were found to precisely classify the subjects by age into five groups.
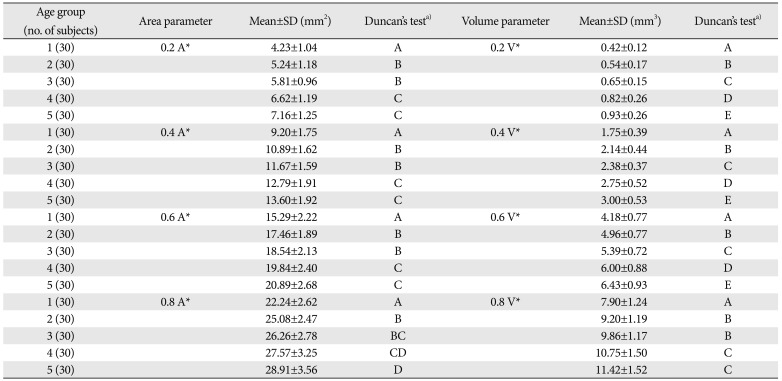
Table 4
Mean and standard deviation for area and volume parameters of the maxillary first molar by age group
SD, standard deviation.
Age group: 1, 6-years; 2, 8-years; 3, 10-years; 4, 12-years; 5, 14-years.
a)The same letters indicate a non-significant difference between the groups based on the post hoc Duncan test. Statistical significance was tested by repeated measures analysis of between age and the amount of wear based on area, volume (*P<0.05).
![]()
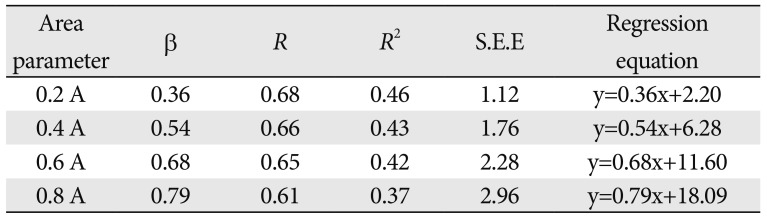
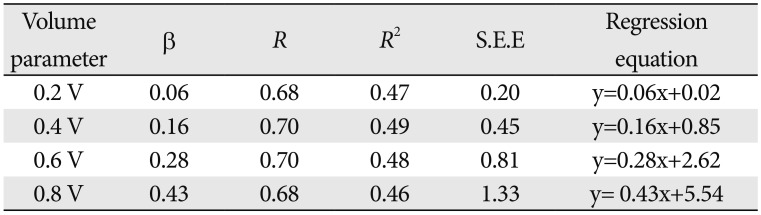
The linear regression analysis data for the 6-, 8-, 10-, 12- and 14-year-old age groups and corresponding amounts of wear quantified using the area and volumes obtained from the four offset planes (0.2, 0.4, 0.6, and 0.8 mm) are shown (Tables 5, 6, Figs. 4, 5). The coefficient of determination (R2) range was 0.37 to 0.46 for the area and 0.46 to 0.47 for the volume. Also, the R2 was highest in the 0.2 A (R2=0.46) and 0.4V (R2=0.49) measurement parameters.
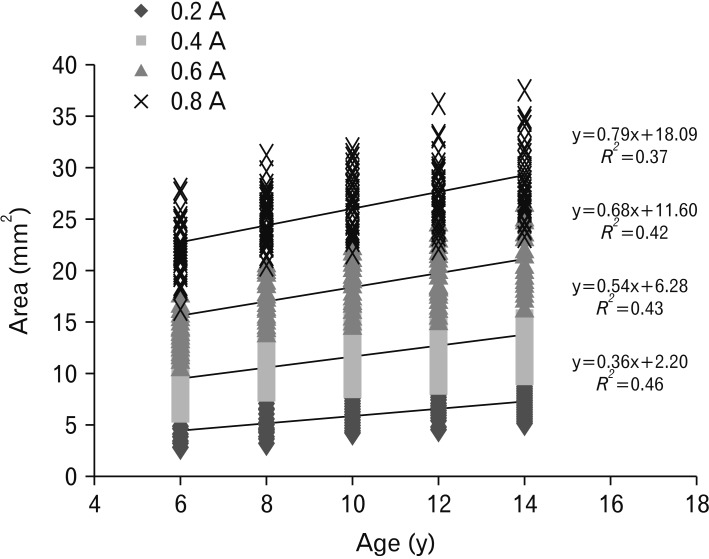 | Fig. 4Comparison of the regression lines for the 6-, 8-, 10-, 12-, and 14-year-old age groups and maxillary first molar wear quantified by the area of each offset plane 0.2, 0.4, 0.6, and 0.8 mm (offset plane, apical plane created from buccal occlusal plane 0.2 A, 0.4 A, 0.6 A, 0.8 A).
|
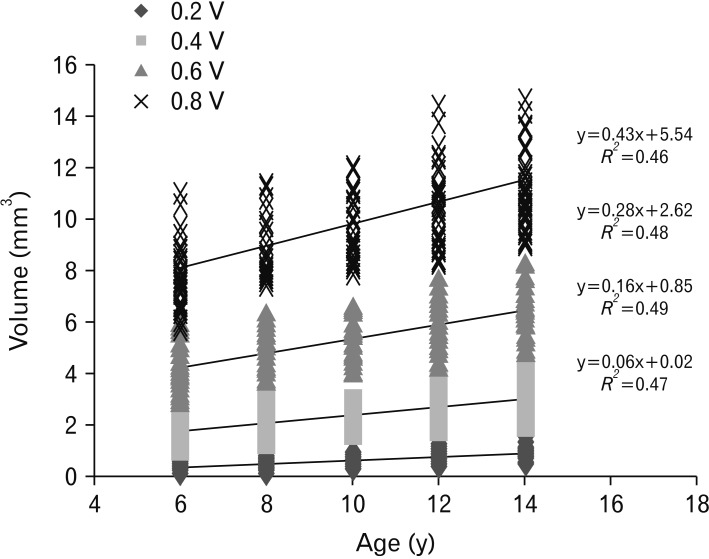 | Fig. 5Comparison of the regression lines for 6-, 8-, 10-, 12-, and 14-year-old age groups and maxillary first molar amount of wear quantified by the volume of each offset plane 0.2, 0.4, 0.6, and 0.8 mm (offset plane, apical plane created from buccal occlusal plane 0.2 V, 0.4 V, 0.6 V, 0.8 V).
|
Table 5
Correlation coefficients and regression equations for area measurements of the maxillary first molar
![]()
Table 6
Correlation coefficients and regression equations for volume measurements of the maxillary first molar
![]()
BCPH results
The results of BCPH age group comparisons showed that the 6-year-old age group significantly differed from the 8-, 10-, 12- and 14-year-old groups (P<0.05). However, there were no significant differences found when comparing the 8 to 10, 8 to 12, 8 to 14, 10 to 12, 10 to 14 and 12 to 14 age groups.
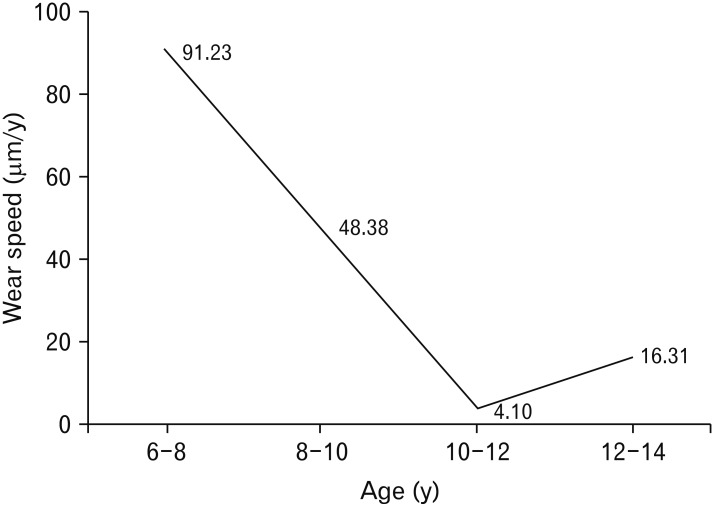
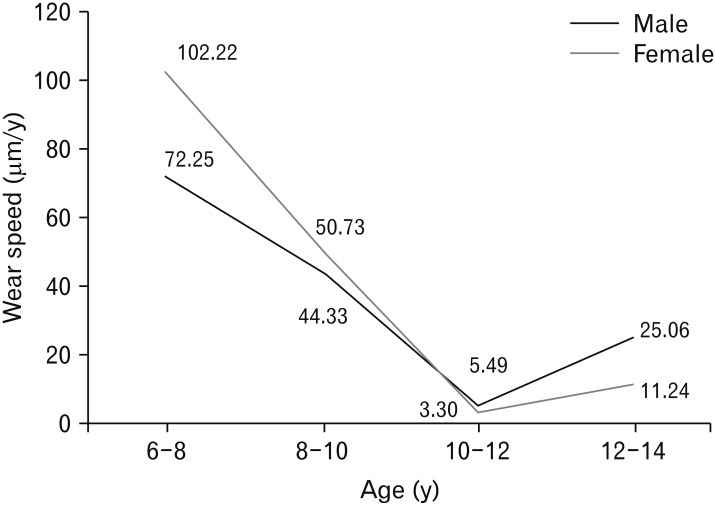
The results of comparing the speed of wear via the BCPH showed the following differences in wear speeds by age group (Fig. 6): 91.23 µm/y from 6 to 8 years; 48.38 µm/y from 8 to 10 years; 4.10 µm/y from 10 to 12 years; and 16.31 µm/y from 12 to 14 years. The speed of wear decreased gradually from age 6 to 12 and increased slightly from 12 to 14. The results of comparing speed of wear via BCPH according to sex are shown (Fig. 7).
Go to :
Discussion
In this study, the amount of maxillary first molar wear in 3D virtual models of Korean subjects was quantified using area, volume and BCPH measurements and compared in the 6-, 8-, 10-, 12- and 14-year-old age groups.
The surface area of a worn tooth increases over a long period of time, generally in proportion to their exposure time within the oral cavity [22]. This kind of tooth wear is considered to be a natural and physiological phenomenon and is dependent on age. According to the research of Smith and Robb [23], tooth wear is a common condition that occurs in approximately 97% of the population. Tooth wear is a complex and multi-factorial problem. For this reason, diagnosis and management is difficult [24].
The permanent maxillary first molar is considered to be the tooth representative of structural loss in patients because it is the first of the permanent teeth to erupt, making it the center of occlusion, a function it fulfills for longer than that of any other tooth. Also, tooth wear measurement of first molar is useful for estimation of the age [25]. In the case of the posterior teeth especially, although wear occurs on the buccal, lingual, contact and occlusal surfaces at the same time, generally the biggest change over time is seen on the occlusal surface. Therefore, this study focuses on measuring wear of maxillary first molar occlusal surface in analyzing the degree of tooth wear.
Generally, the distolingual cusp of the maxillary first molar is considered to be the smallest and lowest part of the tooth and therefore can be excluded from wear calculations. The next three highest points on the occlusal surface serve as the reference points to representing the amount of wear when compared to the lowest point of central pit on the same tooth, the area expected to be the most stable during the wearing process. Measurement of the virtual buccal occlusal plane takes into account that the functional aspects of maxillary first molar are the lingual cusps, which are rounder and 0.5 mm lower than the buccal cusps. Therefore, the area, volume, and the height of virtual buccal occlusal plane were measured utilizing the virtual buccal occlusal planes formed by these features. Also, the accuracy and reliability of the data obtained during our research on tooth wear was high to assess the longitudinal studies.
In qualitative phase classification of the degree of tooth wear, standards on enamel loss and dentin exposure are generally used, but the difference between stages is not clear and standardized training and calibration of investigators is necessary [26]. On the other hand, in quantitative analysis, an objective tool is used to measure the degree of wear, which makes it possible to gather accurate information about wear and report results as numerical values [1921]. Also, it is accessibility or accuracy of the measuring tools can be complemented [2728]. Moreover, it is possible to perform the 3D analysis of wear using virtual vector or planes, which is not possible when using traditional measurement methods [18]. Therefore, in this study we were able to compare aspects of wear in different age groups (6, 8, 10, 12, and 14 years old) using a quantitative wear index consisting of 3 parameters, namely area, volume, and BCPH, all within a 3D virtual model.
Among the post hoc Duncan's tests, 0.2 V, 0.4 V, and 0.6 V were found to precisely classify the subjects by age into five groups. The linear regression analysis results showed that the range of coefficients of determination (R2) was 0.37 to 0.46 for area and 0.46 to 0.47 for volume. The volume parameters demonstrated a stronger linear relationship between the amount of wear, as quantified by area and volume, and age. Similarly, Delong reported that the preferred parameter for measuring wear is volume [29].
In addition, the linear regression analysis results confirmed that the measurements obtained by 0.2 A and 0.4 V were able to show that the increase in wear was dependent on age. The range of the standardized regression coefficient was 0.39 to 0.79 for area and 0.06 to 0.43 for volume. The measurements calculated from 0.8 A and 0.8 V can be considered to be the best parameter for inference of age. According to the regression analysis, the parameters that give good explanation are 0.2 A, 0.4 V and that give good effect are 0.8 A, 0.8 V.
The combination of both horizontal and vertical factors should be considered when perusing a more accurate characterization of the relationship between age and tooth wear [30]. In this study, the area of tooth wear may be termed as a horizontal factor, whereas the volume of wear may be considered to be a vertical factor. It was shown that our approach to the quantitation of wear is a reliable and accurate method for age correlation.
The result of BCPH intergroup comparison by age shows no significant differences, including comparisons between the 8- year- old age group and the 10-, 12-, or 14-year-old age groups as well as between ages 10 and 12, 10 and 14, and 12 and 14 age groups. Bartlett DW confirmed that tooth wear was a slow, minimally progressive process [31]. That is, our results may be due to the restricted age range, from 6 to 14 years, used in our study.
Speed of wear gradually decreased from age 6 to 12, with a modest increased from 12 to 14 years. This result might be due to differential occlusal relationships in regards to timing and sequence of permanent tooth eruption. Generally, mixed dentition begins with permanent tooth eruption after the age of 6 years.
Carlsson et al. [32] described an increase in tooth wear with a decrease in the number of opposing dentition, and Johansson et al. [33] reported that a decrease in the contact point of the posterior teeth led to an increase in wear. No direct correlation has been found between the number of remaining teeth and wear, but the number of occlusal contact points has been shown to be related to an increased wear rate [34]. Mixed dentition, a transition period in which primary and permanent teeth exist together, ends with the replacement of all primary teeth with permanent teeth. The timing of the mandibular second molar eruption is 11 to 13 years of age and is included in the mixed dentition phase; therefore, the increasing speed of wear between 6 and 12 years of age is considered to be related to eruption of mandibular second molars. Also, the speed of wear was the fastest (91.23 µm/y) between ages 6 and 8. According to Lambrechts et al. [35], the average steady-wear rate of the occlusal contact areas was 29 µm/y for molars and 15 µm/y for premolars. The maxillary first molar has three to five major cusps and the largest occlusal surface as compared to any other tooth. The speed of wear was the slowest (4.10 µm/y) between 10 to 12 years of age. During this period, changes in the occlusal area and the bite force occur in concert with the eruption of the mandibular second molar. For this reason, it can be deduced that speed of wear has a tendency to decrease constantly from the age of 6 until it increases at 10 years old. Also, whether tooth wear had proceeded rapidly or naturally can be judged by the wear speed measurement, which helps to determine whether or not treatment is needed.
Regarding the difference in wear speed according to sex, the rate of wear in females was higher than in males from 6 to 8 and 8 to 10 years of age. In contrast, the speed of wear in male was higher than female in the 10 to 12 and 12 to 14 age ranges. Generally, men have higher attrition rates than women [22]. This may be explained by the greater activity of the masseter muscle in men [36]. On the other hand, other studies reported no differences between sexes [37]. In the present study, speed of wear according to sex showed an opposite pattern after 10 years old. However, there seem to be little difference between male and female subjects during the ages of 10 to 14. Therefore, more samples should be collected to refine these results, and future studies should include other factors that were not analyzed in this study.
According to the result of the study, we recognized a trend of increased tooth wear that correlated with aging and confirmed the utility of a clinical index to measure wear that has a meaningful correlation with cusp volume. This study highlights the importance of tooth wear in Children, which may in turn provide valuable data for dental treatment, choosing restorative materials or use of artificial teeth. Moreover, excessive tooth wear can be diagnosed or prevented using a standard for the degree of tooth wear expected at each stage of aging in the children population, thereby aiding in the maintenance of good dentition. It was difficult to collect models from a variety of ages due to the longitudinal nature of this study. An additional limitation is that only maxillary teeth were studied. However, the addition of mandibular and other teeth in models formed from more diverse age groups in future studies is expected to further fine-tune our results.
As age increased, the amount of wear, as quantified by area and volume, also increased.
In the regression analysis, the ranges of coefficients of determination (R2) were 0.37 to 0.46 for area and 0.46 to 0.47 for volume. The volume parameters showed the strongest linear relationship between the amount of wear and age. The present study resulted in the development of two age estimation regression equations: Age (y)=0.36×0.2A+2.20 (R2=0.46) using area and Age (y)=0.16×0.4V+0.85 (R2=0.490) using volume.
The results of speed of wear comparison via BCPH showed the following differences in wear speeds by age group: 91.23 µm/y from 6 to 8 years; 48.38 µm/y from 8 to 10 years; 4.10 µm/y from 10 to 12 years; and 16.31 µm/y from 12 to 14 years. Speed of wear decreased gradually from age 6 to 12, with a modest increase from 12 to 14 years. The wear speed using the BCPH was also compared between sexes. The wear speeds in males were: 72.25 µm/y from 6 to 8 years; 44.33 µm/y from 8 to 10 years; 5.49 µm/y from 10 to 12 years; and 25.06 µm/y from 12 to 14 years. In contrast, the wear speeds in females were as follows: 102.22 µm/y from 6 to 8 years; 50.73 µm/y from 8 to 10 years; 3.30 µm/y from 10 to 12 years; and 11.24 µm/y from 12 to 14 years.
Go to :
 XML Download