

 PDF
PDF ePub
ePub Citation
 Print
Print


INTRODUCTION
Renal cell carcinoma (RCC) is the 14th most common cancer in the world [1] and the most common cancer arising from adult renal parenchyma [2]. Widespread use of abdominal ultrasound and computed tomography (CT) has increased the number of incidentally detected RCCs [3]. These tumors are often smaller and of lower stage. Surgery, either radical nephrectomy (RN) or partial nephrectomy (PN) including the tumor, remains the only curative treatment. After the treatment of RCC, recurrence rates range from 20% to 40% [4]. Local recurrence or metastasis following surgery portends poor prognosis, because RCC is unresponsive to conventional cytotoxic chemotherapy, with 3-year survival rate of 11%–88% [5]. Traditional prognostic factors include tumor size, histological subtype, Fuhrman nuclear grade and tumor stage. Although these factors have correlated well with prognosis following surgery, they seem to be inadequate in predicting which patient will have recurrence in a more contemporary cohort of patients who have tendency to get an earlier diagnosis and treatment.
It is increasingly being recognized that inflammation can affect tumor growth, invasion and metastasis [6]. It has been shown that the synthesis of inflammatory cytokines triggered by the tumor microenvironment alters acute phase reactants and hematological components including serum neutrophil and lymphocyte counts [7]. Platelets have also been shown to be associated with tumor angiogenesis and promote metastasis [8]. Recent reports indicate that increased pretreatment neutrophil-to lymphocyte ratio (NLR) or platelet-to-lymphocyte ratio (PLR) is associated with a worse prognosis in several tumors, including lung, bladder, prostate, breast, colorectal cancer and RCC [9101112]. Typically, these ratios are routinely available and inexpensive, but not well standardized and need to be validated in different patients.
Multitudes of studies have shown that pretreatment NLR and PLR are predictive factors in metastatic RCC patients [13]. A few studies have also investigated NLR as prognostic factor in non-metastatic RCC (NMRCC), but with conflicting results [1214151617181920]. Only one such study was identified with PLR [17]. Also, studies involving only non-metastatic clear cell RCC (NMCCRCC) are rare [141617]. There is skepticism that systemic inflammatory marker, such as NLR and PLR may not be useful predictors of recurrence and progression in localized cancers. Also, if these markers preceded cancer recurrence, it is unclear when they start to manifest, and which cutoff value should be used. This is especially true for RCC, which shows predominantly hematogenous metastases to various organs and is often difficult to predict the timing.
We hypothesized that if NLR and PLR had prognostic value in patients undergoing RN or PN in NMCCRCC, they would have greater value in predicting recurrence than survival. We also thought that these markers could dynamically reflect disease status. The aim of this study was to evaluate the preoperative and follow-up NLR and PLR as prognostic factors for recurrence in NMCCRCC patients. To ensure homogeneity of our results, we limited our subjects to clear cell RCC.
MATERIALS AND METHODS
All patients who underwent RN or PN between March 1995 and December 2014 were systematically searched. Exclusion criteria included benign surgical pathology, nonclear cell type RCC, bilateral tumors, history of other cancer and preoperative treatment. Tumor stage was determined according to the 1997 Union for International Cancer Control Tumor-Node-Metastasis classification of malignant tumors. The clinical and pathological variables recorded included age, sex, body mass index, symptoms at presentation, size of tumor, pathologic tumor stage and Fuhrman nuclear grade. Platelet count, neutrophil count and lymphocyte count were obtained from complete blood count (CBC) with differential. NLR and PLR were calculated by dividing the neutrophil count and platelet count by the lymphocyte count, respectively. Preoperative NLR (pNLR) and PLR (pPLR) were calculated from CBC with differential obtained within 4 weeks of the operation. Presentation was categorized into symptomatic or incidental. After surgery, patients were followed-up every 3 months for the first 2 years, every 6 months for the next 2 years and yearly thereafter. Physical examination, chest X-ray and laboratory test including CBC with differential, serum routine chemistry, serum electrolytes, erythrocyte sedimentation rate, CRP and urinalysis were performed at each visit. Abdominal CT was obtained every 6 months during the first 2 years and yearly thereafter. In patients with local recurrence of distant metastasis (defined altogether as recurrence), NLR and PLR were calculated using the CBC with differential obtained at the time when the recurrence was found as part of periodic follow-up or at the time when patients visited due to symptoms or signs of recurrence. In patients without recurrence, the quasi-recurrence date was calculated by adding the median time to recurrence to the date of the operation. NLR and PLR were calculated from the CBC with differential obtained as part of periodic follow-up within 6 months before or after the quasi-recurrence date, whichever was closer to it. For convenience NLR and PLR at recurrence or quasi-recurrence were collectively named rNLR and rPLR. The study endpoint was recurrence-free survival (RFS). The time to recurrence was defined as the time from RN or PN to the time of radiological detection of recurrence.
To find the best predictive cutoff point for the NLR, several preliminary values incremented or decremented by 0.1 from the median NLR were calculated. Then, Kaplan-Meier curves were created, and the log-rank test was performed to compare the survival between the two groups divided by each preliminary cutoff. The optimal cutoff was defined as the point with the lowest p-value. The same was repeated for the PLR with the increment or decrement by 5. The prognostic significance of various clinical and pathologic variables for RFS was analyzed by Cox regression analysis. SPSS ver. 16.0 (SPSS Inc., Chicago, IL, USA) was used for all statistics. A p-value of <0.05 were considered to be statistically significant in all of the analyses. This study was approved by the Ajou University Hospital Institutional Review Board (IRB, approval number: MED-MDB-18-378). Because of the retrospective design of our study, the IRB waived the need to obtain informed consent from our patients.
RESULTS
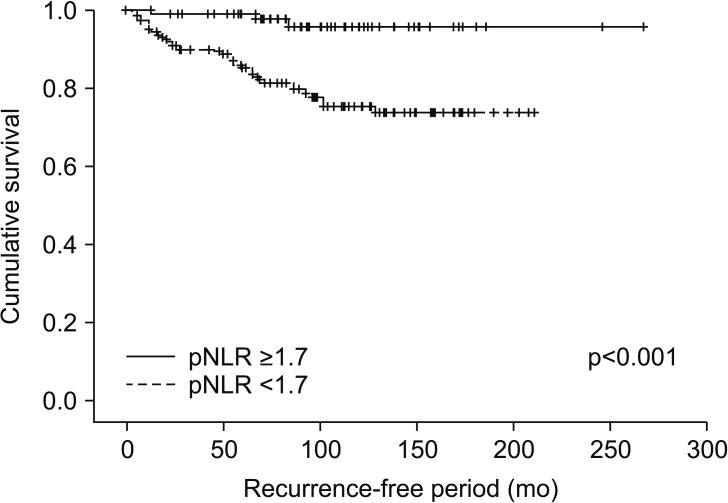
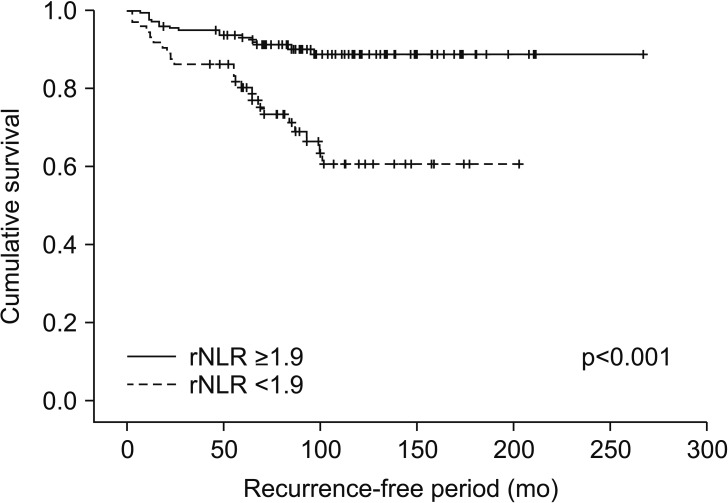
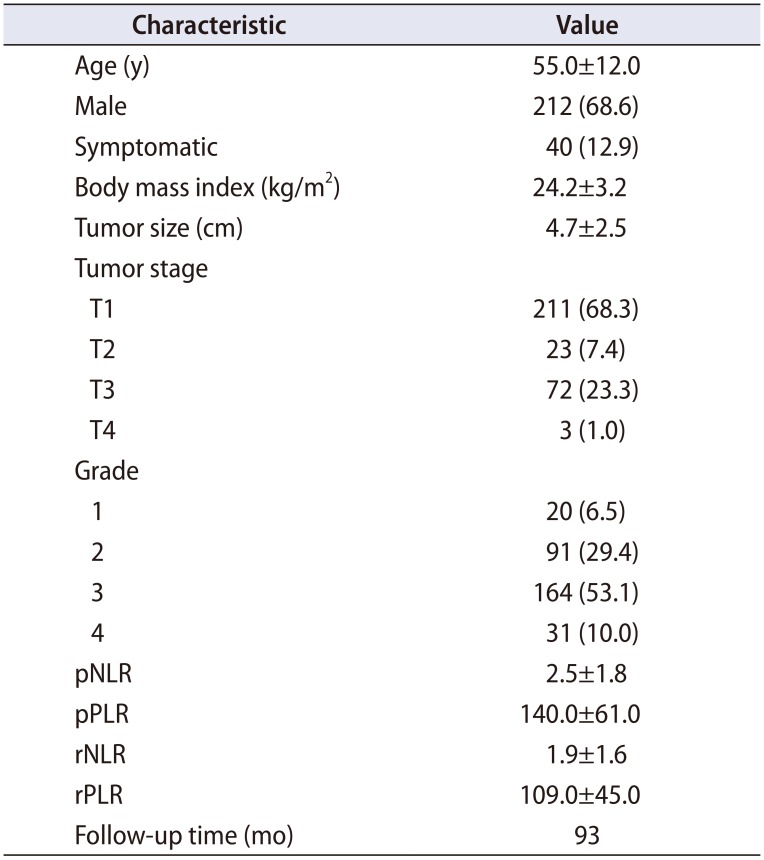
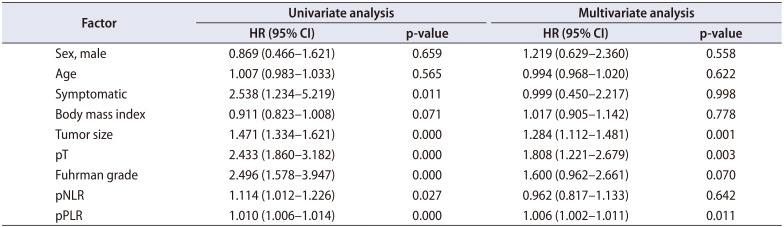
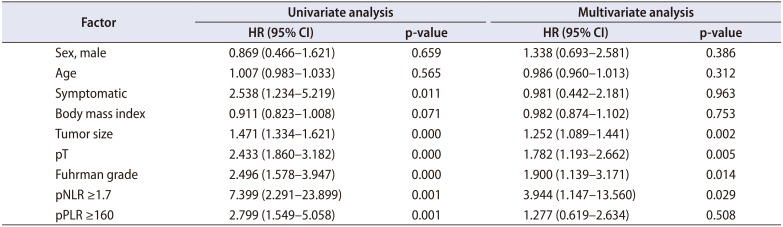
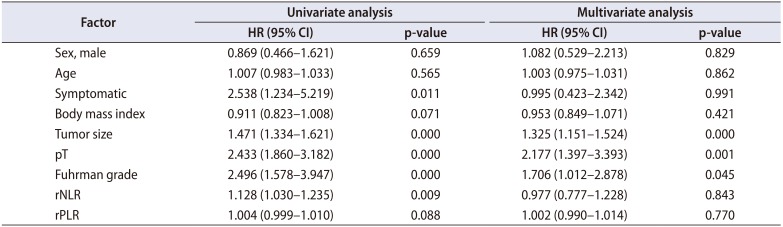
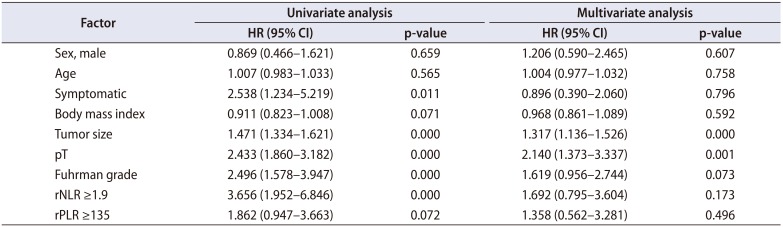
We identified 352 patients who underwent surgery for NMCCRCC. Additionally, 43 patients with less than 12 months follow-up were excluded. Three hundred nine patients were finally included. Table 1 summarizes the characteristics of the study patients. The mean age of the patients was 55 years and 68.6% were male. Only 12.9% were symptomatic at presentation. The mean tumor size was 4.7 cm and pT1 represented 68.3%. The mean pNLR and pPLR were 2.5 and 140, respectively. At the mean 93 months follow-up, 44 patients (14.2%) developed recurrence and the median time to recurrence was 42 months. Of these 44 patients, 40 had CBC with differential at recurrence available. Of 308 patients without recurrence, 208 had CBC with differential within 6 months before or after the quasi-recurrence date available. For these 248 patients, the mean rNLR and rPLR were 1.9 and 109, respectively. Fig. 1 shows Kaplan-Meier curves of patients divided into low pNLR and high pNLR groups by cutoff of 1.7. Only 3 patients had developed metastasis in the low pNLR group. The 5-year RFS of low and high pNLR groups were 99.0% and 85.3%, respectively. At 10 years, the RFS of the low pNLR group remained stable at 95.7% whereas that of the high pNLR group dropped to 75.3%. The difference in survival was the highest at this cutoff with p<0.001. Fig. 2 shows Kaplan-Meier curves of patients divided into low pPLR and high pPLR groups by cutoff of 160. The 5-year RFS of low and high PLR groups were 94.7% and 77.6%, respectively. At 10 years, RFS of low and high PLR groups were 86.5% and 70.2%, respectively. The difference in survival was the highest at this cutoff with p<0.001. Fig. 3 shows Kaplan-Meier curves of patients divided into low rNLR and high rNLR groups by cutoff of 1.9, at which the difference in survival was the highest with p<0.001. When patients were divided into low rPLR and high rPLR groups, the RFS was not significantly different. Table 2 shows the result of cox regression analysis with pNLR and pPLR as continuous variables. In the univariate analysis, symptom at presentation, tumor size, pathologic tumor stage, Fuhrman grade, pNLR and pPLR were significant prognostic factors for RFS. In the multivariate analysis, tumor size, pathologic tumor stage and pPLR were independent prognostic factors for RFS. Table 3 shows the result of cox regression analysis with pNLR and pPLR as dichotomous variables. In the multivariate analysis, tumor size, pathologic tumor stage, Fuhrman grade and pNLR ≥1.7 were independent prognostic factors for RFS. Although rNLR was a significant prognostic factor for RFS in univariate analyses, both rNLR and rPLR were not independent prognostic factors for RFS in multivariate analyses when they were substituted for pNLR and pPLR, respectively (Tables 4 and 5).
DISCUSSION
Our study has shown that both pNLR and pPLR have an independent power to predict recurrence in NMCCRCC patients. In the literature, only 1 out of 3 studies on NMCCRCC patients has shown that pNLR and pPLR are independent prognostic factors for RFS [17]. Our study adds one more in favor of NLR and PLR as prognostic factors in NMRCC. In terms of consistency, PLR that was significantly associated with RFS as a continuous variable, would be more reliable than NLR. However, NLR appears to be more practical as cutoff points are easier to apply in a clinical setting than multiplying the hazard ratio by unit of difference to calculate the risk as with a continuous variable. Our NLR cutoff point of 1.7 is lower than most other studies involving metastatic cancers as well as studies with NMRCC. As mentioned earlier, this value was not arbitrary, but is the result of trying to find the best cutoff based on multiple trials and errors. Because increased neutrophil counts in cancer patients are explained as a result of body interactions with the tumor microenvironment, higher neutrophil counts can be expected in proportion to cancer cell activity. Hence, our low cutoff value seems well explained by the fact most of our patients had low volume nonmetastatic cancer and worst cases had micrometastasis.
One of the strengths of our cohort is a relatively long follow-up period with the mean of 93 months. Throughout this long period, the Kaplan-Meier analysis demonstrated diverging RFS curves of low and high pNLR groups, with high pNLR group showing recurrences well beyond 5 years till 10 years postoperatively. This observation has led us to think that some dynamic changes could be demonstrable in NLR and PLR during follow-up that could better reflect cancer recurrence status. Ohno et al. [21] were the first and only investigators to assess dynamic changes in NLR by analyzing postoperative NLR in NMCCRCC patients. In addition to preoperative NLR, they measured NLR at 3 and 6 months postoperatively, but contrary to their expectation, patients with high postoperative NLR fared significantly better than those with low values in terms of RFS. They also measured NLR at recurrence and showed that it was significantly higher than preoperative NLR. However, they did not make any analysis on its influence on survival. In our patients with and without recurrence, we decided to measure NLR and PLR at recurrence and at quasi-recurrence, respectively. We believe that the concept of quasi-recurrence is without precedence and needs further explanation. An appropriate time point to obtain CBC data was needed in the non-recurrence group for comparison with the recurrence group. This time point needs to be far enough from the operation date, impartial, and comparable with the recurrence group. Propensity matching would be a solution, but the idea was abandoned because of too many variables to match. Adding the median time to recurrence of 42 months to the operation date in the non-recurrence group to define the quasi-recurrence date had several consequences that need explanation. First, the effect of the primary tumor on CBC values, if any, has disappeared. Furthermore, all patients were in the same condition in terms of elapsed time, at least theoretically. The downside was that even with the allowance of a window period of 6 months before and after the quasi-recurrence date, many patients dropped out due to inadequate follow-up. However, it must be pointed out that, this approach most likely had major positive impact on the credibility of CBC data, because it can be assumed that some of the dropped-out patients were too sick due to other illnesses to make follow-up visits and thus failed to leave CBC potentially affected by these other illnesses. Moreover, as mentioned earlier, only CBC values obtained as part of periodic follow-up were acceptable and all CBC data ordered by other departments for other reasons were excluded. For the follow-up analysis, this approach left us with 248 out of 309 initial patients, but with CBC potentially less affected by these other illnesses than the initial preoperative values.
As demonstrated in Kaplan-Meier curves, both high pNLR and high rNLR patients showed similar long-term recurrence pattern that continued up to 10 years after surgery. Although pNLR with cutoff value of 1.7 was an independent prognostic factor for recurrence, rNLR with cutoff value of 1.9 was significant only in the univariate but not in the multivariate analysis. However, this does not mean that rNLR is insignificant as a prognostic factor. More important independent prognostic factors such as tumor size, pathologic stage, Fuhrman grade and pNLR are constant, and their significance as prognostic factors will diminish over time. Conversely, rNLR and rPLR are dynamic. In patients with one or more adverse clinicopathological factors, a steadily high or sudden increase in the NLR value beyond the cutoff can be interpreted as a sign of cancer recurrence. This will be especially true for patients past 5 years or more after surgery for whom CT scans are seldom recommended. A de novo increase in NLR in these patients can be used as a reliable indication for performing CT scans.
In our institution, lymphocyte and neutrophil counts are reported as a percentage of total white blood cell counts. A typical CBC with differential in a healthy person will give percentage of lymphocytes, neutrophils and others in the range of 30%–50%, 40%–70%, and 6%–20%, respectively. If we applied the rNLR cutoff of 1.9, a lymphocyte percentage of 30% and below, coupled with a neutrophil percentage roughly double that value, will require further imaging studies to detect metastasis.
The present study has several limitations. Patients may have concurrent morbidity, including infection that can affect the leukocyte counts. This may have significantly affected pNLR and pPLR values, but as shown before, this may not have affected rNLR and nPLR values as much. The concept of quasi-recurrence has not been previously validated and should be further validated through future studies. This was a single institutional study, so the values obtained may not be applied universally. Due to limited number of subjects and a small number of deaths, the prognostic significance of NLR and PLR on cancer-specific and overall survival could not be assessed.
CONCLUSIONS
This study has shown that pNLR and pPLR are independent prognostic factors for RFS in patients with NMCCRCC along with well validated factors such as tumor size, pathologic tumor stage and Fuhrman nuclear grade. Although NLR and PLR at recurrence were not independent prognostic factors for RFS, we propose that postoperative follow-up NLR of 1.9 and higher at any time in patients with one or more adverse clinicopathological factors should prompt radiologic evaluation for possible metastasis.

 XML Download