

 PDF
PDF ePub
ePub Citation
 Print
Print


INTRODUCTION
The prevalence of obesity in Korea has increased 10-fold over the past 2 decades along with the change to western-style diet, spurred by the rapid economic growth since the 1990s. Meanwhile, the age of obesity onset has been falling. The prevalence of obesity in school age (6–18 years) was 15.3% of boys and 11.1% of girls in 2016, following a steady increase over the past six years. The boys' obesity rate was 9.7% and 19.1%, respectively, in the age groups 6–11 and 12–18 years, which were higher than 6.7% and 14.3%, respectively, found among girls in the same age groups.1 In other words, 1 of 10 children of school age becomes obese when they are still growing. In particular, 80%–85% of those with severe obesity and insulin resistance are likely to have obesity as adults and to develop complications such as maturity-onset diabetes of the young, metabolic syndrome, and cerebrovascular disease. Therefore, the identification of the characteristics of childhood obesity and specific risk factors is crucial for the management of childhood obesity and prevention of adult obesity as well.2
To prevent childhood obesity and lower the risk of associated metabolic diseases, a broad spectrum of risk factors needs to be identified in relation to lifestyle habits such as eating habits and exercise, family history, as well as genetic and environmental aspects. Among factors involved in obesity development, environmental factors account for 40%–60% of all obesity cases, followed by genetic factors (30%) and social factors (10%–20%). In addition, parental obesity is the key determinant of obesity in children aged 7–9 years. Thus, the genetic impact on obesity development is considerably high.3 In a previous study using the Korean National Health and Nutrition Examination Survey data,4 the daily sodium intake of Koreans aged 8 years or older was 4,866.5 mg/day. Although the 8–18-year age group showed the lowest sodium intake level, almost all age groups consumed more than 3,800 mg of sodium per day, which is excessive because it is 2–3 times the upper intake limit. While earlier studies have concentrated on the effects of increased sodium intake on cardiovascular diseases such as hypertension, there is no research from Korea that examined obesity prevalence rates and the associated mechanism.
Given the negative association between childhood obesity and high sodium intake, our research was focused on a variety of environmental factors including metabolic and dietary parameters, particularly sodium intake, by tracking salt-sensitive genes.5 Recently, an earlier study has identified 10 salt-sensitive genes including angiotensin-converting enzyme (ACE) and α-adducin-1 (ADD1) apart from those showing no variants (HSD 11β-2 and ENac SNPs) in obese Korean children using genome-wide association studies.6 ADD1, as one of the cytoskeleton family members, is located at the chromosomal position 4p16.3 and acts as a membrane cytoskeleton protein supporting the plasma membrane, thereby increasing bonding strength with physiological intracellular Ca2+/calmodulin. It also serves as a substrate for protein kinase A and C.7 Therefore, abnormal phosphorylation, genetic variations and alterations in cellular function such as alternative adhesion can contribute to disease development such as hypertension, obesity, and cancer.8
In the human body, polymorphisms of the ADD1 gene have been reported as adducin ADD1-Gly460Trp (rs4961), ADD1-Ser586Cys (rs4963), ADD2-Cys1967Thr (rs4984), and ADD3-IVS11+386Ala> Gly (rs3731566) and so forth.7 Similar to ACE gene polymorphism, the ADD1 460Trp allele affects cardiovascular disease, stroke, arteriosclerosis, myocardial infarction, and renal disease. While ADD1 Ser617Cys polymorphism is known to be a risk factor for hypertension in Asians, the ADD2 (rs4983) variant is involved in inflammatory diseases such as lupus erythematosus, and the ADD3 gene is associated with nervous disorders, fatty liver disease, biliary disease, and cancer.9 The most well-studied ADD1 gene polymorphism is a substitution of Gly for Trp at amino acid residue 460 (G460W [rs4961]). As a result, when compared with the wild-type (460Gly), the ADD1 460Trp allele is more closely related to hypertension onset in conjunction with increases in Na+/K+ pump activity in renal tubular and sodium reabsorption and decreases in renin concentration and activity and intracellular (red blood cells) sodium concentration.10 However, investigations into a direct association between the ADD1 gene and obesity, obesity biomarkers or environmental/dietary factors have been severely lacking.
Therefore, this study aimed to compare indicators of obesity and metabolic activity according to gender, obesity level and ADD1 polymorphism in children aged 8–9 years and to provide scientific evidence regarding the causes of childhood obesity and to prevent progression to obesity during adulthood.
MATERIALS AND METHODS
1. Participants
This study was conducted in collaboration with G Hospital as co-investigator and the G Public Health Center as a body measurement provider during the period from 2007 and 2009. Third-grade students (aged 8–9 years) attending 8 elementary schools, located in Guro-gu, Seoul, voluntarily participated in this study. This study was approved by the Institutional Review Board of the above-mentioned hospital (#GR0837-001). Upon receiving informed consent from all the participants and their parents, complete blood count and genetic testing were performed. A total of 2,070 students (1,046 boys and 1,024 girls) underwent measurements of height, weight and waist circumference to assess obesity. Blood samples were collected to analyze lipid, insulin resistance-related factors, cytokine, and ADD1 polymorphism, and a questionnaire survey was conducted to analyze environmental factors. Dietary assessment was analyzed using 3-day dietary data (2 weekdays and 1 weekend).
2. Anthropometric measures and obesity criterion
Each participant in light clothing was weighed while maintaining a straight upright position and waist circumference was measured on the site 3 cm above the umbilicus while the respective skin was not pressed. After more than 5 minutes of rest, both systolic and diastolic blood pressures were measured. Obesity was assessed using the average weight range (50th percentile body mass index [BMI] value) for the height of Korean children, published by the Korean Pediatrics Society in 2007, and the Broca index. Obesity was defined as BMI ≥120%, and normal weight was defined as BMI <120%.
3. Biochemical analysis
After more than 12 hours of fasting, blood samples were collected for biochemical and genetic polymorphism analysis. Blood samples were collected into plain tubes and ethylenediaminetetraacetic acid and centrifuged at 3,000 rpm for 15 minutes at 4°C to separate serum and plasma from the blood. Blood cells were stored at −80°C until the time of analysis. Serum total cholesterol (TC), triglyceride (TG), high-density lipoprotein cholesterol (HDL-C), aspartate aminotransferase, and alanine aminotransferase were measured using a chemistry analyzer (Ekachem DTSC module; Johnson & Johnson, New Brunswick, NJ, USA). Low-density lipoprotein cholesterol (LDL-C) level was calculated using the Friedewald formula. Fasting glucose was quantified using a measuring kit, designed for enzymatic and colorimetric determination of glucose, and analyzed using the chemistry analyzer (Ekachem DTSC module; Johnson & Johnson). Serum insulin was measured using the electrochemiluminescence immunoassay method (Roche Diagnostics, Berlin, Germany). Homeostasis model assessment of insulin resistance was calculated using the formula proposed by Matthews et al. Serum concentrations of the following cytokines were measured: vaspin (AdipoGen, Incheon, Korea), visfatin (AdipoGen), adiponectin (AdipoGen), RBP4 (AdipoGen), tumor necrosis factor-α (TNF-α; Chyman Chemical Co., Denver, CO, USA), CRP (Beckmann Coulter, Indianapolis, IN, USA). For the determination of ADD1 polymorphism, genomic DNA (LaboPass™ Blood Mini Kit; Cosmo Genetech, Seoul, Korea) were extracted and stored at −80°C until the time of experiment. ADD1 SNP G460W gene polymorphism was then determined using the SNaPshot method (forward primer, AGAAGACAAGATG GCTGAACTC; reverse primer; TAATGTTCGTCCACACCTTA GTC).
4. Dietary assessment
The 24-hour dietary recall interview was performed to assess dietary intake over 3 separate days (2 weekdays and 1 weekend). During the interview, parents were asked to report the types and amounts of all foods consumed. When the collected data were insufficient, respective children were asked additional questions. Collected data were analyzed using SW (Can-pro 4.0; The Korean Nutrition Society, Seoul, Korea) to determine the average daily intake. Given its role in determining obesity, total calorie intake was adjusted for nutrient intake values using the energy adjustment method.
5. Statistical analysis
Statistical computations were performed using SPSS version 23.0 (IBM Corp., Armonk, NY, USA) to describe all variables measured for each group as the mean±standard deviation (SD) and mean±standard error (SE). The chi-square test was used to assess allelic and genotype distribution of gene polymorphisms. Participants were divided into four groups according to obesity and ADD1 alleles, and anthropometric measures, complete blood count, serum cytokines and nutrient intake of each group were expressed as mean±SD. Each nutrient was adjusted for calories to be used in the analysis. For between-group comparisons, analysis of variance was performed. Duncan's multiple range test was used for post-hoc analysis. The significance level was set at α=0.05. To identify the correlation between ADD1 gene polymorphism and nutrients (Na and K), linear regression analysis was performed, and the 95% confidence interval was used to determine statistical significance.
RESULTS
1. Comparisons of anthropometric measures, biochemical profile and dietary intake according to gender
A total of 2,070 third grade students (1,046 boys and 1,024 girls) participated in the study. On the basis of the obesity criterion (BMI ≥120%), the prevalence of obesity was 15.6% (163/1,046) in the boy group and 11.9% (122/1,024) in the girl group. The boy group also showed significantly higher values in anthropometric measures (height, weight, and waist circumference) and systolic blood pressure than their girl counterparts, whereas both groups exhibited no differences in TC and serum fasting insulin concentration regarding lipid, glucose and insulin profile. Visfatin levels were significantly higher in the boys group while there was no significant difference in vaspin, RBP4, TNF-α, adiponectin and CRP between the 2 groups. Dietary intake significantly increased in the boy group, compared with the girl group. In particular, total calories, carbohydrate, proteins, lipids, sodium, and potassium demonstrated a significant difference between the 2 groups (Table 1).
Table 1
The characteristic of anthropometry, biochemistry, cytokines and dietary variables by gender
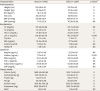
Data shown are mean±SD.
BMI, body mass index; WC, waist circumference; SBP, systolic blood pressure; DBP, diastolic blood pressure; NS, no significance; TC, total cholesterol; TG, triglyceride; HDL-C, high-density lipoprotein cholesterol; LDL-C, low-density lipoprotein cholesterol; FBS, fasting blood sugar; HOMA-IR, homeostasis model assessment of insulin resistance; TNF-α, tumor necrosis factor-α; CRP, C-reactive protein; SD, standard deviation.
*Significance as determined by t-test.
![]()
2. Comparisons of obesity distribution according to ADD1 gene polymorphism
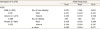
In the analysis of body fat distribution based on BMI levels, both the normal-weight and obese groups showed no significantly different distribution in wild-type and mutant alleles. In the obese group, the levels of obesity, waist circumference and blood pressure were high, regardless of gender. However, no significant differences were found between the groups with respect to types of the gene (wild-type or mutant) and gender (Table 2).
Table 2
Frequencies of common alleles and genotypes according ADD1 of this study
![]()
3. Comparisons of anthropometric measures, biochemical profile, and dietary intake according to BMI levels
The selected anthropometric measures, lipid, glucose, and insulin profile (inflammatory factors) and dietary intake were compared between normal weight and obese children in both boy and girl groups (Tables 3 and 4). The normal weight and obese groups showed significant differences in most of the anthropometric measures and lipid, glucose, and insulin profile. That is, both boy and girl students showed a positive correlation between their obesity and the said measurements and profile components (weight, waist circumference, and systolic blood pressure as well as TC, TG, LDL-C, FBS, and insulin). A negative correlation was found between obesity and HDL-C level. In the boy group, all serum inflammatory factors (vaspin, visfatin, RBP4, TNF-α, adiponectin, and CRP) revealed no significant differences according to BMI levels. Obese girls had higher visfatin levels than normal weight girls. However, the normal weight and obese children in the boy group did not differ significantly in visfatin levels. Nutrient intake was higher in normal-weight children than their obese counterparts in the boy group. Sodium intake in the obese boy group was significantly high at approximately 3,700 mg/day, whereas the sodium/potassium ratio was high in the obese girl group.
Table 3
Comparisons of anthropometric measures, biochemical profile, and dietary intake according to normal weight and obesity group by ADD1 gene polymorphism in boy group
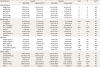
Data shown are mean±SD.
OI, obesity index; ADD1, α-adducin 1; WC, waist circumference; SBP, systolic blood pressure; DBP, diastolic blood pressure; NS, no significance; TC, total cholesterol; TG, triglyceride; HDL-C, high-density lipoprotein cholesterol; LDL-C, low-density lipoprotein cholesterol; FBS, fasting blood sugar; HOMA-IR, homeostasis model assessment of insulin resistance; TNF-α, tumor necrosis factor-α; CRP, C-reactive protein; SD, standard deviation.
*Significance as determined by analysis of variance by obesity and ADD1 polymorphism; †significance as determined by t-test among normal weight and obesity group; ‡significance as determined by t-test for ADD1 wild and mutant group.
![]()
Table 4
Comparisons of anthropometric measures, biochemical profile, and dietary intake according to normal weight and obesity group by ADD1 gene polymorphism in girl group
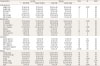
Data shown are mean±SD.
OI, obesity index; ADD1, α-adducin 1; WC, waist circumference; SBP, systolic blood pressure; DBP, diastolic blood pressure; NS, no significance; TC, total cholesterol; TG, triglyceride; HDL-C, high-density lipoprotein cholesterol; LDL-C, low-density lipoprotein cholesterol; FBS, fasting blood sugar; HOMA-IR, homeostasis model assessment of insulin resistance; TNF-α, tumor necrosis factor-α; CRP, C-reactive protein; SD, standard deviation.
*Significance as determined by analysis of variance by obesity and ADD1 polymorphism; †significance as determined by t-test among normal weight and obesity group; ‡significance as determined by t-test for ADD1 wild and mutant group.
![]()
4. Comparisons of anthropometric measures, biochemical profile, and dietary intake according to ADD1 gene polymorphism
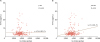
The ADD1 gene polymorphism was divided into wild and mutant alleles, and anthropometric measures, lipid, glucose, and insulin profile, and dietary intake were analyzed and compared (Tables 3 and 4). The boy and girl groups showed no significant differences in the above-mentioned parameters with respect to ADD1 gene polymorphism. However, while serum TNF-α significantly increased in the boy carrying the ADD1 W allele compared to those with the normal G allele, sodium intake was significantly higher in the girls carrying the normal G allele compared with those with the W allele. Serum CRP concentration was significantly higher in the obese group carrying the normal G allele regardless of gender. When this result was further evaluated by regression, CRP concentration significantly increased with increasing sodium intake in both obese boys and girls carrying the ADD W allele. Serum TNF-α also showed a significant linear association with sodium intake in obese boys carrying the ADD1 W allele. In the girls group, there was no difference in these two inflammatory accelerators with respect to sodium intake. Further analysis of serum TNF-α, found to be positively correlated with sodium intake in the boy group, revealed that TNF-α concentration was significantly elevated in parallel with increasing sodium intake in the ADD1 mutant group (Fig. 1A and B).
DISCUSSION
Childhood obesity is considered a complex disease associated with genetic (parental) and environmental factors including eating habit and lifestyle. This underscores the importance of the research on dietary patterns, varying according to individual genetic specificity, diet and living environment.11 According to a previous systematic literature review on the association of childhood and adolescent obesity with dietary risk factors,12 the consumption levels of food were higher in the obese group, compared with underweight and normal-weight groups. Among nutrients, thiamine and iron showed the most significant differences between the obese and normal weight groups. However, no significant difference was found in all nutrients and dietary intake with respect to obesity. In addition, the average daily sodium intake was reported at 3,200 mg (salt 8.1 g) in 9-year-old children between 2007 and 2012,13 showing little difference with that consumed by Korean adults and exceeding the World Health Organization-recommended daily intake (2 g/day).14
Sodium is one of the essential minerals for the body with the ability to regulate the pH level of body fluids and blood volume, maintain osmotic pressure equilibrium and muscular excitability and stimulate neurotransmission. Sodium in the body also affects in vivo absorption of glucose and amino acids as part of its contribution to nutrient absorption. However, excess salt intake has been reported as a risk factor for cardiovascular diseases such as blood pressure increase (hypertension) and fluid accumulation. Its association with increases in complex diseases such as obesity, characterized by chronic inflammation, has been recently reported.1516 It is also reported that the high prevalence of hypertension and stomach cancer is attributed to high salt diet despite increased calcium intake. In western countries, the increase in childhood obesity is reportedly associated with increased consumption of high-density sugar-sweetened beverage, which children drink to quench thirst induced by high salt intake. As a result, high dietary salt intake increases the consumption of high-density sugar-sweetened beverage and carbonated beverage, which in turn boost the risk of developing renal calculi, osteoporosis and subsequently heart disease.17
On the other hand, according to clinical meta-analysis on high sodium intake, blood pressure responses to changes in sodium intake vary among individuals.1819 Such salt-sensitivity tends to increase with age and in the presence of type 2 diabetes. However, individual genetic traits are considered to be mainly involved.20 One of the characteristics of high salt sensitivity is increased sodium reabsorption into the kidney. Recent studies have reported a significant correlation between ADD gene polymorphism and salt sensitivity in blood pressure given that the former is involved in Na/K-ATPase activities.10 In a genome-wide association studies performed to determine the association between salt sensitivity genes and obesity, Lee et al.5 identified 10 genes: ACE, angiotensinogen (AGT), ADD1, cytochrome P450 family 11-subfamily β-2 (CYP11β-2), G-protein b3 subunit (GNB3), G protein-coupled receptor kinases type 4 (GRK4 A142V, GRK4 A486V), 11β-hydroxysteroid dehydrogenase type-2 (HSD 11β-2), neural precursor cell-expressed developmentally downregulated gene 4-like (NEDD4L), solute carrier family 12 (sodium/chloride transporters)-member 3 (SLC 12A3), and ENac. Among these genes, SLC 12A3, ACE, and GRK4 A486V were found to be involved in obesity development in men, and CYP11β-2 and GRK4 A486V were involved in obesity development in women. Carriers of the ADD1 460Trp allele were more prone to blood pressure increase than those carrying the normal allele, and such a case is defined as salt-sensitive hypertension.21 The risk factors that manifest in the presence of salt-sensitive hypertension include insulin resistance, abnormal cellular signal transduction, inflammatory immune response, renal dysfunction, increase in activity of renin-angiotensin-aldosterone system (RAAS), oxidative stress, all of which are also risk factors for obesity. Hence, the involvement of ADD1 polymorphism in obesity is considered.22 Although a significant association between high salt sodium intake and adult obesity was reported in race-related studies, the effects of high salt intake on childhood obesity have not been clearly established.
Among hypertension risk factors, insulin resistance, abnormal cellular signal transduction, and oxidative stress, which are mainly developed in obese people with inflammatory immune response, are more likely to be associated with ADD1 polymorphism.5 As candidate genes involved in causing obesity, more than 200 genes are discussed including β3-AR, leptin, uncoupling proteins (UCP), TNF-α, peroxisome proliferator-activated receptors (PPARs) and fatty acid binding proteins (FABP).
A previous study reported a positive correlation between high sodium intake and TNFα concentration regardless of obesity when investigating the association of dietary salt intake with obesity and inflammatory factors in adolescents aged 14–18 years.23 In another study on the cellular unit, increasing sodium concentration was found to promote T-cell differentiation and TNFα expression, inducing apoptosis.24 In addition, high sodium intake resulted in an increased inflammatory response in tissues and aggravated autoimmune disease in a mice-based study.25 A study involving patients with hypertension and myocardial infarction reported the association of high sodium intake with CRP and TNF-α.2627 After 7 days of high salt intake, serum TNF-α rose in the salt-sensitive group with normal blood pressure and the sodium restricted group. However, no change in CRP levels was observed in these two groups.28 When sodium intake was restricted to 2 g/day for 16 weeks, significant decreases in CRP, TNF-α and interleukin (IL)-6 were found without significant changes in blood pressure.29 Although there is no study addressing a direct association between the ADD1 gene and inflammatory markers, our preliminary study revealed that elevated sodium intake led to increased fatty acid and TG synthesis, which consequently promoted increases in inflammatory markers including TNF-α, cyclooxygenase-2, monocyte chemoattractant protein-1, IL-6 and IL-17A, and RAAS factors, which increased nearly twofold (data not shown). In the present study, we confirmed a positive correlation between ADD1 variants and hypertension and obesity risk factors, albeit indirectly. The findings of this study suggest the need for a complex approach toward personalized treatment on the basis of individual genetic specialties because of the significant effects of dietary patterns and environmental factors including exercise.
The limitations of the present study include the lack of composite effects that can arise from genetic interactions because we found no significant changes in obesity for different gene polymorphisms although the ADD1 gene is one of 9 target genes identified in an earlier study. Obesity results from a composite interaction of multiple genes rather than single gene whereby obese patients carrying multiple gene variants are prone to developing the yo-yo effect after weight control programs. Therefore, future studies are necessary to explore the complex interactions among candidate genes.14 Second, a total of six inflammatory markers such as TNF-α and CRP were identified in 100 participants randomly selected from a total of 2,070 participants, indicating a small subsample size. Serum TNF-α and CRP that are associated with sodium intake need to be intensively measured in future studies.
In conclusion, the effects of sodium intake are varied among individuals because they are influenced by environmental factors related to obesity and salt-sensitive gene polymorphisms. Hence, the control of sodium intake is crucial for obese children carrying salt sensitive gene variants in consideration of their high potential for developing complex severe obesity, compared with normal weight counterparts, as a consequence of genetic and environmental factors, which includes high salt diet.
 XML Download