

 PDF
PDF ePub
ePub Citation
 Print
Print


INTRODUCTION
Ventricular and stroke volumes are crucial in planning the treatment of and monitoring repaired tetralogy of Fallot. Because two-dimensional (2D) simplified contouring and disc summation methods have technical limitations in ventricular volumetry, alternative methods, such as threshold-based and knowledge-based segmentation methods, have recently been advocated (12345678910). In particular, threshold-based segmentation is considered effective and highly reproducible in separating the ventricular cavity from the myocardium along complex endocardial contours (34678910).
The three-dimensional (3D) volumetric version of threshold-based segmentation is recommendable as it can minimize the error of a 2D analysis by approximately 20% (11). Therefore, 3D threshold-based segmentation using 3D image data from computed tomography (CT) (1213141516) or magnetic resonance imaging (MRI) (17) may provide highly accurate and reproducible ventricular and stroke volumes. However, 3D whole-heart MRI could not provide accurate results because the end-diastolic (ED) data were acquired ahead of optimal timing (17).
In contrast, CT does not have such a timing problem and generally demonstrates higher image quality with higher spatial resolution and no MRI-specific artifacts. A semiautomatic segmentation method is considered a good strategy because most of the fully automated segmentation methods often require additional manual correction (1819). Although it is promising, the use of semiautomatic 3D threshold-based segmentation and a commercially available workstation needs to be validated for a CT dataset. Therefore, the purpose of this study was to assess the accuracy and potential bias of CT ventricular volumetry using semiautomatic 3D threshold-based segmentation in patients with repaired tetralogy of Fallot, and to compare them to those of the 2D method using MRI.
MATERIALS AND METHODS
The local Institutional Review Board approved this retrospective study and waived the need for informed consent.
Study Population
Between September 2007 and January 2018, 43 consecutive patients with repaired tetralogy of Fallot underwent cardiac CT and cardiac MRI without any surgical or interventional procedure between the two tests that were performed within 3 years. Cardiac CT was requested when detailed anatomic information, such as that on the peripheral pulmonary vessels and coronary arteries, would be beneficial for patients. Eleven patients were excluded for the following reasons: mitral or tricuspid regurgitation greater than grade 1 on echocardiography between the cardiac CT and MRI examinations (n = 5), substantial cardiac shunt flow on echocardiography or cardiac MRI (n = 2), functional single ventricle (n = 2), incomplete phase-contrast MRI study (n = 1), and severe ventricular hypertrophy that rapidly developed between the cardiac CT and MRI examinations (n = 1). Finally, 32 patients (median age at CT examination, 17.5 years; age range, 7–36 years; 23 males and 9 females) were included in this study. Intervals between the two tests were 1.2 ± 0.9 years (range, 1 day–2.9 years); cardiac MRI was initially performed in 30 patients and cardiac CT was initially performed in two. Body surface areas (m2) at both examinations were recorded for each patient via electronic medical records to calculate the indexed volumetric parameters.
Cardiac CT
Electrocardiography (ECG)-synchronized cardiac CT was performed by using a second-generation dual-source scanner (SOMATOM Definition Flash; Siemens Healthineers, Forchheim, Germany) with 2 × 64 × 0.6-mm slices with the z-flying focal spot technique, a 0.28-second gantry rotation time, a 75-ms temporal resolution, a 0.75-mm slice width, and a 0.4-mm reconstruction interval. A retrospectively ECG-gated spiral scan using a biphasic chest pain protocol to reduce the radiation dose, as previously described (20), was acquired at suspended end-inspiration in all patients. ECG-controlled tube current modulation (MinDose; Siemens Healthineers) was utilized to reduce the radiation dose: the end-systolic (ES) phase with a 100-ms full-dose period (e.g., 250–350 ms) was targeted to the second half of the T wave on ECG, and the ED phase with a 100-ms full-dose period (e.g., −110–−10 ms) was targeted immediately before the next R wave. Combined tube current modulation (CARE Dose 4D; Siemens Healthineers) was used in all CT scans. The patients' heart rates during the cardiac CT scans and trigger delays for each cardiac phase were automatically recorded and stored in our picture archiving and communication system.
To optimize the CT radiation dose, we used standard body-size-adapted protocols in our institution based on combinations of body weight and the size of the cardiac shadow on scout images to determine the optimal tube current time product per rotation (20). The body-size-adapted radiation dose was entered before scan range adjustment to maximize the dose-saving effect of combined tube current modulation (21). The lowest possible tube voltage with minimal or no tube current saturation was selected to maximize radiation dose efficiency and iodine contrast-to-noise ratio: 80 kV was used in three patients, 100 kV in 25, and 120 kV in four. For image reconstruction, sinogram-affirmed iterative reconstruction (SAFIRE; Siemens Healthineers) strength 5 with a medium smooth kernel (I26f) was used. Strength 5 was chosen to achieve maximal image noise reduction without substantially degrading anatomic details at a given body-size-adapted radiation dose as previously assessed on chest CT (22).
An iodinated contrast agent (Iomeron 400, iomeprol 400 mg I/mL; Bracco Imaging SpA, Milan, Italy; 1.5–2.0 mL/kg) was intravenously administered by using a dual-head power injector. A triphasic injection protocol, in which undiluted contrast agent was followed by 50% diluted contrast agent and then by 5% diluted contrast agent, was used to achieve uniform cardiovascular enhancement and minimal perivenous streak artifacts from undiluted contrast agent at an injection rate of 2.0–3.0 mL/s. The scan delay time was determined using a bolus-tracking technique with a trigger threshold of 150 Hounsfield units in the left ventricular cavity.
After cardiac CT scanning, the volume CT dose index and dose-length product values based on a 32-cm phantom were automatically recorded and stored in our picture archiving and communication system. The effective dose values of cardiac CT were calculated by multiplying the dose-length product with age, sex, and the tube-voltage-specific conversion factors for chest CT (23).
CT Ventricular Volumetry
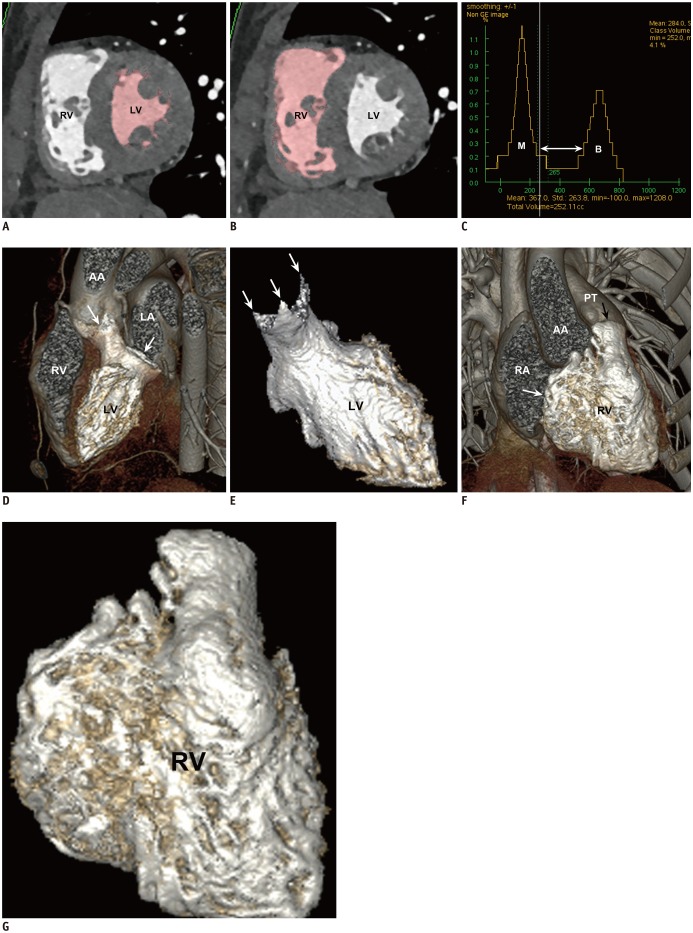
A stack of thin axial cardiac CT data was sent to a commercially available workstation (Advantage Windows 4.6; GE Healthcare, Milwaukee, WI, USA) for image evaluation. For CT ventricular volumetry, a semiautomatic 3D threshold-based segmentation method allowing the exclusion of the papillary muscles and trabeculations from the ventricular cavity was used (Fig. 1). An optimal segmentation threshold was determined to separate the most compact interventricular septal myocardium from the adjacent ventricular blood for each cardiac phase by using a histogram-assisted analysis (162425) (Fig. 1). The method was chosen to exclude voxels having 100% myocardial tissue consistently from the ventricular volume. For example, it was difficult to be sure that the selected threshold could separate the two different tissues consistently when variably trabeculated walls rather than compact septal walls were evaluated. Then, the atrioventricular valve planes were manually adjusted by using a 3D region-growing editing tool, and the semilunar valve planes were manually corrected using a 3D scalpel. From these ventricular volumes (Fig. 1), the stroke volume was subsequently calculated for each ventricle as follows: stroke volume = ED ventricular volume - ES ventricular volume. The volumetric parameters were indexed to the body surface area. Post-processing time taken for each volume was also recorded.
Cardiac MRI
Cardiac MRI using a standard imaging protocol in our institution was performed by using a 1.5-tesla system (Achieva; Philips Healthcare, Best, Netherlands) and a 32-channel cardiac coil. In young patients, sedation using propofol infusion was performed for cardiac MRI.
MRI Ventricular Volumetry
Retrospectively ECG-gated 2D short-axis cine imaging using a balanced steady-state free-precession sequence and k-t broad-use linear acquisition speed-up technique was acquired from the cardiac apex to the ventricular base during multiple end-expiratory breath-holds in cooperative patients and during free breathing in sedated or uncooperative patients. The imaging parameters used for short-axis cine imaging were as follows: repetition time (TR)/echo time (TE), 2.9 ms/1.5 ms; flip angle, 60°; turbo field echo factor, 9–13; number of cardiac phases, 20; temporal resolution, 30–50 ms; number of signal averages, 1; in-plane spatial resolution, 1.8–2.0 mm × 1.8–2.0 mm; 10–12 slices; section thickness, 8–10 mm; and sensitivity encoding (SENSE), not applied. The field of view was adjusted individually according to the patient's size. The patients' heart rates during short-axis cine imaging and the trigger delays for each cardiac phase were automatically recorded and stored in our picture archiving and communication system.
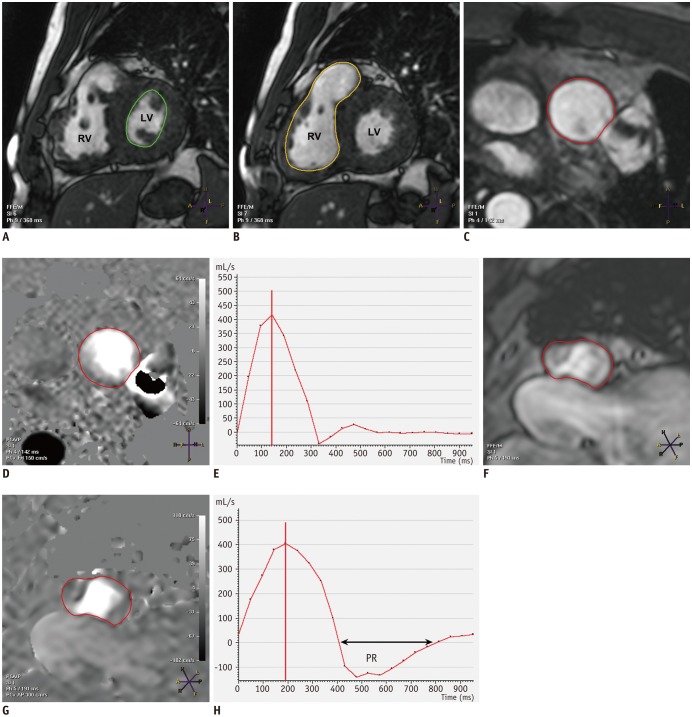
Ventricular volume quantification using short-axis cine imaging was performed using a commercially available workstation (View Forum; Philips Healthcare). The ES and ED phases were selected independently for each ventricle when the cardiac phase showed the smallest and largest ventricular cavities, respectively, at the midventricular level. A manual simplified endocardial contouring method with disc summation was used, in which the papillary muscles and trabeculations were included in the ventricular cavity (Fig. 2). In the basal sections, the semilunar and atrioventricular valve planes were manually trimmed by tracing them on neighboring cine images. As in CT ventricular volumetry, the stroke volume was subsequently calculated from these ventricular volumes for each ventricle. The volumetric parameters measured using short-axis cine imaging were also indexed to the body surface area.
MR Flow Measurement
Through-plane 2D velocity-encoded phase-contrast MRI using a retrospectively ECG-gated gradient-recalled echo pulse sequence was acquired to measure the flow volumes of the ascending aorta (AA), main pulmonary artery, right pulmonary artery, and left pulmonary artery. The imaging parameters used for phase-contrast imaging were as follows: TR/TE, 4.7 ms/2.6 ms; flip angle, 15°; turbo field echo factor, 3–4; number of cardiac phases, 20; temporal resolution, 28 ms; number of signal averages, 2; and section thickness, 5 mm. The field of view and pixel size (1.5–2.0 mm) were adjusted individually according to the patient's size. The initial velocity encoding settings (cm/s) were set to 150 for the AA and 250 for the pulmonary arteries. If an aliasing artifact was detected on the phase images, the velocity setting was gradually increased by 30–50 cm/s until the aliasing artifact disappeared. The product of the manually drawn vessel area and the average velocity through the vessel were used to obtain the flow volume by using a commercially available workstation (View Forum) (Fig. 2). The measured forward flow volume was used as the great arterial stroke volume and was regarded as the reference standard when compared with the stroke volumes derived from the ventricular volumes. Between the main pulmonary arterial stroke volume and the sum of the right and left pulmonary arterial stroke volumes, the larger one was chosen as the pulmonary arterial stroke volume. In addition to a larger pixel size, a SENSE factor of 1.7–2.0 was used to reduce the scan time of breath-hold phase-contrast MRI. In contrast, free-breathing phase-contrast MRI in sedated or uncooperative patients was obtained with no SENSE, a smaller pixel size, smaller field of view, and three signal averages.
Statistical Analyses
Statistical analyses were performed using IBM SPSS Statistics for Windows, Version 24.0 (IBM Corp., Armonk, NY, USA). Continuous variables were expressed as mean ± standard deviations, and categorical variables were expressed as frequency with percentage. The heart rates, trigger delays, and indexed ventricular volumes were compared between cardiac CT and short-axis cine MRI for each cardiac phase by using paired t tests. The stroke volumes calculated from the ventricular volumes measured using the CT and MRI methods were compared with the arterial stroke volumes measured using magnetic resonance (MR) flow measurements by using paired t tests and one-way analysis of variance combined with Tukey's honestly significant difference post-hoc test to correct for multiple comparisons. The ventricular and stroke volumes among different imaging methods were correlated by using Pearson correlation. Bland-Altman analysis was used to determine the mean differences and 95% limits of agreement between the comparisons. A p value < 0.05 was considered statistically significant.
RESULTS
Body Surface Area, Heart Rate, and Trigger Delay
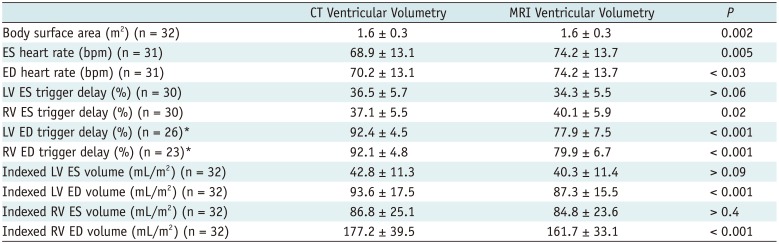
In the study population, the average body surface area and average heart rates at the cardiac CT examinations were slightly but significantly higher than those (p < 0.03) at the cardiac MRI examinations (Table 1). Heart rate during short-axis cine MRI was not recorded in one patient and trigger delays for short-axis cine MRI were missing for two patients. An ED trigger delay immediately after the R wave was utilized in one patient in CT left ventricular volumetry, three in MRI left ventricular volumetry, and seven in MRI right ventricular volumetry. Thus, the trigger delays could be analyzed for the remaining pairs. All trigger delays except the left ventricular ES triggers were significantly different between cardiac CT and short-axis cine MRI (p ≤ 0.02) (Table 1).
CT Radiation Dose Parameters
The volume CT dose index and dose-length product values of the cardiac CT examinations were 16.1 ± 6.3 mGy (range, 5.5–37.7 mGy) and 634.6 ± 191.8 mGy·cm (range, 241.9–1015.0 mGy·cm), respectively. The effective dose of cardiac CT was 8.2 ± 3.1 mSv (range, 2.9–17.7 mSv).
Ventricular Volumes
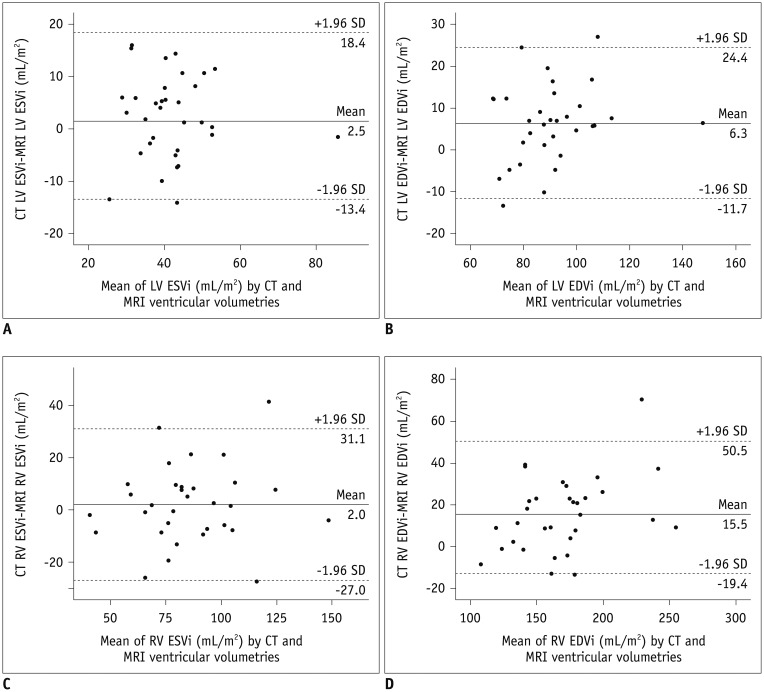
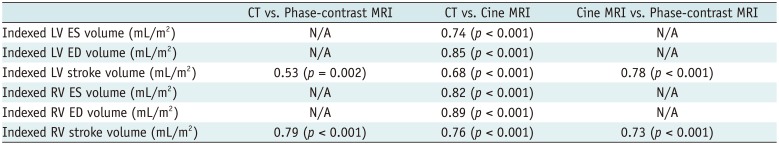
The indexed left and right ventricular ES volumes showed no significant differences between CT and MRI ventricular volumetries (42.8 ± 11.3 mL/m2 vs. 40.3 ± 11.4 mL/m2 [p > 0.09] and 86.8 ± 25.1 mL/m2 vs. 84.8 ± 23.6 mL/m2 [p > 0.4], respectively) (Table 1). In contrast, the indexed left and right ventricular ED volumes measured using cardiac CT were significantly larger than those measured using short-axis cine MRI (93.6 ± 17.5 mL/m2 vs. 87.3 ± 15.5 mL/m2 [p < 0.001] and 177.2 ± 39.5 mL/m2 vs. 161.7 ± 33.1 mL/m2 [p < 0.001], respectively) (Table 1). The ventricular volumes measured using cardiac CT showed good correlations (r = 0.74–0.89) with those measured using short-axis cine MRI (Table 2); the correlation coefficients were slightly higher for the right ventricular volumes (r = 0.85, 0.89) than for the left ventricular ones (r = 0.74, 0.82). According to Bland-Altman analysis, the mean difference and 95% limits of agreement between CT and MRI ventricular volumetries were 2.5 mL/m2 and 18.4 mL/m2 to −13.4 mL/m2, respectively, for the indexed left ventricular ES volume, 6.3 mL/m2 and 24.4 mL/m2 to −11.7 mL/m2, respectively, for the indexed left ventricular ED volume, 2.0 mL/m2 and 31.1 mL/m2 to −27.0 mL/m2, respectively, for the indexed right ventricular ES volume, and 15.5 mL/m2 and 50.5 mL/m2 to −19.4 mL/m2, respectively, for the indexed right ventricular ED volume (Fig. 3).
Stroke Volumes
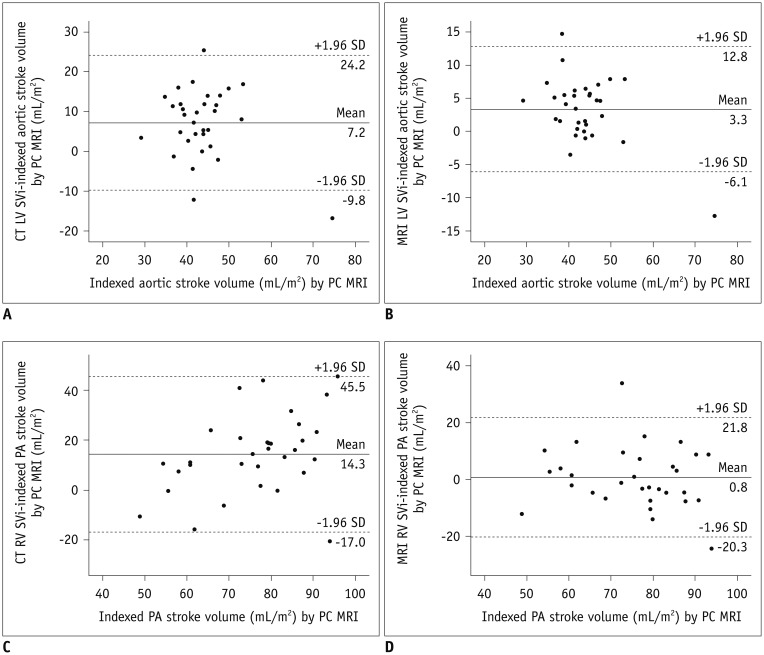
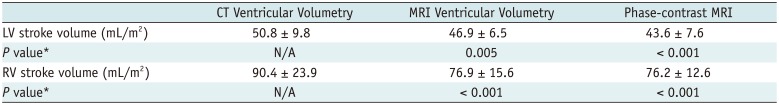
The average indexed left ventricular stroke volume measured using cardiac CT (50.8 ± 9.8 mL/m2) was significantly higher than those measured using short-axis cine MRI (46.9 ± 6.5 mL/m2, p = 0.005) and phase-contrast MRI (43.6 ± 7.6 mL/m2, p < 0.001) (Table 3). The average indexed right ventricular stroke volume measured using cardiac CT (90.4 ± 23.9 mL/m2) was also significantly higher than those measured using short-axis cine MRI (76.9 ± 15.6 mL/m2, p < 0.001) and phase-contrast MRI (76.2 ± 12.6 mL/m2, p < 0.001) (Table 3). Therefore, cardiac CT overestimated the indexed left and right ventricular stroke volumes by approximately 14.2% and 15.7%, respectively. According to Bland-Altman analysis, the mean difference and 95% limits of agreement between the indexed left ventricular stroke volumes measured using the three different imaging methods were 7.2 mL/m2 and 24.2 mL/m2 to −9.8 mL/m2, respectively, between cardiac CT and phase-contrast MRI and 3.3 mL/m2 and 12.8 mL/m2 to −6.1 mL/m2, respectively, between short-axis MRI and phase-contrast MRI (Fig. 4); those for the indexed right ventricular stroke volume were 14.3 mL/m2 and 45.5 mL/m2 to −17.0 mL/m2, respectively, between cardiac CT and phase-contrast MRI and 0.8 mL/m2 and 21.8 mL/m2 to −20.3 mL/m2, respectively, between short-axis MRI and phase-contrast MRI (Fig. 4).
Post-processing Time of CT Ventricular Volumetry
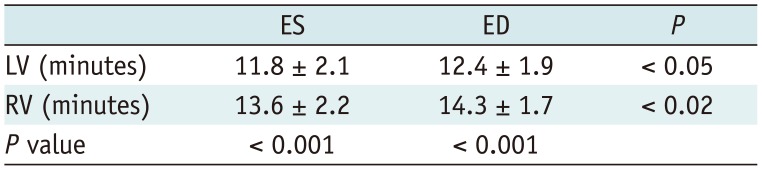
Post-processing times taken for CT ventricular volumetry were in the range of 11.8–14.3 min for each volume (Table 4). The CT ventricular volumes did not correlate with the post-processing times (r = 0.04–0.28, p = 0.09–0.84).
DISCUSSION
In this study, the indexed ventricular ES volumes were comparable between CT and MRI. In contrast, CT ventricular volumetry using semiautomatic 3D threshold-based segmentation overestimated the indexed ventricular ED and stroke volumes by 7–9% and 14–16%, respectively. Compared with MRI right ventricular volumetry using the 2D simplified contouring method, CT right ventricular volumetry in which the papillary muscles and trabeculations were included in the ventricular cavity overestimated the ES volumes (12.9 mL), ED volumes (17.1 mL), and stroke volumes (4.2 mL) in 33 patients with repaired tetralogy of Fallot (26). The authors suggested transient increases in preload due to the rapid inflow of contrast medium as the major reason for overestimating the right ventricular ED and stroke volumes, and 10% steps for the CT reconstruction phase and right ventricular contraction delay often seen in repaired tetralogy of Fallot as the cause of overestimating the right ventricular ES volumes (26). In automated CT right ventricular volumetry using a prototype software in which the papillary muscles and trabeculations were largely included in the ventricular cavity, the prototype software overestimated the ES volumes by approximately 16.0 mL and underestimated the stroke volumes by 12.0 mL, compared with the manually segmented results in 50 patients with known or suspected coronary artery disease (18). The major reason for the overestimated right ventricular ED volumes was the erroneous inclusion of the pulmonary trunk beyond the pulmonary valve plane (18).
The partial volume effect between the ventricular blood and trabeculations could be a reason for the overestimated CT ED volumes in this study. It may be supported by the fact that the ES volumes with less partial volume effect showed no significant difference between CT and MRI (Table 1). In this study, a subset of voxels containing variable mixtures of the two different tissues was included in the ventricular cavity predominantly in the ED phase. A new segmentation algorithm, therefore, should be ultimately developed to solve this partial volume problem in threshold-based segmentation. In fact, a partial voxel interpolation technique using an in-house software was reported to reduce this adverse effect in 2D short-axis cine MRI (327). Such an algorithm may also provide the ventricular myocardial mass and ventricular mass-volume ratio because accurate ventricular volume and myocardial mass can be simultaneously obtained (2829). A different approach in determining the threshold, e.g., simply the half value between the two peaks, may be used by others. However, the approach might be affected by the partial volume effect, and it would be difficult to correct using a partial voxel interpolation algorithm.
The literature shows an almost linear or a slightly non-linear exponential relationship between the ventricular volumes and body surface area in children and adults (303132). The ventricular volumes, therefore, were indexed to the body surface area in this study to mitigate potential interstudy body size differences. The right ventricle is gradually dilated chiefly because of severe pulmonary insufficiency in repaired tetralogy of Fallot. However, the greater CT ED volumes showed no or even a weak inverse correlation with the interstudy time intervals.
The selection of the correct cardiac phase is important in ventricular volumetry. ECG-synchronized multi-phase cardiac CT datasets are usually reconstructed at 5% or 10% increments throughout the R-R interval (11213141526), often leading to overestimated ventricular ES volumes (26) and underestimated ventricular ED volumes. In contrast, a cardiac phase showing the smallest or largest volume was finely determined for each ventricle by previewing cardiac axial cine CT images reconstructed at 10- to 25-ms increments in this study. This different strategy in selecting the correct cardiac phase might reduce the potential errors in quantifying the ventricular volumes caused by the conventionally used lower sampling rates, i.e., 10–20 cardiac phases. Furthermore, this approach decreases the number of CT images to be assessed and stored.
Interestingly, the last cardiac phase selected for the ED phase (78.4–80.5% of the R-R interval) of short-axis cine MRI was approximately 12–14% earlier than that (92.0–92.3% of the R-R interval) for cardiac CT at comparable heart rates. Such difference in the timing of the ED phase between cardiac CT and short-axis cine MRI has not been described in the literature. Compared with the CT results, the earlier ED phase of short-axis cine MRI might contribute to smaller ED volumes of short-axis cine MRI. The optimal ED phase (93.9–95.2%) in a previous study using multi-phase dual-source CT datasets was in line with the results of this study (33).
The stroke volume calculated from ventricular volumetry might have been slightly overestimated in cases with trace atrioventricular regurgitation. Although it was used as the gold standard (because of a lack of a better noninvasive reference method), the stroke volumes measured using phase-contrast MRI might have been underestimated in cases with turbulent flow in the dilated arteries and/or post-stenotic turbulent flow. In addition, the aortic stroke volume is slightly underestimated because of the exclusion of coronary artery flow (approximately 5% of the cardiac output). However, the circumstances are the same in other comparative studies on ventricular volumetry with MR flow measurement as the reference (121426).
The relatively long post-processing time of CT ventricular volumetry in this study was chiefly attributed to manual segmentation involving the atrioventricular and semilunar valve planes to increase its accuracy. The post-processing time for automated methods using CT data was reported to be in the range of 3–10 minutes (131518). However, manual correction most commonly at the valve planes was often necessary even for the automated methods (15181927). As a result, semiautomatic segmentation may be a reasonable compromise between the automated and manual methods considering accuracy, reproducibility, and post-processing time as demonstrated in this study as well as in other studies (18101416172425). The post-processing time for semiautomatic 3D threshold-based segmentation is expected to be shortened by an advanced segmentation algorithm in the future, as demonstrated (< 5 minutes) in a study using semiautomatic 2D threshold-based segmentation (10).
Relatively wide 95% limits of agreement in the ventricular and stroke volumes are not surprising in comparative studies between different segmentation methods as well as between different imaging studies. For example, interstudy 95% limits of agreement in left ventricular volume quantification have been reported in the range of ± 10–40 mL in 2D short-axis cine MRI using the same segmentation method (3435).
The effective dose (8.2 mSv) of CT ventricular volumetry in this study was higher than the doses of 7.3 mSv (14), 7.4 mSv (16), and 7.6 mSv (26), but lower than those of 9.4 mSv (19) and 10–15 mSv (12) used in previous studies. In this study, various dose-reducing strategies, such as a body-size-adapted protocol, low tube voltage, tube current modulation, heart-rate-adapted pitch, and iterative reconstruction algorithm, were used together to maximize radiation dose reduction in cardiac CT.
This study has several limitations. First, the results of this study might have been affected by the interstudy time interval (< 3 years) between the cardiac CT and cardiac MRI examinations. This limitation is attributable to the retrospective study design and to the efforts to make the statistical comparisons feasible. Therefore, the results of this study should be further validated in a prospective study with two examinations on the same day. Second, intraobserver and interobserver variability of the segmentation method was not evaluated, because the high reproducibility of a threshold-based segmentation method has already been thoroughly evaluated (347813). Moreover, lower interobserver and intraobserver variability in CT ventricular volumetry (3.5–7.3% and 3.4–7.6%, respectively) than in MRI ventricular volumetry (5.3–11.0% and 6.2–10.6%, respectively) was reported in a previous study (28). Furthermore, CT showed the lowest interobserver and intraobserver variability of volumetric analysis in a comparative study among cardiac CT, cardiac MRI, and 3D echocardiography by using right-ventricle-shaped phantoms (11). Lastly, different respiration states among the imaging studies might have affected the results of this study. However, such different respiration states are inevitable to ensure compliance with different patient conditions and different imaging parameters adaptively without sacrificing patient safety and comfort.
In conclusion, CT ventricular volumetry using semiautomatic 3D threshold-based segmentation provides comparable ES volumes, but compared to 2D cardiac MRI, it overestimates the ED and stroke volumes in repaired tetralogy of Fallot.
 XML Download