

 PDF
PDF ePub
ePub Citation
 Print
Print


INTRODUCTION
Acute coronary occlusion (ACO) can be induced by plaque rupture, erosion, and vasospasm, causing serious myocardial infarction or sudden cardiac death [1]. There have been a lot of diagnostic devices to detect ACO in medicine. Non-invasive imaging modalities such as perfusion computed tomography (perfusion CT) and single-photon emission computed tomography (SPECT) are the examples [23]. In addition, the body surface potential map (BSPM) is used to examine ischemic heart. The BSPM method projects electrical signals produced by the heart onto the body surface map, in order to infer electrophysiological phenomena of the heart. It has the advantage of detecting signals that cannot be found by using electrocardiogram (ECG), thanks to its higher level of sensitivity [45].
In many cases, these methods can measure the infarcted myocardial region of the heart and provide reference data for the treatment of patient [3]. Most cases of ACO are induced by plaque rupture or erosion, showing active collateral vessels due to plaque progression [67]. Perfusion CT and SPECT are effective to diagnose the cases and there have been a lot of basic physiological studies for the ACO using the devices. On the other hand, no medical device has been proposed for the diagnosis of the ACO due to vasospasm and only a few studies have done for its physiological mechanism [8].
Vasospasm is frequently observed in relatively young people with no severe stenosis in coronary arteries, not inducing collateral circulation. After one or two minutes from the onset of vasospasm, it is generally disappeared without no damage to the heart. However, in some pathological cases vasospasm persists 5 min or 10 min, causing serious myocardial infarction and even sudden cardiac death [9]. Besides, the location of vasospasm in coronary arteries is also important factor. If it happens in far distal artery, the myocardial damage is not so much. Up to now there have been no studies on the physiological changes due to the location and persistent time of occlusion due to spasm. This is due to the fact that vasospasm unexpectedly happens and thus measuring its physiological phenomenon is difficult. In this aspect, computer simulation based on physiological model can be an alternative method to investigate the phenomenon.
There have been several modeling studies on cardiac cellular anoxia and the electric potential changes of the heart and torso due to myocardial infarction. However, the studies are limited to partial phenomena and there was no integrative modeling of the sequential events from coronary occlusion to cardiac cellular anoxia, tissue ischemia, and abnormal electric waves of the heart/torso induced by the ACO due to vasospasm.
In this study, we developed a patient-specific computer simulation method coupling coronary arterial occlusion with the physiological phenomena such as cellular anoxia, tissue ischemia, and the electric potential changes of the heart and torso. Then, the ACO due to vasospasm was simulated in an integrative manner and the effects of occlusion location and persistent time were investigated.
METHODS
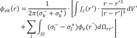
Fig. 1 shows the integrated schematic that contains all the process. Panels present (A) cell model in the ventricle in subsection 2.1 and (B) electric wave propagation in cardiac tissue in subsection 2.2. Panel (C) shows the mapping process of the heart electrical potentials onto the torso surface by setting up boundary and using these above results in subsection 2.3. Panel (D) shows integrated membrane voltage value of each ST segment for torso data to map in two-dimensional (2D) rectangular surface in subsection 2.4. Panel (E) presents integrated membrane voltage value of each ST segment for mapping in front-back torso data and in two-dimensional (2D) rectangular front-back surface. And panel (E) also shows the analysis of the bipolar angle between the maximum and minimum value on the ST isointegral map in subsection 2.4, by using the ischemia regions in ventricle according to acute coronary occlusions in distal, mid, and proximal of LAD in subsection 2.5. More details in each processes are explained as below.
Cell model
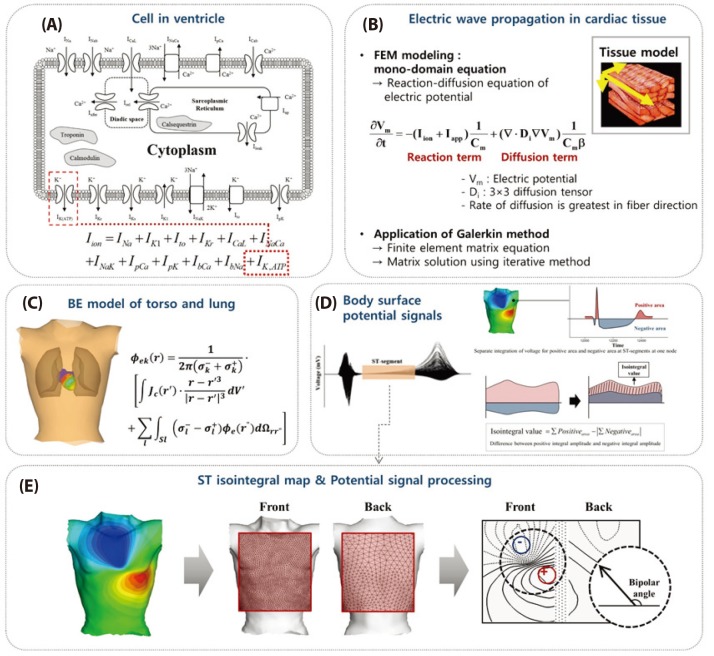
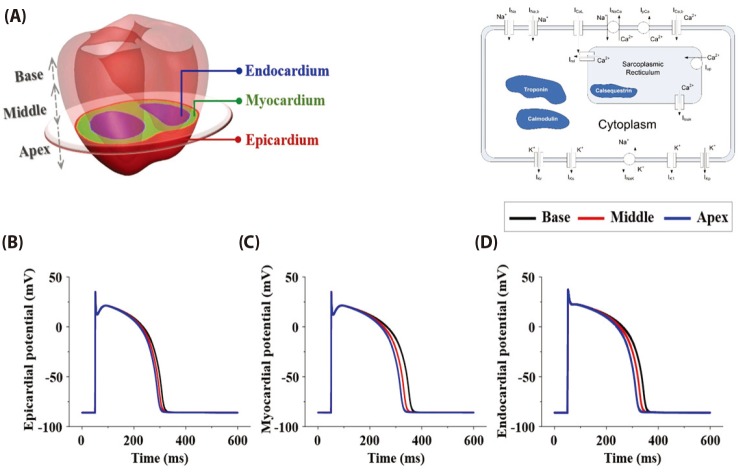
To describe electrophysiology of ventricular cell, we used a human cardiac cell model which was presented by ten Tusscher et al. [10] (hereafter, TNNP model). A schematic of the TNNP model is shown in Fig. 2, including the ion channels, ion pumps across the cell membrane, and intracellular calcium dynamics. This includes experimental data on the major ionic currents, the fast Na+, L-type Ca2+, transient outward, rapid, and slow-delayed rectifier K+ currents, as described in the original paper. The model has three different types such as endo-, mid-, epi-cardiac cell models. In addition to these, to reflect the longitudinally distinct features of action potential duration (APD), three types of the TNNP model according to longitudinal region (apex, middle and base) are considered as suggested by Perotti et al. [11] (Fig. 2). Therefore, total 9 types of cell model are considered in the present study.
For ischemic cell model, we added the ATP sensitive potassium channel (IKATP) activated by anoxia and changed the maximal conductance of sodium and potassium channel caused by acidosis, as suggested by Shaw and Rudy [9].


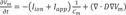
Where IK(ATP) is sensitive potassium current; Ek is potassium reversal potential, gK(ATP) is maximum channel conductance per unit capacitative membrane area at 0 mM, Nicholsarea=5·10−3 cm2, [ATP]i=3.0 mM, [K]o,normal=4.0 mM, n=0.24, H=2, and k0.5=0.250 µM [9].
To reflect the change of action potential pattern by ischemic persistent time, the cell models for two ischemic persistent times were considered: stage 1 (persistent time of 5 min after the onset of coronary occlusion) and stage 2 (persistent time of 10 min after the onset of coronary occlusion) [9].
Governing equation for electric wave propagation in cardiac tissue
We used mono-domain method to calculate electric wave propagation of 3D ventricular tissue [12]. The differential equation to solve the electric wave propagation of membrane potential in the cardiac tissue is shown in Eq. 1.
Here, t, Vm, Iion , Iapp and Cm , and D are time, membrane voltage, cellular membrane, stimulation current, membrane capacitance, and electric diffusion coefficient, respectively. To solve the equation, we spatially discretized the equation by using finite element method and time derivative in the equation was approximated by forward Euler method. More detailed explanation for the solution of the equation is shown in our previous paper [13].
Boundary element model of electric potential on the torso surface
We used the boundary element model of the human torso proposed by Potse et al. [14] for the mapping of the heart electrical potentials onto the torso surface. The potential at the torso surface is described by the following equation:
Here, φek is potential at a point r on surface k. σl− and σl+ indicate the conductivity inside and outside surface k, respectively, Jc is the source current density field, and r′ and r″ are variables. The summation is over all surfaces 1. dΩrr″ is the solid angle subtended at r by the infinitesimal surface element situated at r″. The model is described in more detail in Potse et al. [14].
BSPM analysis
In order to investigate BSPM pattern changes during ST segment, we created ST isointegral map using time-varying torso data [15]. We defined ST segment as from J-point to the spot where T wave starts. We integrated separately the membrane voltage value of positive area, and negative are of ST segments of torso data, and mapped in two-dimensional (2D) rectangular surface in Fig. 1D. ST isointegral map is based on the difference between the positive integral amplitude and the negative integral amplitude. The integrated membrane voltage value of each ST segment for mapping in front-back torso data and in two-dimensional (2D) rectangular front-back surface was displalyed in Figs. 1D and E. We analyzed distinct features of each ischemic model focusing on the bipolar angle that the maximum and minimum value on the ST isointegral map show and the amplitude of the maximum and minimum value (Fig. 1E).
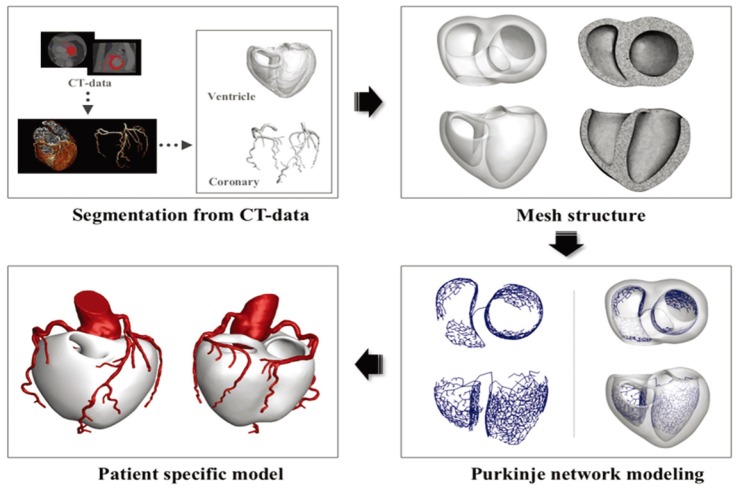
Construction of patient-specific model
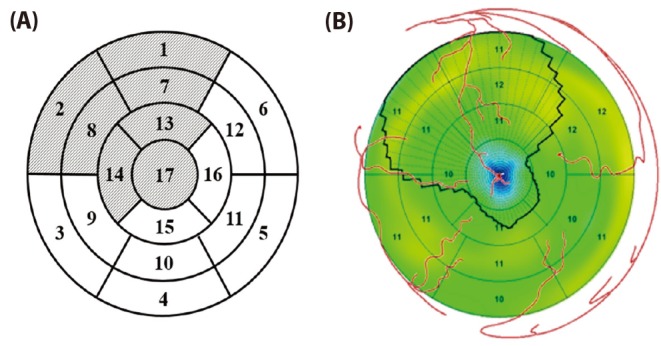
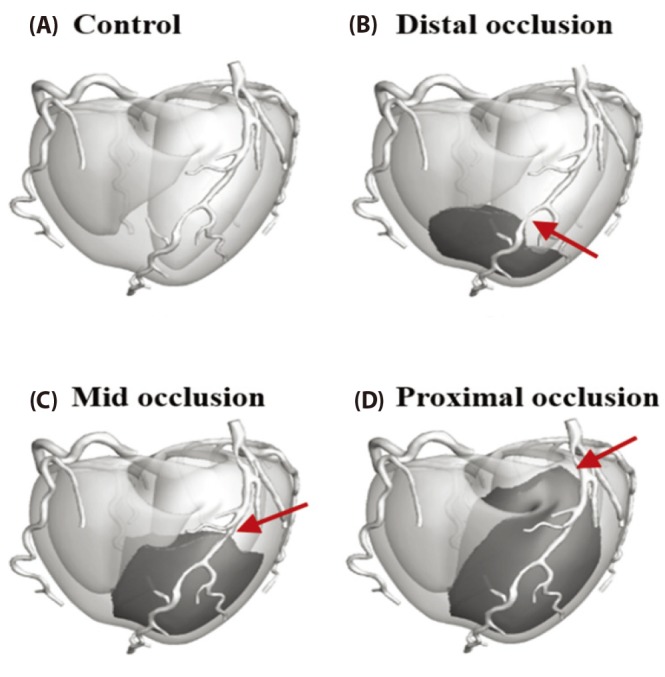
A patient-specific 3D ventricle geometry including coronary arteries was reconstructed from the CT images obtained from Ulsan University Hospital. Then to facilitate numerical analysis, we smoothened the grid surface in Fig. 3. Purkinje fiber network was constructed on the endocardial surface [12] in Fig. 3. We established the ischemia regions in ventricle according to acute coronary occlusions in distal, mid, and proximal of LAD in Fig. 4. The ischemia regions was determined on a basis of 17-segment heart model used in American Heart Association (AHA), and a vessel territory by using commercial Aquarius iNtuition software (Version 4.4.11 TeraRecon, Inc, San Mateo, CA, USA). Fig. 5 displays ischemic zone in ventricle caused by occlusions in distal, mid, and proximal of LAD. Each ischemic zone by occlusions in distal, mid, and proximal of LAD was 12, 24 and 34% of ventricle tissue.
RESULTS
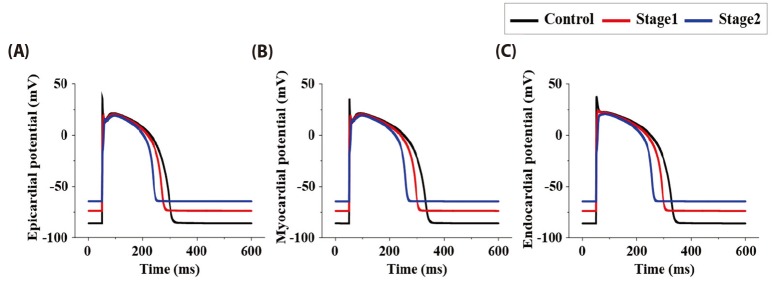
Fig. 6 represents epi-, myo-, and endo-cardiac membrane potential on stage 1 and stage 2 during normal and under ischemic condition. Epicardial APD90 is 253.0, 223.9, and 193.6 ms on normal, stage 1 and stage 2 condition. Myocardium was 286.0, 251.7, and 211.7 ms, and endocardium was 282.7/247.3/210.8 ms. The result showed that the longer the ischemic condition, the shorter the APD90. Resting membrane potential was –86.1, –73.8, and –64.3 mV on normal, stage 1, and stage 2 on every cell which indicated that the longer the ischemic condition, the higher the resting membrane potential.
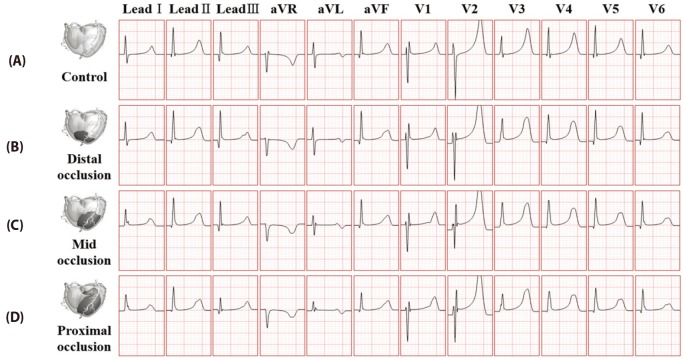
Fig. 7 and Fig. 8 represents 12-lead ECG waveforms based on BSPM data which was acquired through normal and ischemic model. Each figure has ECG waveforms which is relevant to control model. Fig. 7 shows ECG waveforms at stage 1 of ischemia in the normal model and the distal, the mid and the proximal occlusion models. At the stage 1 of ischemia, both ST elevation and depression were not observed in every case.
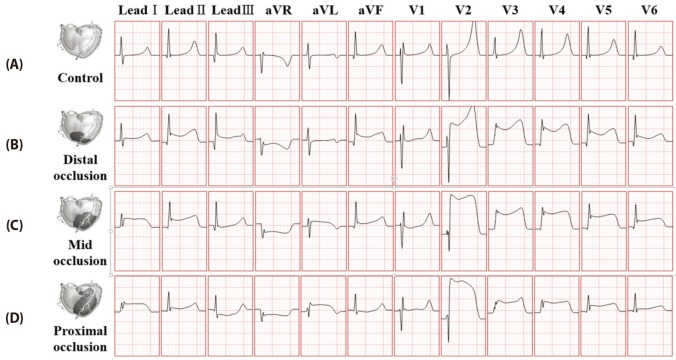
And Fig. 8 ECG waveforms at stage 2 of ischemia in the normal model and the distal, the mid and the proximal occlusion models. Compared to the state 1 of ischemia, ST elevation and depression occurred at limb lead, ST elevation occurred in V2-V6 leads. This trends showed more clearly in LAD proximal occlusion model compared to the mid and distal occlusion models.
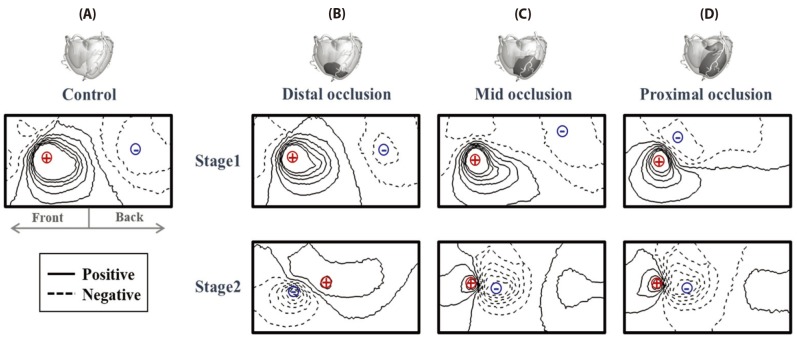
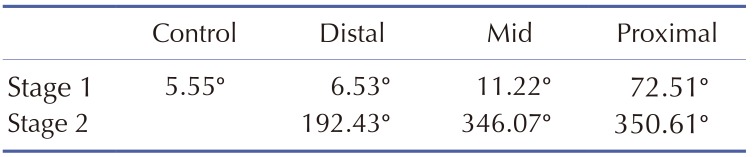
Fig. 9 represents ST isointegral map for normal and ischemic model at stage 1 and 2. ST isointegral map in the figure shows potential pattern that is distributed from front and back of torso model starting from left to right. In the control model without occlusions, the bipolar angle, the slope angle of the line between maximum point of positive zone and the minimum point of negative zone was 5.55 degree (Fig. 9A). And the maximum and minimum value in two areas were 0.044 and 0.007 mV, respectively. Figs. 9B, C, and D show ST isointegral maps in LAD distal, mid and proximal occlusion model, respectively. The slope angles of the line between maximum point of positive zone and the minimum point of negative zone were 6.53, 11.22, and 72.51 degree in LAD distal, mid and proximal occlusion model, respectively. The maximum and minimum value were similar in normal and three occluded models at the stage 1. The positive and negative zones rotated counterclockwise in proximal occlusions compared to mid, and distal occlusion models (Fig. 9, Table 1). On the other hand, A the stage 2, The slope angles of the line between maximum point of positive zone and the minimum point of negative zone were 192.43, 346.07, and 350.61 degree in LAD distal, mid and proximal occlusion models, respectively. In the mid and the proximal occlusions models, the positive and negative zones rotated by 360 degree counterclockwise, and the both positive and negative zones were located together in the front (Fig. 9, Table. 1). However in control model without occlusion, the positive zone was dominantly observed in the front (Fig. 9). The maximum and minimum value were 0.01 and −0.051 mV in distal occlusion model, and were 0.101 and −0.165mV in mid occlusion model, and were 0.218 and −0.264 mV in proximal occlusion model at Stage 2 (Fig. 9, Table 1).
DISCUSSION
It have not been clearly found how the location of coronary arterial occlusion influences on the cardiac ischemia and how the sign for ischemia will be detected for the patients with stenosed coronary artery. Therefore, this study investigated the influences of occlusion location in LAD on BSPM patterns by using a patient-specific ventricle model reconstructed from CT images. To achieve this, we developed an integrated system from the cellular level to organ levels, and reproduced electrical properties of heart tissues caused by LAD occlusion. We presented pseudo ECG and the potential distribution contour by using BSPM in four models.
There are three major findings from BSPM analysis of patient-specific ventricular model used in this research. 1) We developed an integrated system from the cellular level to organ levels to investigate the effects of acute occlusion in LAD on BSMP pattern. 2) ECG patterns in acute occlusion models was also normal as control model, nevertheless the bipolar angle of the ST isointegral map was useful to detect ischemia at stage 1. 3) The amplitude in ST isointegral map significantly different according to occlusion locations i.e. distal, mid, and proximal parts in LAD at stage 2, compared to stage 1. Although the bipolar angles remained similar between mid and proximal occlusions, the amplitude is much higher in proximal occlusion than mid occlusion.
We adopted modified TNNP model by modifying repolarization direction and by considering the effects of acute coronary occlusion. During the repolarization period, the action potential flowing through the ventricular tissues progressed from the apex toward the base as the cell model proposed by Perotti [11]. We reproduced electrophysiological phenomena of cells resulting from coronary occlusion. When there is insufficient blood flow to the area of occlusion in the myocardium, the mitochondria within myocardial cells suffer oxygen deficiency. Then, ATP production is reduced due to aerobic metabolism disorders. To compensate for the reduced ATP, the ATP-sensitive potassium channel is activated, and potassium Ko and acidosis changed on the extracellular level. To reproduce these electrophysiological phenomena, we applied the numerical method proposed by Robin M. Show and Yoram Rudy [16], and simulated a typical ischemia cell with the reduced APD and the shorter amplitude of action potential (Fig. 6). When the modified cell model was applied, conduction delay that occurs in the ischemia zone was observed in the simulation, and, as a result, there was a noticeable level of ST elevation in the 12-lead ECG (Fig. 8).
In the ST isointegral map of the control model, the front of the torso appeared positive, and the back negative (Fig. 9A). This pattern are identical to results in previous studies as shown in Fig. 2 of Ref. 15 and Fig. 3 of Ref. 17 [1517]. It is suggested that the ventricular repolarization wave moved toward the back, in the duration from ST to T. It was possibly due to the anatomical facts that the ventricular apex was slanted toward the front and the base toward the back, and that the APD of the apex was shorter than that of the base. On the other hand, upon the onset of LAD occlusion, the bipolar angle gradually rotates counterclockwise, moving the negative pole on the back toward the front (Figs. 9B, C and D) and Table 1). In distal occlusion model during stage 1, the difference in the dipole angle in comparison to the control was negligible. However, the negative area on the ST isointegral map gradually moves toward the back in the proximal occlusion model. This showed an electrophysiological characteristic in which the mean electrical vector of a ventricle points toward the ischemia area due to electrical delay of the ischemia tissues.
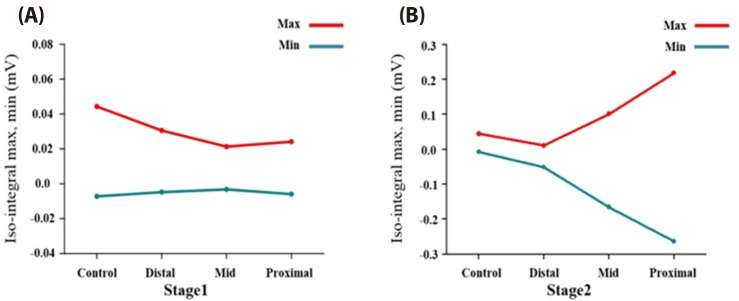
The stage 1 showed no different maximum and minimum values of action potential according to either presence of occlusion or the location of occlusion (Fig. 10A). At stage 2, the amplitude gradually increases as the occlusions were close to the proximal regions. As shown in the stage 2 in Fig. 9B, the bipolar angle in distal occlusion model became larger than that in the control model. The bipolar angles in mid and proximal occlusion models appeared to be similar to the control model. However in control model, a positive region was dominant in the front, whereas in the mid and the proximal occlusion models, the positive and the negative regions were observed together in the front. BSPM patterns are very similar between the mid and the proximal occlusions, the amplitude is much higher in proximal occlusion than mid occlusion. The minimum and maximum amplitudes on the ST isointegral map are different between the mid and the proximal occlusion models at stage 2 (Fig. 10B). From the ECG's viewpoint, severe ST elevation of ST depression was observed at stage 2, and different ST patterns were found according to locations of coronary occlusion. The findings indicated that the amplitude on an ST isointegral map might be a useful indicator in diagnosing ischemia resulting from myocardial infarction that lasted 10 minutes or longer (stage 2).
There are several limitations in this study. Frist, our computational study was limited to one patient-specific model. Further clinical data will be necessary to clinically validate the method presented in this study. Secondly, we did not consider chronic coronary occlusions. We simulated cardiac electrophysiology in a patient with acute coronary occlusion, so we did not include the effects of collateral circulation of the coronary. In chronic and severe coronary artery, collateral circulation slightly enables preservation of the left ventricular function and reduces damage to the myocardium [1819]. However, the blood amount supplied by collateral circulation was less than half of blood amount for survival of the myocardium [20]. Collateral circulation is not a very critical factor in acute coronary occlusions, because collateral circulation increases gradually during a certain period of roughly two days to one month. Therefore, we believe that these limitations do not greatly affect the major findings of this study.
 XML Download