

 PDF
PDF ePub
ePub Citation
 Print
Print


INTRODUCTION
Conventional mitral valve annuloplasty is very effective for repairing mitral valve regurgitation. However, it is an invasive treatment employing open-heart surgery with sternotomy and thoracotomy. Mitral valve cerclage annuloplasty (MVCA) is a newly introduced catheter-based procedure used to treat heart failure patients without dangerous invasive surgery [12]. Since the MVCA technique avoids the clinical risks of the open-heart procedure, this method is less invasive, less risky and more accessible than conventional mitral valve annuloplasty. This procedure tightens the mitral annular circumference, inspired from epicardial purse-string annuloplasty [23]. Patients treated by this tightening procedure benefit from the stress unloading effect in their ventricular muscles, which ultimately reduces the size of the ventricles. Successful MVCA cases in swine, canine and human were reported previously [234]. However, the clinical outcomes of the MVCA procedure were not satisfactory for some patients [234]. Moreover, questions concerning the physiological mechanism involved in heart-muscle recovery due to this procedure and how much mitral circumference needs to be tightened depending on the patient remain unanswered. Therefore, for this MVCA procedure to be performed on heart-failure patients, the physiological mechanism induced by the MVCA procedure must be delineated in detail, and a patient-specific application method of the procedure needs to be established.
Considering the many difficulties in performing an experimental or a clinical study using a living heart, computer simulation can be an alternative method to understand the physiological mechanism of MVCA treatment. Until now, computer simulation of cardiac electrophysiology and mechanics has been considered a significant tool for the investigation of the heart disease mechanism and for the development of novel therapeutic clinical techniques for heart diseases [567]. For example, multiscale heart modeling was developed by integrating cell, tissue, and organ scales to investigate the electrophysiological behavior of the heart [89101112]. However, most of the computational studies on the mechanism of heart disease have been performed not on a patient-specific model, but rather on a typical cardiac model [5678910]. On the other hand, in the case of MVCA simulation, a patient-specific model is inevitable because tightening of mitral circumference can vary depending on the patient.
In this study, we propose a patient-specific cardiac electromechanical model of pre- and post-MVCA treatment to analyze the physiological mechanism of MVCA treatment. Using this model, the MVCA simulations of two typical patients were conducted, and the effects of MVCA treatment on cardiac mechanics and heart recovery were investigated. Furthermore, we demonstrate that the computational model presented herein can be used as a virtual test tool of MVCA therapy before a real clinical trial.
METHODS
Clinical characteristics of MVCA
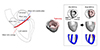
In MVCA treatment, tensioning material surrounds the basement of the left ventricle (LV) (Fig. 1) [2]. A circumferential cerclage suture transverses the coronary sinus and the basal septal myocardium and is secured within the right atrium. In Fig. 1, the planes of the mitral annulus and MVCA are shown in blue and red, respectively.
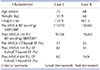
Patients with severe heart failure underwent MVCA treatment in 2015 and 2016 at Pusan National University Yangsan Hospital (Korea) [4]. The study protocol was approved by the Korea Food and Drug Administration and by the institutional ethics board of Pusan National University Yangsan Hospital (NCT02471664) [4]. Among them, two representative patients were selected for computer simulation. Both patients showed significant reduction of mitral regurgitation after MVCA, the patient of case 1 showed significant recovery of all clinical symptom and sign. The patient of case 2 didn't show significantly reduction of dilated left ventricle chamber volume defined as ‘reverse remodeling’. Computed tomography (CT) images for pre- and post-MVCA were scanned for each patient. A 6-month follow-up CT scan was obtained after MVCA in the patient with evident reverse remodeling finding. This study was approved by the Institutional Review Board of the hospital. Clinical characteristics of the patients are summarized in Table 1.
Computational model of MVCA
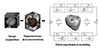
For the computer simulation of MVCA, we first constructed patient-specific ventricular geometry based on the CT images (Fig. 2). Next, 3D cardiac models of pre- and post-MVCA for each patient were established by applying electromechanical-governing equations to the model geometries.
In this study, we used the cardiac electromechanical model (Fig. 2) proposed in our previous paper [56]. This model integrates two main components: electrical and mechanical components of the ventricles. Here, the vascular hemodynamics implemented in the lumped parameter model (LPM) interacts with the ventricular mechanics. The myocardium in the ventricular mechanics model was assumed to be an orthotropic, hyperelastic, nearly incompressible material defined by an exponential strain energy function [5]. The mechanics model comprised 356 nodes and 172 elements in terms of Hermite polynomial interpolation, and was solved by using the finite element method. The electrical activation times in cardiac tissue were obtained by solving the finite element equations of the mono-domain formulation, as described in our previous paper [56] and were mapped to the mechanics mesh system of the ventricles.
The transient calcium concentration in cardiac cells was obtained from the cellular electrophysiological model. This calcium activation induced a force generation mechanism of cross-bridge dynamics in cardiac tissue myofilaments [13]. Actively generated cellular forces were integrated in the ventricular mechanics model. The mechanical behavior of the ventricular muscles was governed by the stress equilibrium equations based on the large deformation theory [56]. An LPM was coupled with the electromechanical model to present time-varying changes in circulatory hemodynamics coupled with the 3D electromechanical model (Fig. 2). Tissue remodeling of the ventricles associated with heart failure was implemented by changing the related parameters of the electromechanical model, as described in our previous paper [6].
RESULTS
In the present study, we simulated two patients with the physiological characteristics shown in Table 1. For Case I, simulations for pre-MVCA, and 1-month and 6-months follow-up after MVCA were performed. These three models were reconstructed from the respective CT images. In Case II, the clinical outcome after MVCA was not good, and only the 1-month follow-up data were gathered. Although the reason for the bad clinical outcome of Case II is not known, we suspect that the heart was too late to be brought up to recovery. To show an example of virtual surgical test for Case II, a simulation model with a tighter degree of LV circumference was also computed.
Validation of the present method
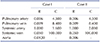
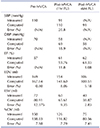
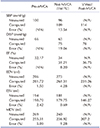
To validate the present model, we compared the computed variables with clinically measured data. In the present method, there are several model parameters that should be determined according to the patient's physiological state. The coefficient of cellular force generation of the cardiac mechanics model and the resistance and capacitance values of the LPM are examples. We set these model parameters so that the computed systole blood pressure (SBP), diastole blood pressure (DBP) and ejection fraction (EF) of the pre-MVCA model matched the measured values of the patient's pre-MVCA state. The selected simulation parameter of LPM, obtained from pre-MVCA are shown in Table 2. Next, we compared the simulated results with the measured data in terms of end-diastole volume (EDV), end-systole volume (ESV) and mid-diastole volume (MDV). In Case I (Table 3), the computed EDV and MDV values of pre-MVCA agreed well with the measured data (error less than 8%), but the computed ESV had an error of approximately 12% compared with the measured value. Using the same lumped parameters obtained from pre-MVCA, we performed the post-MVCA simulation for the patient (1-month [M] follow-up [FU] and 6M FU) and compared the computed SBP, DBP and EF values with the measured data. In the case of 1M FU, the computed EF value had 11% error, but the computed SBP and DBP values had approximately 20% error relative to the measured values (Table 3). In the case of 6M FU, the measured SBP and DBP values were not available, and only the measured EF value was compared with the computed one. The computed EF value of 6M FU (Case I) agreed well with the measured data (1.08% error). The computed EDV, ESV and MDV values of 1M FU and 6M FU had errors less than 10% compared with the measured values.
Table 4 shows the comparison between the measured data and the computed values for Case II. The computed EDV, ESV, and MDV values of pre-MVCA had errors less than ~5% compared with the measured data. The computed EDV, ESV, and MDV values of pre-MVCA agreed well with the measured values (within ~5% error range). For the post-MVCA model of the Case II, only the 1M FU data were compared. The computed SBP and DBP values had relatively large errors of 13.5% and 19.04%, respectively. However, the computed EF value was within the error range (~8%). In the cases of EDV, ESV and MDV values, the computed data of 1M FU agreed well with the measured values within the error range of 5% (Table 4).
Simulation of the patient-specific model
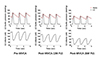
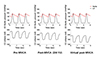
Transient variations in LV pressure and volume, as well as aortic blood pressure, were calculated from the patient-specific ventricular simulations of the two patients (Figs. 3 and 4). In Case I, the LV and aortic pressures did not change much after 1M FU of post-MVCA, but remarkably decreased after 6M FU of post-MVCA. The LV volume of pre-MVCA also decreased gradually after 6M FU. Case II underwent MVCA treatment, but the clinical outcome was not good. As shown in the upper panel of Fig. 4, the LV and aortic blood pressures did not change after MVCA. Additionally, an extremely overloaded volume of the patient's LV did not decrease, even after MVCA treatment. In the case of the virtual test with a tighter degree of LV circumference, the LV volume decreased remarkably, showing the relief of volume-overloaded LV hypertrophy.
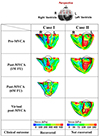
To evaluate the effect of stress unloading in post-MVCA ventricles, we analyzed the ‘von-Mises stress’ (hereafter, ‘stress’) distribution of the myocardium. Fig. 5 shows how end-diasystolic stress distribution changed in pre- and post-MVCA for Cases I and II. The left panel of Fig. 5 represents the spatial distribution of stress exerted on the ventricular muscle at the end of diasystole in Case I. In this case, the high-stress region of pre-MVCA in the ventricular basement was reduced after 1M FU of post-MVCA. A mean stress loaded over the ventricular muscle tissue was also significantly reduced after 6M FU of MVCA, from 95 kPa to 87 kPa. Interestingly, the high-stress region of pre-MVCA in the ventricular apex nearly disappeared after 6M FU, indicating recovery of both ventricles.
In Case II, a poor clinical outcome was observed in spite of marked reduction of mitral regurgitation, and the heart did not recover from intractable heart failure despite MVCA treatment. Interestingly, the high-stress region area increased significantly at the basement and the middle of the ventricle after MVCA (right panel of Fig. 5). Furthermore, the mean stress load on the ventricular muscle tissue increased from 38 kPa to 40 kPa after MVCA. To propose a physiological hypothesis for the bad clinical outcome of Case II, we tested the virtual post-MVCA model by tightening the diameter of the ventricular basement (Fig. 1). Compared with the pre-MVCA model, a 2% decrease in diameter was observed in the actual post-MVCA model, while a 7% decrease in diameter was observed in the virtual post-MVCA model. In the virtual post-MVCA model, the high-stress region clearly decreased at the base and the middle of the ventricle (Fig. 5). Moreover, the mean stress on the ventricular wall decreased significantly after virtual cerclage, from 38 kPa to 35 kPa, indicating that tightening of the LV basement can induce stress unloading of the ventricular muscles, as seen in Case II.
DISCUSSION
MVCA is a less invasive and cost-effective technique for heart-failure patients. However, the clinical outcome is not easily predicted and the MVCA treatment-derived benefits that contribute to cardiac recovery remain unclear. In this sense, cardiac simulation has significant potential for understanding the fundamental physiological mechanism and for outcome prediction of virtual MVCA treatment.
In this paper, we presented virtual cardiac simulations by coupling electrophysiology with an excitation contraction model in pre-MVCA and post-MVCA models. Our aim was to compare the computed values with the clinical values in the pre-MVCA models for clinical validation. We also aimed to understand the biomechanical and physiological mechanism of the stress unloading effect in post-MVCA. Furthermore, a long-term purpose was to apply this technology to optimize a patient-specific cardiac MVCA treatment strategy.
There are three main findings from this study. First, we developed an electromechanical method for a patient-specific ventricle model. To validate the present method, we compared the computed SBP, DBP, EF, EDV, ESV, and MDV values in the patient-specific MVCA ventricle model with clinically measured values. Relatively good agreement between the clinically measured data and the computed results was observed (Tables 3 and 4). The mean differences in SBP, DBP, and EF between the clinical and simulated data were all ~12% in the pre-MVCA models, while those in the post-MVCA models were ~18%.
Second, a correlation between post-MVCA clinical outcome and MVCA-derived electromechanical changes (Fig. 5) was investigated to explain the underlying mechanism of the benefits of MVCA treatment. The recovery of damaged heart muscle is strongly affected by stress unloading. It is well known that after heart surgery, over time, a lower level of myocardial stress can aid in heart recovery. Compared with the pre-MVCA model, the high-stress region was reduced in the heart-recovered Case I after MVCA. In the recovery-failed Case II, the region was enlarged after MVCA (Fig. 5). After MVCA, the spatially and temporally averaged stress of ventricular muscle tissue was reduced in the clinically heart-recovered Case I, but increased in the clinically recovery-failed Case II. These findings suggest that the reduced region of high stress after MVCA contributes to the electromechanical benefit of the patient-specific ventricular morphology, aiding in heart recovery. This point is also supported by previous studies in which the ventricular shape, size, and wall stress were shown to affect cardiac diseases [14151617].
Lastly, previous animal studies have shown that the tightening degree of the basement cerclage suture is a significant factor for successful heart recovery and must be carefully determined by a patient-specific scheme. As pointed out in the previous paper [2], it is challenging to determine the optimal tightening degree of the mitral septal-lateral dimension. We suggest that the present simulation method be used for this purpose. For example, one of the recovery-failed cases (Case II) was selected and modeled by the present simulation method. Next, we computed the stresses exerted on the ventricular myocardial tissue. According to the simulated results, the stresses were not adequately reduced (i.e., one critical benefit of this cardiac electromechanics simulation is the computation of virtual solutions to predict outcome from a virtual MVCA prior to real medical treatment). Thus, this preoperative rehearsal planning tool could be useful in determining the proper tension of the suture line to optimize the MVCA strategy.
However, the present study has several limitations. This simulation is not immediately applicable in clinical practice because the present method was validated only in two typical cases. Many cases should be investigated to validate the present cardiac electromechanics simulations in the actual MVCA model and in the virtual MVCA model. We did not mimic a patient-specific electrophysiological characteristics in these simulations. And the same lumped parameters obtained from pre-MVCA were used for the post-MVCA models. This may be inaccurate in advanced heart disease because the lumped parameters can be affected by the patient-specific cardiac recovery capability after MVCA. In the future, the MVCA-derived cardiac and circulatory conditions will be considered. Despite these limitations, we believe that this simulation has potential for clinical applications by associating influences between electromechanical changes induced by ventricle morphology and subsequent heart recovery. The results from this study suggest that a patient-specific ventricular modeling approach to identify a non-invasive MVCA target radius and stress load on the ventricular muscle tissue prior to the clinical procedure is feasible.
CONCLUSIONS
We developed a patient-specific electromechanical model of the MVCA treatment by coupling cardiac electrophysiology with heart mechanics. Computed results of this model was compared with clinical data. We found that heart recovery was affected by ventricular stress distribution. Reduced ventricular stresses in the basement after MVCA treatment were observed in the recovered patient model. On the other hand, increased ventricular stresses in the basement after MVCA treatment were found in the recovery-failed patient model. In the recovery-failed case after MVCA, more virtual tightening of the ventricular basement diameter than the actual model can induce stress unloading, aiding in heart recovery. This pre-operative rehearsal planning tool may help to determine the proper tension of the suture line to optimize the MVCA strategy for better clinical performance.
 XML Download