

 PDF
PDF ePub
ePub Citation
 Print
Print


INTRODUCTION
According to Global Cancer Observatory, breast cancer is one of the most common malignancies in women and the third most common tumor worldwide. In 2012, more than 1.7 million people were diagnosed with breast cancer worldwide [1]. In the United States, 231,840 cases of invasive breast cancer and 60,290 cases of breast carcinoma in situ were diagnosed in 2015, but mortality decreased by 36% from 1989 to 2012, saving 249,000 lives in the United States alone. Although overall breast cancer mortality has decreased in some developed European and North-American countries, disparities in breast cancer mortality rates continue to widen between black and white women in the United States [2]. Moreover, breast cancer morbidity and mortality continue to increase in some Asian countries, such as China [3]. In patients with advanced breast cancer, prognosis is usually poor, immune suppression is very common, and the mechanisms underlying this suppression are poorly understood.
MicroRNAs are endogenous noncoding, small, single-stranded RNA molecules that are 21–25 nucleotides in length and ubiquitous among eukaryotes. Mature microRNAs bind to the 3′ untranslated region (UTR) of target messenger RNAs (mRNAs) to promote their degradation or inhibit translation and, therefore, regulate the expression of endogenous genes. Accordingly, microRNAs are involved in the regulation of cell proliferation, migration, differentiation, apoptosis, and other cellular activities. Many studies have confirmed microRNAs to be aberrantly expressed in almost all malignant tumors [4].
The B7 family comprises important co-stimulatory molecules that can promote or inhibit the proliferation of T cells, B cells, and other immune cells, thereby affecting the body's immune response. T-cell activation requires two signals, and the B7 family is one of the most important co-stimulatory signal families. The first is an activation signal via the T-cell receptor through the recognition of a major histocompatibility complex-antigen complex presented by antigen-presenting cells (APCs). The second signal involves the ligation of co-stimulatory or co-inhibitory molecules expressed on APCs and on T cells belonging to the B7 and tumor necrosis factor families [5]. Many studies have shown that the expression of a variety of B7 family members, such as programmed cell death 1 ligand (PD-L1), also referred to as cluster of differentiation 274 (CD274), and cytotoxic T-lymphocyte associated protein 4 (CTLA4) can inhibit the immune response and result in tumor immune escape [6]. Several immune checkpoint inhibitors have been developed [7], such as the CTLA4-blocking antibody ipilimumab, and the PD-L1-blocking antibodies, nivolumab and pembrolizumab, which enhance T-cell recognition of tumor cells and, therefore, have antitumor therapeutic effects.
In previous studies, microRNA (miR)-424 and miR-138 have been shown to regulate CD274 in breast and ovarian cancer [89]. However, microRNAs targeting all members of the B7 family have not been systematically studied. Based on the The Cancer Genome Atlas (TCGA) database, we analyzed the expression of B7 family members and the microRNAs that target this family in breast cancer. Additionally, we assessed the predictive value of these microRNAs and the B7 family on the prognosis of breast cancer.
METHODS
TCGA breast cancer transcriptome profiling analysis
To assess the expression of the B7 family in breast cancer, we downloaded the complete data set of 1,092 patients with breast cancer, including gene and microRNA expression quantification data from 1,109 tumor samples and 113 adjacent tissues (update to 2016-07-21), from the National Cancer Institute and National in Human Genome Research Institute TCGA (https://cancergenome.nih.gov/) database. The R language (https://www.r-project.org/) and edgeR package [10] were used for statistical analysis and homogenization. Differential expressed gene and microRNA were identified by a fold-change value higher than one and a p-value lower than 0.05.
Sorting analysis of the most likely microRNAs targeting the B7 family
To identify the microRNAs that regulate B7 family members, we used four microRNA prediction tools: TargetScan (http://www.targetscan.org/vert_71/), miRanda (http://www.microrna.org/), DIANA TOOLS (http://diana.imis.athena-innovation.gr/DianaTools/index.php), and miRDB (http://www.mirdb.org/miRDB/). Venn diagrams (http://bioinformatics.psb.ugent.be/webtools/Venn/) were used to visualize the overlap between the predicted B7 targeting microRNAs and the differentially expressed microRNAs in breast cancer according to the TCGA database.
Cell culture
Human breast cancer cell lines MCF7, MDA-MB-231, SK-BR-3 and human fibrocystic disease epithelium cell lines MCF10A were obtained from the Sun Yat-sen University Cancer Center (State Key Laboratory of Oncology in South China, Guangzhou, China). Breast cancer cell lines were cultured in high glucose, L-glutamine Dulbecco's Modified Eagle Medium (DMEM) (Gibco, New York, USA) supplemented with 10% fetal bovine serum (Gibco). MCF10A cells were cultured in DMEM/F12 (Gibco) containing 5% horse serum (Gibco), insulin (10 µg/mL; Science Sun, Beijing, China), glucocorticoids (0.5 µg/mL; Harbin Pharmaceutical, Harbin, China), and epidermal growth factor (20 ng/mL; Gibco). All cell lines were maintained in a 5% CO2 incubator at 37℃.
Cell transfection with microRNA mimic
miR-195 and miR-497 mimics and microRNA mimic control (Ribobio, Guangzhou, China) were transfected into cells using Lipofectamine RNAiMAX (Invitrogen, Carlsbad, USA) according to the manufacturer's instructions. Protein lysates and total RNA were collected 48–72 hours after the transfection.
Quantitative real-time polymerase chain reaction
Total RNA was isolated using TRIzol reagent (Thermo Fisher Scientific, Waltham, USA) according to the manufacturer's instructions. B7 family members complementary DNAs (cDNAs) were synthesized using oligo-dT with ReverTra Ace qPCR RT Kit (Toyobo, Osaka, Japan), and quantitative real-time polymerase chain reaction (qRT-PCR) was performed with the SuperReal PreMix Plus (SYBR Green) (Tiangen, Beijing, China). Primers were designed using the National Center for Biotechnology Information primer design software. CD274 (forward: 5′-TGGCATTTGCTGAACGCATTT-3′, reverse: 5′-TGCAGCCAGGTCTAATTGTTTT-3′), HHLA2 (forward: 5′-GCAGCGTGTTAAGTGTTTATCCT-3′, reverse: 5′-AGGCCATCTTTCATCGTCCAG-3′), CD276 (forward: 5′-GCGTCCCTGAGTCCCAGA-3′, reverse: 5′-ACGCAGCATCTTCCTGTGAG-3′), ICOSLG (forward: 5′-CAGTGCTGAGGGGTACAGC-3′, reverse: 5′-GCATCCTTTCCAGCCC-TTCT-3′), NCR3LG1 (forward: 5′-ACCTGGGAAATCCAGGCGA-3′, reverse: 5′-CAGATCACCT-TCGGTCGTCA-3′), PDCD1LG2 (forward: 5′-ACCCTGGAATGCAACTTTGAC-3′, reverse: 5′-AAGTGGCTCTTTCACGGTGTG-3′). MicroRNA cDNAs were synthesized with All-in-One™ miRNA First-Strand cDNA Synthesis Kit (Genecopoeia, San Diego, USA), and qRT-PCR was done with the All-in-One™ miRNA qPCR Kit (Genecopoeia). Relative expression changes were calculated using the 2−ΔΔCT (where Ct is threshold cycle) method. Three technical replicates were performed for each sample in each experiment and results were expressed as the mean of three independent biological experiments.
Western blotting
Cells were washed twice in phosphate-buffered saline (Beyotime, Shanghai, China), lysed in ice-cold radioimmune precipitation assay (Beyotime) buffer, and then centrifuged for 10 minutes at 4℃. Supernatant was collected, and protein concentrations were determined using the BCA Protein Assays (Invitrogen). Cell lysates were separated by SDS-PAGE (Beyotime) gel and transferred to polyvinylidene difluoride membranes (Merck Millipore, Darmstadt, Germany). Membranes were blotted with 10% nonfat milk, washed in Trisbuffer saline (TBS) with 0.1% Tween (Beyotime) and incubated with primary polyclonal antibodies overnight at 4℃. After washing with TBS-Tween, membranes were incubated with secondary antibody (horseradish peroxidase conjugated IgG; Cell Signaling Technology, Danvers, USA) for 60 minutes at room temperature. Then, they were washed again with TBS-Tween and detected using the ChemiDoc Touch imaging system (Bio-Rad, Carlsbad, USA). PD-L1 (E1L3N®) XP® Rabbit mAb (1:1,000; Cell Signaling Technology) and β-Actin (13E5) Rabbit mAb #4970 (1:2,000; Cell Signaling Technology) were used for Western blotting.
Luciferase assay
CD274-miRNA-binding sites were predicted by TargetScan. The wild-type CD274 3′UTR was cloned into the pmiR-RB-REPORT™ vector (RiboBio). Mutant CD274 3′UTR (RiboBio) was generated based on the pmiR-RB-CD274-3′UTR by mutating all binding sites that are recognized by miR-195 and miR-497. Firefly and Renilla Luciferase activity was measured sequentially using the dual-luciferase assay kit (Promega, Madison, USA) 24 hours after the transfection.
Overall survival analysis
We used TCGA database of breast cancer data to identify B7 family members and microRNAs that correlated with survival. The data were imported into Cutoff Finder (http://molpath.charite.de/cutoff/) [11], and Kaplan-Meier and log-rank tests were used to select an optimal cutoff value (p<0.05) and to analyze survival.
RESULTS
Differentially expressed B7 family member genes in TCGA breast cancer database
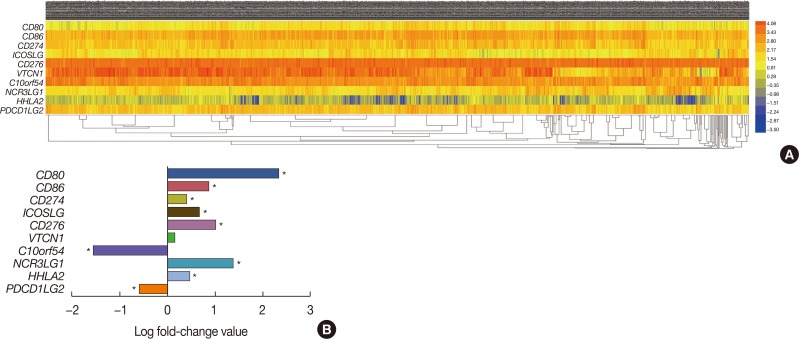
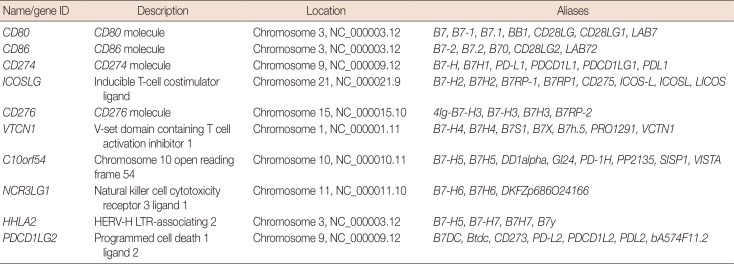
Ten members of the B7 family are showed in Table 1. To assess the expression of B7 family members in breast cancer, we analyzed the transcriptome profiling (gene expression quantification) data of 1,109 tumor samples and 113 adjacent tissues from the TCGA breast cancer database (Figure 1A). The expression level of 3,204 genes was decreased, whereas the expression level of 7,413 genes was increased (p<0.05). Within the B7 family, seven (CD80, CD86, CD274, ICOSLG, CD276, HHLA2, and NCR3LG1) and two (C10orf54 and PDCD1LG2) genes were up- and downregulated, respectively (Figure 1B). Moreover, the expression of VTCN1 was also slightly upregulated, but this difference was not statistically significant (p>0.05).
Expression and survival analysis of six B7 family members
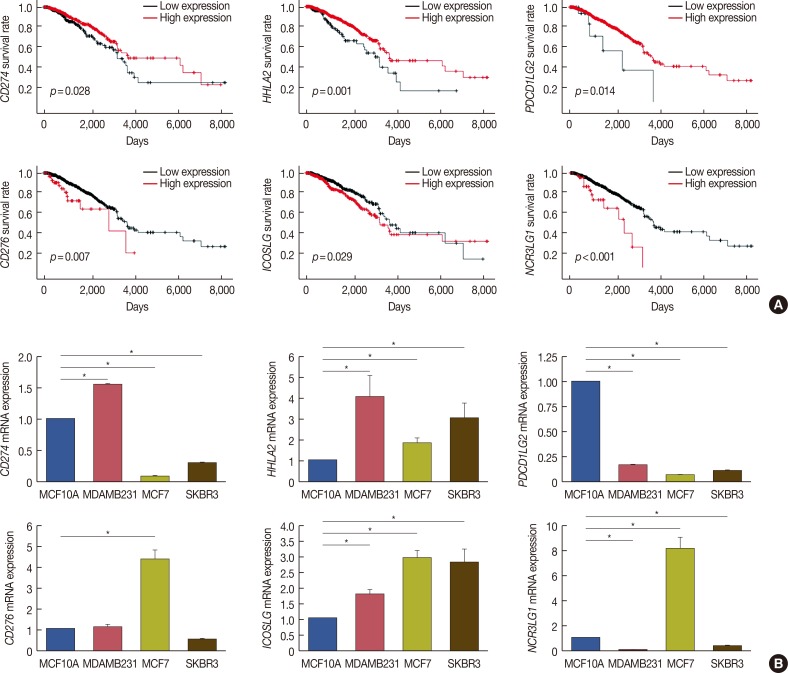
We extracted survival data from the TCGA database and identified six members of the B7 family whose expression was related to the survival of patients with breast cancer (log-rank p<0.05). Notably, high expression of CD274, HHLA2, and PDCD1LG2 correlated with longer survival, whereas high expression of CD276, ICOSLG, and NCR3LG1 correlated with shorter survival (Figure 2A). These results suggest that these six members of the B7 family may be able to predict the prognosis and immune status of breast cancer patients, making them potential targets for the treatment of breast cancer.
We validated these TCGA data in our cell culture models using qRT-PCR. In detail, we found that the expression level of CD274 was higher in MDA-MB-231 cells than in MCF-10A. CD276 showed high expression in MCF7, whereas there was no statistically significant difference in its expression levels between MDA-MB-231, SK-BR-3, and MCF-10A. MCF-7 also showed increased levels of NCR3LG1. The expression of PDCD1LG2 was low in all three breast cancer cell lines, whereas HHLA2 and ICOSLG were upregulated in all three tumor cell lines (Figure 2B). This was consistent with bioinformatics prediction in Figure 1. It should be noted that the three different breast cancer cell lines showed overall differences in the expression levels of these B7 family genes.
Identification of the microRNA targeting B7 family member genes in breast cancer
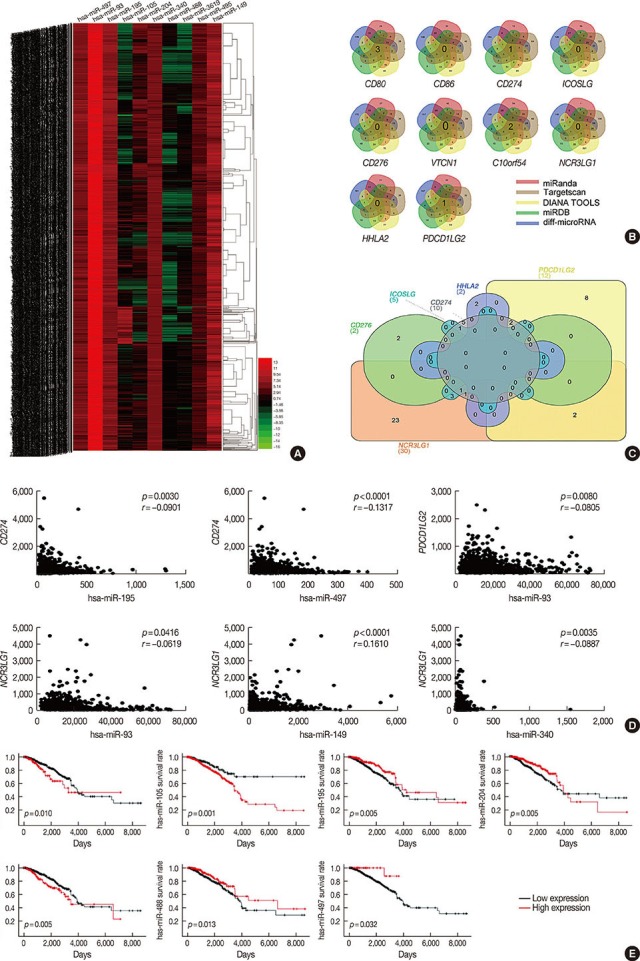
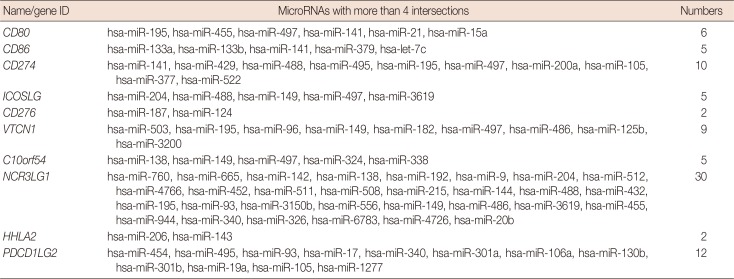
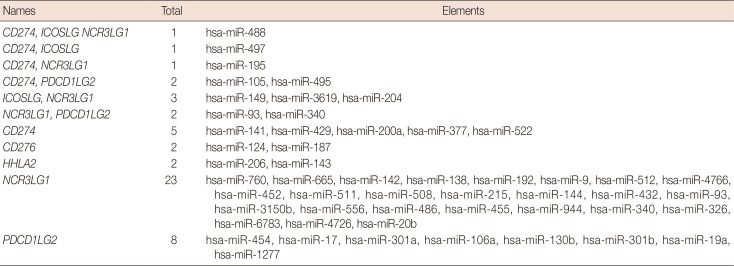
To identify microRNAs targeting B7 family members, we first analyzed the transcriptome profiling (microRNA expression quantification) data from the TCGA breast cancer database. It this data set 256 microRNAs were differentially expressed (190 up- and 66 downregulated microRNAs), and Figure 3A shows the heatmap of a subset. As the next step, for each member of B7 family, we used Venn diagrams to visualize and retrieve the list of microRNAs that overlap between the data sets predicted to target members of the B7 family by the four databases and the list of 256 differentially expressed microRNAs in the TCGA breast cancer database (Figure 3B). More than four intersections dataset are showed (Table 2). Furthermore, we used Venn diagrams to identify the intersection of these microRNAs targeting the B7 family (Figure 3C), which showed the following: miR-488 may target CD274, ICOSLG, and NCR3LG1; miR-497 may target CD274 and ICOSLG; miR-195 may target CD274 and NCR3LG1; miR-105 and miR-495 may target CD274 and PDCD1LG2; miR-149, miR-3619, and miR-204 may target ICOSLG and NCR3LG1; an miR-93 and miR-340 may target NCR3LG1 and PDCD1LG2 (Table 3). We further analyzed the correlation between the gene expression levels of microRNAs and the respective targets within the B7 family. We demonstrated that miR-93 negatively correlated with PDCD1LG2 and NCR3LG1, miR-497 negatively correlated with CD274, miR-195 negatively correlated with CD274, and that miR-340 negatively correlated NCR3LG1 (p<0.05) (Figure 3D).
We analyzed the correlation between microRNAs and survival. Specifically, high miR-93, miR-105, and miR-340 expression levels were associated with a poor prognosis in patients with breast cancer, whereas high levels of miR-195, miR-204, miR-488, and miR-497 were associated with a good prognosis among these patients (p<0.05) (Figure 3E), which suggests that the relationship of these microRNA and the B7 genes may have targeting regulation relationship and prognostic value. The expression levels of miR-149, miR-495, and miR-3619 did not correlate with survival in this patients' subset (p>0.05) (data not shown). We also analyzed the correlation between miR-206 and miR-143 expression levels with HHLA2 but did not find any statistically significant interaction, probably due to low levels of microRNA expression and small sample size (data not shown).
In summary, we conclude that CD274 is potentially regulated by miR-195 and miR-497, NCR3LG1 is potentially regulated by miR-93 and miR-340, while PDCD1LG2 is potentially regulated by miR-93.
miR-195 and miR-497 directly target CD274
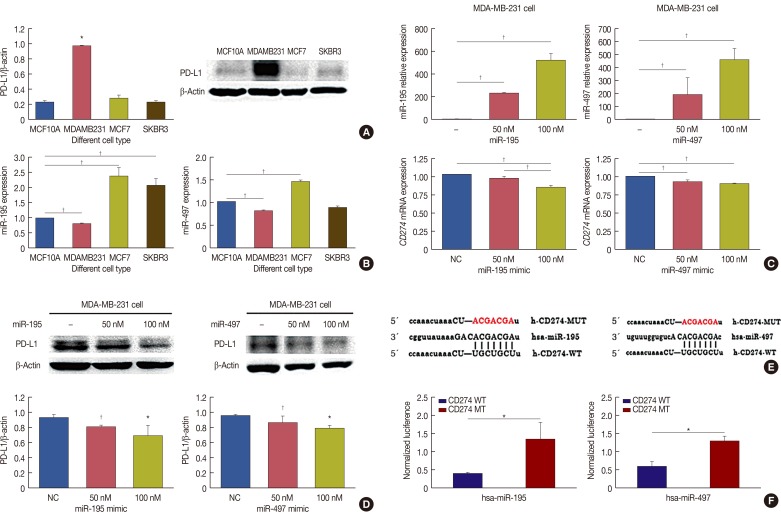
We chose CD274 for further investigation. We performed western blot analysis on protein samples extracted from MCF7, MDA-MB-231, SK-BR-3 and MCF10A cell lines, and found that CD274 protein level was higher in MDA-MB-231 cells than in the other breast cancer cell lines or the control cell line (Figure 4A). We analyzed the expression levels of miR-195 and miR-497 in the four cell lines by qRT-PCR and found that these were lower in the MDA-MB-231 breast cancer cell line than in the matched human fibrocystic disease epithelium cell line MCF10A (Figure 4B). CD274, thus, negatively correlated with miR-195 and miR-497 levels in MDA-MB-231 cells. These results suggest that CD274 is a potential target of miR-195 and miR-497 in MDA-MB-231 breast cancer cell line, which is a model of triple-negative breast cancer (TNBC). To challenge this prediction, we detected the mRNA and protein expression of CD274 in MDA-MB-231 cells in the presence of miR-195 and miR-497 mimics (Figure 4C). The results showed that CD274 mRNA and protein expression was significantly reduced by treatment of MDA-MB-231 cells with miR-195 and miR-497 mimics (Figure 4D).
To verify whether CD274 is a direct target of miR-195 and miR-497, a human CD274 3′UTR fragment, containing either the wild-type or mutant miR-195 and miR-497 binding site, was inserted downstream of the luciferase open reading frame (Figure 4E). The luciferase assay showed that the luciferase activity of the reporter containing the wild-type CD274 3′UTR was decreased by the treatment with miR-195 and miR-497 mimics, whereas the reporter containing the mutated sequences was not obviously altered by this treatment (Figure 4F). These results demonstrated that CD274 is a target of miR-195 and miR-497 in MDA-MB-231 cells.
In conclusion, we have shown that miR-195 and miR-497 target CD274; further studies will be aimed at confirming other bioinformatics prediction such as that miR-93 may target NCR3LG1 and PDCD1LG2, and that miR-340 may target NCR3LG1 and CD274.
DISCUSSION
Ten members of the B7 family have been identified to date: CD80 (B7-1), CD86 (B7-2), CD274 (B7-H1), ICOSLG (B7-H2), CD276 (B7-H3), VTCN1 (B7-H4), C10orf54 (B7-H5), NCR3LG1 (B7-H6), HHLA2 (B7-H7), and PDCD1LG2 (B7-DC). B7 family-mediated immunosuppression is an important part of the dynamic balance of the immune system because it limits the immune response and prevents autoimmune diseases. The most-studied immune mediators include CTLA-4 and its shared ligands, CD80 (B7-1), and CD86 (B7-2), as well as programmed cell death (PD)-1 and its shared ligands, CD274 (B7-H1) and PDCD1LG2 (B7-DC). PD-1/PD-L1 and B7/CTLA-4 immune checkpoint inhibitors have been used in clinic to treat melanoma, non-small cell lung cancer, kidney cancer, non-Hodgkin's lymphoma and bladder cancer. However, the efficacy of immune checkpoint inhibitors for the treatment of breast cancer is limited, and only a few studies showed that anti-PD-1/PD-L1 therapy affects TNBC [12]. More clinical trials and efficacy studies are ongoing.
A previous study found that microRNAs can bind to the 3′-UTR of some B7 family members to regulate the occurrence and development of tumors by affecting the body's immune regulation. For example, the miR-132-3p, miR-212-3p, and miR-361-5p binding sites in the CD80 gene are involved in the development and progression of gastric cancer in the Han Chinese population [13]. Moreover, miR-424 (322) affects the immune regulation and drug resistance of ovarian cancer by targeting CD80 and CD274 (PD-L1) [9], and miR-134 targets CD86 (B7-2) to enhance antitumor immunotherapy with high-intensity focused ultrasound [14]. Furthermore, miR-513, miR-570, miR-20b, miR-21, miR-130, miR-197, miR-200, and miR-34 regulate CD274 in retinoblastoma, gastrointestinal cancer, and colorectal cancer [1516171819]. Specifically, miR-24 regulates the development of gastric cancer by targeting B7-H2 [20], and miR-29, miR-187, miR-124, and miR-155/143 can regulate tumor microenvironment and cancer cells immune escape in various types of tumors, including breast cancer, neuroblastoma, sarcomas, brain tumors, osteosarcoma, and colorectal cancer, by targeting CD276 [21222324].
TNBC is an aggressive tumor and difficult to treat. Among the different types of breast cancer, TNBC has the highest prevalence of immune infiltration, followed by human epidermal growth factor receptor 2-positive and estrogen receptor-positive cancers. In TNBC high levels of immune infiltration is either measured by tumor-infiltrating lymphocyte (TIL) count or captured by various immune gene signatures. Some TNBC cells express high levels of PD-L1, a ligand that binds and inactivates PD-1-expressing TIL, allowing cancer cells to weaken and escape immune surveillance. This has been proposed to be one of the main reasons why the prognosis of TNBC is worse than the one of other breast cancers.
We found that CD80, CD86, CD274, ICOSLG, CD276, HHLA2, and NCR3LG1 were upregulated while C10orf54 and PDCD1LG2 were downregulated in breast cancer based on an analysis of the TCGA database. We subsequently analyzed the relationship between B7 family members and survival, and found that CD274, ICOSLG, CD276, NCR3LG1, HHLA2, and PDCD1LG2 were associated with the survival of patients with breast cancer. Specifically, high CD274, HHLA2, and PDCD1LG2 expression levels were associated with a better prognosis, whereas high levels of ICOSLG, CD276, and NCR3LG1 suggested a worse prognosis. We examined six genes (CD274, HHLA2, PDCD1LG2, CD276, ICOSLG, and NCR3LG1) by qRT-PCR analysis. We found that the expression of these six genes was consistent with TCGA bioinformatics prediction. Notably, CD274, ICOSLG, CD276, HHLA2, NCR3LG1 and PDCD1LG2 were identified as important differentially expressed genes in patients with breast cancer that could predict survival. In previous studies, PD-L1 expression was associated with a significantly worse overall survival (OS) based on an analysis of 650 breast cancer tissue samples [25]. However, Baptista et al. [26] found that PD-L1 expression was significantly associated with better OS in patients with breast cancer. Despite its association with poor clinical and pathologic features, PD-L1 expression has emerged as a positive prognostic biomarker in breast cancer. Thus, the role of CD274 (PD-L1) in the survival of patients with breast cancer is controversial. Nevertheless, we found that high CD274 expression indicated a good prognosis in patients with breast cancer. Moreover, ICOS/ICOSLG were found to be able to recruit plasma-like dendritic cells and CD4+ T cells, leading to poor prognosis in patients with breast cancer [27]. CD276 expression is associated with poor prognosis in non-small cell lung cancer and lymph node metastasis in breast cancer [2829]; however, HHLA2 is widely expressed in human malignancies, where it can suppress CD4 and CD8 T cells activity, and is therefore associated with poor prognosis in many tumors. Specifically, high HHLA2 expression was significantly associated with regional lymph node metastasis and stage [30]. Furthermore, the role of NCR3LG1 in breast cancer has not yet been identified.
Bioinformatic analysis predicted that miR-497 may target CD274; miR-195 may target CD274; miR-340 may target NCR3LG1; miR-93 and miR-340 may target NCR3LG1 and PDCD1LG2. We chose miR-195 and miR-497 targeting CD274 for our further studies. PCR and Western blot analysis showed that CD274 was negatively correlated with miR-195 and miR-497 expression in the MDA-MB-231 TNBC cell line. In addition, we demonstrated that transfection of miR-195 and miR-497 reduced the expression of CD274. To verify that CD274 is a direct target of miR-195 and miR-497, we cloned the 3′UTR of the human CD274 gene downstream of the luciferase coding sequence and demonstrated that miR-195 and miR-497 modulate CD274 expression by binding to the 3′UTR.
Further studies will be aimed to investigate the relationship between breast cancer and immune cells and to address whether the remaining microRNAs here identified as potentially targeting B7 family members, can indeed have this role both in vitro and in vivo.
In summary, we found that the differentially expressed B7 family members identified from the TCGA database (CD274, ICOSLG, CD276, HHLA2, NCR3LG1, and PDCD1LG2) have prognostic significance in patients. Furthermore, we could experimentally validate the bioinformatically predicted targeting of miR-195 and miR-497 to the CD274 3′UTR. Whether also the other bioinformatic targeting predictions (such as miR-93 targeting NCR3LG1 and PDCD1LG2, and miR-340 targeting NCR3LG1 and CD274) could be experimentally validated is currently under investigation.
These results suggest that these microRNAs may predict the effect of immunotherapy, and be a target for future breast cancer immunotherapy.
 XML Download