

 PDF
PDF Citation
 Print
Print


Abbreviations
allo
allogeneic
APC
antigen presenting cell
B6
C57BL/6
BLI
bioluminescence imaging
BM
bone marrow
BMT
bone marrow transplantation
BrdU
bromodeoxyuridine
cDC
conventional dendritic cell
DC
dendritic cell
FDR
false discovery rate
GMFI
geometric mean fluorescence intensity
GSEA
gene set enrichment analysis
GVHD
graft-versus-host disease
iNOS
inducible nitric oxide synthase
IRF
interferon regulatory factor
KO
knockout
Ly6G+
Gr-1+
MACS
magnetic-activated cell sorting
MDSC
myeloid-derived suppressor cell
MiHA
minor histocompatibility antigen
MST
mean survival time
MyD88
myeloid differentiation factor 88
PBL
peripheral blood leukocyte
PMN
polymorphonuclear
RT
radiotherapy
TCD
T cell-depleted
TipDC
tumor necrosis factor-α- and inducible nitric oxide synthase-producing dendritic cell
TRIF
toll/interleukin-1 receptor-domain-containing adapter-inducing interferon-β
VSV
vesicular stomatitis virus
WT
wild type
INTRODUCTION
Graft-versus-host disease (GVHD) is a major complication after allogeneic (allo) bone marrow transplantation (BMT), which is performed for treatment and immune reconstitution of patients with hematological disorders, including lymphoma and leukemia (1234). Activation of donor-derived T cells recognizing the allo-major histocompatibility complexes (MHCs) and allo-minor histocompatibility antigens (MiHAs) of the recipients is considered the major mechanism underlying GVHD generation, resulting in inflammation and morbidity at multiple organs and sometimes even mortality of the recipient (3). In this respect, T cell allo-response is a major target for control of GVHD (35).
T cell activation and effector differentiation is influenced by innate cell activation. In bone marrow (BM) recipients, preconditioning (i.e., irradiation)-associated cell damage and exposure to intestinal microbes induce release of various cellular or microbial products, lipids, carbohydrates, and homeostatic proteins, which bind to Toll-like receptors (TLRs) (67). TLR engagement with their ligands transduces signals through adaptor molecules, i.e., myeloid differentiation factor 88 (MyD88) and/or toll/IL-1 receptor-domain-containing adapter-inducing interferon-β (TRIF), and induces production of inflammatory cytokines and maturation and differentiation of myeloid cells, such as dendritic cells (DCs) and neutrophils (89). The inflammatory environment enhances T cell activation, intensifying T cell-effector function, which damages recipient cells and tissues and promotes GVHD generation (1011). On the other hand, TLR engagement also activates anti-inflammatory innate cells, i.e., myeloid-derived suppressor cells (MDSCs). MDSCs are known to function as innate immune regulatory cells through induction of activated T cell death, which is mediated by suppressive mediators or anti-inflammatory cytokines in a cell-cell contact-dependent manner (12). Thus, manipulation of innate activity to induce dominant MDSC function could be a promising way to control GVHD.
MDSCs are composed of heterogeneous immature myeloid cells with multi-differentiation potentials. Phenotypically, they are defined as CD11b+Gr-1+ cells in mouse, and subgrouped to CD11b+Ly6ChiLy6Glow monocytic (M) and CD11b+Ly6ClowLy6Ghi polymorphonuclear (PMN) MDSCs (131415). Because these markers are shared with other myeloid lineage cells, additional surface markers, including CD124 and CD244, have been actively tested for fine demarcation of MDSCs from monocytes and neutrophils (1617). Expression of suppressor molecules, inducible nitric oxide synthase (iNOS), arginase-1, or IL-10, is useful criteria for functional identification of MDSCs (1819). CD11b+Gr-1+ cell fractions reach up to 80%–90% in peripheral blood leukocytes (PBLs) of GVHD animal models and patients (520). Reports on GVHD aggravation in the absence of sufficient numbers of MDSCs indicate the presence of protective roles played by MDSCs even during GVHD progression (1521). The fact that supplementation of BM or in vitro generated CD11b+Gr-1+ cells alleviated GVHD (222324) signifies the potential of MDSCs as a therapeutic agent. Nonetheless, MDSC biology, including the generation and maintenance in myelopoiesis, remains not fully understood, especially in the context of GVHD.
Our previous study has shown that use of MyD88-deficient mice (Myd88−/− C57BL/6 [B6]; hereafter referred to as MyD88-knockout [KO]) as allo BM donors resulted in aggravation of GVHD, with significantly reduced mean survival time (MST) and increased intestinal inflammation in both MHC/MiHA-fully mismatched and MiHA-only mismatched models (22). GVHD aggravation in the allo MyD88-KO recipients was associated with lack of CD11b+Gr-1+ MDSCs expanded from MyD88-KO BM. These results indicate implication of TLR/MyD88-signaling axis in anti-inflammatory function, promoting MDSC expansion, and thus protecting hosts from severe GVHD development. However, the cellular mechanism underlying the lack of MDSC expansion from MyD88-KO BM, leading to severe inflammation in GVHD hosts while non-GVHD hosts are not significantly affected, remains unknown. Investigation on the dynamics of MyD88-KO BM progenies, especially the CD11b+Gr-1+ cell population with MDSC potential, in GVHD hosts is essential to address these issues.
To elucidate this cellular mechanism, we investigated the in vivo dynamics of MyD88-KO and wild type (WT) BM progenies, focusing on their proliferation and differentiation, in GVHD and non-GVHD hosts. The results show that, in a highly inflammatory environment, MyD88-KO BM-derived CD11b+Gr-1+ cells preferred to differentiate into DCs, instead of expanding as MDSCs, suggesting this as the main mechanism underlying GVHD aggravation after MyD88-KO BMT. The results of this study will be helpful for understanding MDSC biology in the context of GVHD.
MATERIALS AND METHODS
Mice
B6 (H-2b), CB10-H2b/LilMcdJ (BALB.B, H-2b), and C57BL/6J-Tyrc-2J (B6.albino, H-2b) were purchased from the Jackson Laboratory (Bar Harbor, ME, USA). MyD88-deficient mice on B6 background (B6-Myd88−/−, MyD88-KO) were generated by Kawai and colleagues (25). Transgenic mice expressing luciferase transgenic mice were backcrossed to MyD88-KO B6 background (WT B6.LucTg and MyD88-KO B6.LucTg [B6.Myd88−/− LucTg], respectively) (26). T cell receptor (TCR) transgenic J15Tg mouse that expresses TCRs specific for H60 peptide-H-2Kb was described previously (27). All mice were maintained at the Center for Animal Resource Development, Seoul National University College of Medicine with the guidelines and in compliance with the Institutional Animal Care and Use Committee of Seoul National University, Korea (IACUC No. SNU-150119-7-7).
Induction of acute GVHD and bioluminescence imaging (BLI) analysis
T cell-depleted (TCD) BM cells were prepared from tibia and femur of WT or MyD88-KO mice as described previously (22). In brief, splenic T cells were prepared from B6 WT mice. MHC-matched but MiHA-mismatched BALB.B mice were used as allo recipients of the 5×10⁶ TCD BM only (non-GVHD BALB.B hosts) or together with 5×10⁶ splenic T cells (GVHD BALB.B hosts). Syngeneic B6 mice (B6→B6) used as non-GVHD control. Total body irradiation was performed with split dose of 900cGy from 37Cs source with 5 h interval. Acute GVHD was monitored by scoring clinical parameters as previously described (28). For BLI analysis, LucTg mice backcrossed to MyD88-KO B6 or WT B6 background used as BM donors. In vivo dynamics of the engrafted TCD BM cells were longitudinally monitored using an IVIS 100 imaging system and the intensity of the emitted light was quantitated using Living image software (Perkin Elmer, Waltham, MA, USA).
Flow cytometric analysis
Cells isolated from different tissues were stained with Abs in staining buffer (0.1% bovine calf serum and 0.1% sodium azide in PBS) and analyzed using LSRII flow cytometer (BD Biosciences, San Jose, CA, USA). For cytokine-production analysis, splenocytes were stimulated with 20 ng/ml PMA and 1 µM Ionomycin (Sigma-Aldrich, St. Louis, MO, USA) at 37°C incubator for 2 h, and treated with Brefeldin A (BioLegend, San Diego, CA, USA) for additional 4 h. For intracellular staining, cells were fixed, permeabilized, and stained with Abs at radiotherapy (RT) for 1 h. Abs used for FACS analysis are fluochrome-labeled Abs for arginase-1 (R&D system, Minneapolis, MN, USA), CD244 (m2B4, BioLegend), β2mb (B10.S, Santa Cruz, Dallas, Texas, USA), CD11b (M1/70), Ly6G (RB6-8C5), Ly6C (HK 1.4), and CD11c (N418). F4/80 (BM8), H-2Kb (AF6-88.5), MHCII (NIMR-4), CD80 (16-10A1), CD86 (GL1), interferon (IFN)-γ (XMG1.2), GZMB (NGZB), NOS2 (CXNFT), CD4 (GK1.5), CD8 (53-6.7), CD3 (145-2C11), NK1.1 (PK136), CD19 (6D5), CD26 (H194-112), XCR1 (ZET), and CD45R (B220; RA3-6B2) purchased from eBioscience (San Diego, CA, USA). Annexin V (eBioscience) staining was performed in annex in V-binding buffer (10 mM HEPES [pH 7.4], 140 mM NaCl. 2.5 mM CaCl2) at RT for 15 min. Geometric mean fluorescence intensity (GMFI)±standard deviation was shown when necessary.
Microarray analysis
Gr-1+ (Ly6G+) cells were isolated from splenocytes of host mice by magnetic-activated cell sorting (MACS) using anti-Ly6G and anti-Ly6C Abs (RB6-8C5; BD Pharmingen, San Jose, CA, USA) on day 7 after allo (or syngeneic) mice. Cells were used for RNA extraction when the purity was higher than 97%. For microarray hybridization, total RNA was isolated and purified using a DNA-free RNA isolation kit (RNAqueous-4PCR kit; Ambion, Austin, TX, USA) according to the manufacturer's instructions. RNA samples were first amplified for array analysis using the Illumina Total Prep RNA Amplification Kit (Ambion) as previously described (29). Amplified cRNA (1.5 µg) was hybridized on Mouse WG-6 v2 Expression BeadChip arrays (Illumina Inc., San Diego, CA, USA), containing more than 45,281 well-annotated Ref transcripts. The array chip was then scanned on a BeadArray Reader (BeadStation 500G Instrument; Illumina Inc.) and subjected to gene identification and quantitation by the Genome Studio Software v1.0.2. (Illumina Inc.).
Immune suppression and Ag-presentation assays
Splenocytes were isolated from GVHD mice on day 7 post-transplantation. Gr-1+ cells were purified after staining with biotin-conjugated anti-Ly6G using MACS (Miltenyi Biotech, Auburn, CA, USA). To obtain in vitro differentiated CD11b+Gr-1+ cells, TCD-BM cells (2×10⁵ cells/ml) were cultured in vitro in the presence of recombinant granulocyte macrophage-colony stimulating factor (GM-CSF, 200 U/ml; Pepprotech, Frankfurt, Germany) plus lipopolysaccharide (LPS) (1 µg/ml; Sigma-Aldrich) for 4 days (3031). To obtain CD45.1+ T cells used for immune suppression assay, splenocytes from CD45.1+ WT B6 mouse were stained with biotin-conjugated anti-CD3 Ab, purified by MACS, and labelled with CFSE, Invitrogen. In immune suppression assays, the CSFE-labeled T cells (1×10⁵ cells) were co-cultured for 3 days at 1:1 ratio with either CD11b+Gr-1+ isolated from GVHD hosts or in vitro cultured BM cells in the presence or absence of anti-CD3 (2 µg/ml, eBioscience) plus anti-CD28 purified Ab (1 µg/ml, eBioscience). Then, T cell proliferation was determined by CFSE dilution using an LSRII flow cytometer (BD Biosciences). In Ag-presentation assays, T cells were isolated from a TCR transgenic mice (named J15) where T cells express TCRs specific for H60/H-2Kb complexes (2732) labeled with CFSE, and co-incubated with the isolated Gr-1+ in the presence of 1 µM H60 peptide (LTFNYRNL) or vesicular stomatitis virus (VSV) peptide (RGYVYQG) at 1:1 ratio for 3 days. For T cell proliferation to test the ability of ex vivo G-1+ cell to activate allo-reactive T cells, CFSE-labeled CD45.1+ B6 T cells were co-incubated with the ex vivo cells in the absence of peptide pulse for 3 days.
In vivo bromodeoxyuridine (BrdU) assay
Mice were injected with 2 mg BrdU (Sigma-Aldrich) and followed by continuous feeding with BrdU (0.8 mg/ml) in the drinking water containing 5% glucose. After 12 h, splenocytes were stained with antibodies to detect surface Ags at 4°C for 30 min. Stained cells were fixed with ice-cold 95% ethanol for 30 min on ice, incubated with DNase I buffer at RT for 30 min and then stained with anti-BrdU Ab (BD Pharmingen).
Bioinformatic analysis of the gene expression profiles
The raw data from microarray were pre-processed through 3 steps: 1) background correction was performed, 2) the data were then log-transformed to log2 scale, and 3) normalized by the quantile normalization method implemented in the Genome Studio Software (Illumina Inc.). Significant differences among the groups were identified using ANOVA test (false discovery rate [FDR] <5%) on log2-transformed normalized data by Partek® Genomics software v6.3 (Partek, St. Louis, MI, USA) Differentially expressed genes were categorized based upon their biological functions by Gene Ontology (http://geneontology.org). Gene set enrichment analysis (GSEA) was performed to examine the significance of the enrichment of the biological subsets of interest in the whole gene expression profiles (http://www.broadinstitute.org/gsea/index.jsp). Hierarchical clustering analysis was performed with Genesis software v1.7.5 using the Pearson correlation distance matrix with average linkage algorithm (29). Significant pathways were analyzed by the tools in Ingenuity® Pathway Analysis (QIAGEN, Redwood City, CA, USA).
RESULTS
Enhanced T cell alloreactivity in B6→BALB.B GVHD hosts with MyD88-KO BMT
To investigate the dynamics of MyD88-KO BM progenies in GVHD hosts (hereafter referred to as MyD88-KO GVHD hosts or recipients), it was essential to perform BLI analysis, a powerful tool to monitor longitudinal in vivo cell dynamics (2633). For BLI analysis, transgenic mice expressing luciferase under control of the actin promoter were backcrossed into MyD88-KO B6 mice (LucTg MyD88-KO) for use as BM donors (25). LucTg WT B6 mice were included as control BM donors. MHC/MiHA-fully mismatched GVHD models, for example, B6→B6D2F1, have shown drastic early mortality (MST=12.5–15.0 days) after MyD88-KO BMT, as described in our previous study (22), hampering stable longitudinal mechanistic studies. Therefore, we considered that slowly progressing GVHD models such as MiHA-mismatched models would be appropriate for consistent longitudinal BLI analysis; therefore, we used the B6→BALB.B model in which immune kinetics has been well characterized (20263435). To test whether GVHD aggravation in MyD880-KO BM recipients would be reproduced by use of LucTg BM, the LucTg BM alone or together with WT T cells were transplanted into BALB.B mice irradiated with a lethal dose (900 cGy) for an allo non-GVHD or GVHD setting, respectively. Irradiated albino B6 mice were included as recipients for a syngeneic non-GVHD setting (Fig. 1A). As expected, the GVHD hosts which received LucTg MyD88-KO BM and WT T cells showed disease aggravation, with shorter MST (=20.5 days) and higher disease scores, compared with the WT counterparts (MST=44.5 days; Fig. 1B). All the non-GVHD recipients, regardless of MyD88-KO or WT BMT, showed long-term survival without any symptom. These results confirmed that luciferase expression by donor BM cells did not influence the outcomes of BMT, assuring the reliability of BLI data to be generated. LucTg MyD88-KO and WT BMT are hereafter referred to as MyD88-KO and WT BMT.
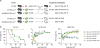 | Figure 1Aggravated GVHD in the recipients of MyD88-KO BM with allo WT T cells. (A) A schematic diagram of the experimental GVHD mouse model. WT (or KO) indicates MyD88 WT (or MyD88 KO) of B6 mice, T indicates WT type splenic T cells of B6 mice, BM indicates TCD BM; syn WT (or KO) BM+WT T (B6→B6); allo WT (or KO)+WT T (B6→BALB.B); allo WT (or KO) BM (BM only). (B) Survival, GVHD score, and weight loss in acute GVHD mice (n=10 per group). Data (B) represent 3 independent experiments.
|
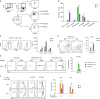
We then determined whether GVHD exacerbation in MyD88-KO BM recipients was correlated with T cell activation levels. In our previous study using the B6→B6D2F1 MHC/MiHA-fully mismatched GVHD model, higher proliferation and lower apoptosis of T cells in MyD88-KO GVHD hosts than those of WT counterparts were consistently detected; however, significant differences in T cell activation levels were rarely detected on day 9 post-transplantation (22). To assure the presence of a relationship between T cell activation levels and GVHD aggravation in MyD88-KO GVHD hosts, we analyzed T cell compartments in PBL and spleens of BALB.B GVHD hosts by flow cytometry at early time points, specifically at days 5 and 7 post-transplantation, when spleen cellularity is in expanding phase and near peak proliferation, respectively (202634). On day 7 post-transplantation, donor B6 (b2m+) T cell frequencies in PBLs and spleens were found to be significantly higher in MyD88-KO GVHD hosts than in the WT counterparts (Fig. 2A). But because of low cellularity in the spleens of MyD88-KO GVHD hosts, absolute T cell numbers were not significantly different between the two (Fig. 2B). Even so, we observed that splenic T cell frequencies for BrdU+ cells were significantly higher (46% of CD4+ T cells on day 5 and 41% of CD8+ T cells on day 7, on average) and the annexin V+ cell frequencies were similar or lower, although statistically insignificant, in MyD88-KO GVHD hosts, compared to those in the WT counterparts (averages 17% and 21% of BrdU+ cells in CD4+ and CD8+ T cells, respectively; Fig. 2C and D), consistent with the findings observed with the B6→B6D2F1 model (22). Additionally, we found that expression levels of effector molecules in T cells were significantly different between the MyD88-KO and WT GVHD hosts, such that frequencies of IFN-γ+ cells in the splenic CD4+ (34%) and CD8+ (54.3%) T cells, and of granzyme-B+ cells in the CD8+ T cells (27.1%) were significantly higher in the MyD88-KO GVHD hosts than in the WT counterparts (29%, 39%, and 13.9%, respectively) on day 7 post-transplantation (Fig. 2E and F). In both non-GVHD recipients of MyD88-KO and WT BM, levels of all indicators of T cell activation and effector function were negligible. Collectively, by use of the MiHA-mismatched B6→BALB.B GVHD model, we could detect that donor T cells in the spleens of MyD88-KO GVHD hosts were enhanced for effector functions in addition to proliferative potential, compared with WT GVHD hosts. This implies that disease aggravation in MyD88-KO GVHD hosts would be associated with enhancement of donor T cell alloreactivity.
 | Figure 2T cells originated from MyD88 KO BM GVHD hosts were less apoptotic, more proliferative, and more potent in effector functions. (A, B) The proportion and numbers of donor CD4+ and CD8+ T cells in PBL and spleen were determined on day 7 post-transplantation. (C) BrdU incorporation assays for proliferation of donor-derived T cells in spleen from the indicated GVHD groups on day 5 and 7 post-transplantation. (D) Annexin V/DAPI staining for detection of apoptosis of donor-derived T cell subsets in spleen from the indicated GVHD groups on day 7 post-transplantation. (E) Intracellular IFN-γ- and (F) GZMB staining in donor-derived T cells in spleen from the indicated GVHD groups on day 7 post-transplantation. Data are expressed as the % mean± standard deviation. Data (A-F) represent 3 independent experiments.
*p<0.05; **p<0.01; ***p<0.001 (WT vs. KO).
|
Distinct in vivo dynamics of MyD88-KO BM progenies in GVHD hosts
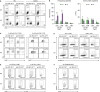
We then performed longitudinal BLI analysis on MyD88-KO or WT BM progenies in GVHD, or allo or syngeneic non-GVHD recipients, to compare the dynamics of the two different genotypes of BM progenies in various environments. Luminescence signals originated from MyD88-KO BM were detected (12.05±0.01–14.775±2.580×10⁵ p/s/cm2/sr) on day 1 post-transplantation, and increased up to day 5 post-transplantation similarly in all 3 different recipient conditions (146.515±5.170–306.340±48.197×10⁵ p/s/cm2/sr; Fig. 3A). Afterwards, however, MyD88-KO BM-derived signals decreased in GVHD hosts, eventually becoming undetectable at day 9 post-transplantation and beyond. The disappearance of signal in MyD88-KO GVHD hosts was further confirmed by individual inspection of the major internal organs (Fig. 3B). This pattern was significantly different from the patterns of the same MyD88-KO BM progenies in non-GVHD recipient groups, which showed steady and moderate signal increases (average 959.10±2.43 and 1,327.75±143.47×10⁵ p/s/cm2/sr in syngeneic and allo non-GVHD groups, respectively, on day 9 post-transplantation; Fig. 3A). By sharp contrast, intensities of WT BM-derived signals surged significantly in GVHD hosts after day 5, reaching up to 5-fold higher values (6,084.0±185.9×10⁵ p/s/cm2/sr on day 9 post-transplantation) compared to WT signal intensities in non-GVHD hosts, which showed a moderate increase (1,325.00±112.01×10⁵ p/s/cm2/sr on day 9 post-transplantation), as did those of MyD88-KO in non-GVHD recipients. Together, these results demonstrate that expansion of donor BM progenies occurred in 2 phases, up to and after day 5 post-transplantation, and cell dynamic patterns diverged in the second phase, depending on the genotypes of donor BM (MyD88-KO vs. WT) and the recipient conditions (presence vs. absence of donor T cell activation). The kinetic data indicate that after small scale expansion in the first phase, MyD88-KO BM progenies underwent cell death in GVHD hosts in the second phase, while the WT GVHD counterparts underwent vigorous cell division during the same period, and the WT and MyD88-KO progenies in non-GVHD hosts underwent mild expansion.
 | Figure 3In vivo dynamics of MyD88 KO BM and WT BM progenies in different conditions of recipients. (A) BLI analysis for in vivo dynamics of TCD-BM (non-T cell compartments) cell expansion after transplantation. The migration and expansion of TCD-BM cells were longitudinally monitored at 2 h, days 1, 3, 5, 7, 8 and 9 post-transplantation using an IVIS imaging system 100 (Xenogen, Alameda, CA, USA). (B) At days 5, 7, and 9 post-transplantation, individual target organs, Sp (spleen), Li (liver), Lu (lungs), Ki (kidney), and Int (intestines), were surgically removed from recipient mice and measured for donor-originated infiltrating TCD-BM cells. Representative imaging data are shown. Total body flux (photons/s) values were measured and plotted using Living Image Software (Xenogen) and statistical significance of total body flux at days 5, 7, and 9 was determined. Data (A, B) represent 3 independent experiments.
|
Enhanced apoptosis of CD11b+Gr-1+ cells in MyD88-KO GVHD hosts
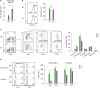
It has been shown that numbers of CD11b+Gr-1+ MDSCs derived from MyD88-KO BM were significantly lower in GVHD hosts in both B6→B6D2F1 and B6→BALB.B models (22), which signifies that expansion of MDSCs was impaired in the MyD88-KO GVHD hosts. Based upon the BLI data above and the significant shrink of the CD11b+ cell population in MyD88-KO GVHD hosts (Fig. 4A and B), we hypothesized that the phenomenon was a result of cell death of CD11b+Gr-1+MDSCs among the MyD88-KO BM progenies generated in GVHD hosts. To test this, we performed a series of flow cytometric analyses on donor (β2mb+) BM-derived CD11b+Gr-1+ cells, on days 5, 7, and 9 post-transplantation, matching the days of the BLI data. On day 5, β2mb+CD11b+Gr-1+ cells were detected in the splenocytes from MyD88-KO GVHD hosts, with the frequencies (7.9%) and numbers (2.10×10⁵) comparable not only to those from allogeneic (9.9% and 3.10×10⁵) and syngeneic (7.8% and 6.49×10⁵) non-GVHD hosts (Fig. 4A-C), but also to those of the WT GVHD (7.3% and 1.90×10⁵) and non GVHD counterparts (11.0%–11.5% and 3.60–4.83×10⁵). These results indicate that generation and expansion of CD11b+Gr-1+ cells in the first phase were intact in the MyD88-KO GVHD hosts. In the second phase, numbers of splenic CD11b+Gr-1+ cells in the MyD88-KO GVHD hosts were slightly increased, but did not show an absolute increasing trend (4.05×10⁵ and 4.50×10⁵ on days 7, and 9 post-transplantation, respectively). Instead, the numbers in the peripheral organs including the intestines and even the BM were decreasing over time (Fig. 4D and E). Gating on M (Ly6ChiLy6Glow) and PMN (Ly6ClowLy6Ghi) MDSC subsets clarified that these MDSC numbers were in declining trend even in the spleens (Fig. 4F and G), as well as in the peripheral organs (Supplementary Fig. 1A and B). In contrast, numbers of CD11b+Gr-1+ cells in the spleens of WT GVHD hosts showed a steep increase (63.7×10⁵ and 276.0×10⁵ on days 7, and 9 post-transplantation, respectively), and those of WT or MyD88-KO non-GVHD hosts showed mild increases (48×105 and 42×105, respectively, on day 9 post-transplantation). The increasing trend was also relevant when the M and PMN subsets and the peripheral organ-infiltrating cells were examined. Thus, the dynamics of CD11b+Gr-1+ cells in both MyD88-KO and WT BM cases were consistent with the BLI dynamics observed in corresponding recipients, implying that the BLI data reflected mostly the dynamics of de novo generated CD11b+Gr-1+ cells. Combined together, these results indicate that MyD88-KO CD11b+Gr-1+ cells, including both the M- and PMN-MDSC subsets, decreased over time, undergoing cell death, in the whole body of GVHD hosts in the second phase. Consistently, annexin V+ apoptotic cell frequencies were significantly higher in the splenic CD11b+Gr-1+ cells from MyD88-KO GVHD hosts than in the WT counterparts as determined by flow cytometric analyses on days 5 and 7 post-transplantation (Fig. 4H). Thus, MyD88-KO CD11b+Gr-1+ cells experienced apoptosis and cell death in GVHD hosts, but not in non-GVHD hosts, which supports our hypothesis and suggests that the lack of MDSCs in MyD88-KO GVHD hosts may be an outcome of complicated cellular processes, rather than a simple impairment in expansion.
 | Figure 4Flow cytometric analysis of CD11b+Gr-1+ cells in progenies in different conditions of BM recipients. (A) Proportion of donor CD11b+ and CD11b+Gr-1+ cells in GVHD and non-GVHD hosts after excluding T cell proportions in spleen on days 5, 7, and 9 post-transplantation. (B) The frequencies and absolute numbers of donor-originated total CD11b+ cell and (C) CD11b+Gr-1+ cells in spleen on days 5, 7, and 9 post-transplantation. (D) Proportion of donor CD11b+Gr-1+ cells after excluding T cell proportions (CD3-β2mb+) in BM on days 5, 7, and 9 post-transplantation, including intestine, on day 9 post-transplantation. (E) Frequencies and absolute numbers of donor-originated CD11b+Gr-1+ cells in BM on days 5, 7, and 9 post-transplantation and intestine on day 9 post-transplantation. (F) Representative frequencies of Ly6GhiLy6Clow or Ly6GlowLy6Chi subpopulations within the donor-originated (β2mb+) CD11b+ cells in spleen on days 5, 7, and 9 post-transplantation. (G) Frequencies and absolute numbers of Ly6GhiLy6Clow or Ly6GlowLy6Chi subpopulations within the donor-originated (β2mb+) CD11b+ cells post-transplantation. (H) Apoptosis of donor-derived CD11b+Gr-1+ cells in GVHD host was analyzed by staining with annexin V Ab on days 5 and 7 post-transplantation. The GMFI values were measured and plotted. Data (A-H) represent more than 3 independent experiments.
*p<0.05; **p<0.01; ***p<0.001 (WT vs. KO).
|
Apoptosis- and DC differentiation-prone gene expression by CD11b+Gr-1+ cells from MyD88-KO GVHD hosts
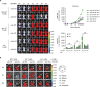
To understand the molecular characteristics underlying the unique in vivo dynamics of MyD88-KO CD11b+Gr-1+ cells in GVHD hosts, we compared the transcriptome of splenic Gr-1+ cells (which were all CD11b+, Fig. 5A) from MyD88-KO GVHD hosts with that of the WT counterparts on day 7 post-transplantation. The transcriptome of Gr-1+ cells from syngeneic non-GVHD recipients was also included as a non-GVHD control. Hierarchical clustering analysis identified the cluster in which gene expression patterns were similar in GVHD hosts, but not in non-GVHD hosts (Fig. 5B). In the cluster, inflammatory response was found to be the most significantly enriched biological category through GSEA analysis (Fig. 5C), which was expected as it indicates the presence of GVHD. The number of differentially expressed genes in comparison of MyD88-KO vs. the non-GVHD control was approximately >2-fold those of WT vs. non-GVHD control (Fig. 5D). A total of 1,514 genes were identified as MyD88 KO-specific genes in GVHD development, for which we conducted further bioinformatics analysis. To gain insight into the functional implication for the changes in gene expression profiles driven by MyD88-deficiency, categorization by the molecular and cellular functions was conducted and the significance for each category was examined by Fisher's exact test. Cell Death was identified as one of the top 5 significant processes (p=1.69E-15; Fig. 5E). Within the processes, it was notable that Apoptosis of leukocytes (p=5.04E-11) and Cytotoxicity (p=1.04E-05) were significantly modulated by MyD88-deficiency in GVHD development (Fig. 5F). These gene profiles were consistent with the results from the fate analyses described above.
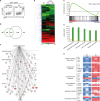 | Figure 5Differential gene expression profiles between splenic MyD88 KO and WT CD11b+Gr-1+ cells on day 7 post-transplantation in GVHD hosts. (A) Representative proportion of donor-originated CD11b+Gr-1+ cells in spleen on day 7 post-transplantation. Gr-1+ cells in GVHD hosts were all CD11b+ cells. (B) Heat map for relative gene expression in CD11b+Gr-1+ cells between WT and MyD88 KO GVHD hosts. (C) Enrichment of genes for inflammatory response by GSEA with selected gene lists. The FDR q<0.04 indicates specific enrichment of the gene set. Leading edge subset analysis indicates that genes are highly correlated with the inflammatory response. (D) Venn diagram of differentially expressed gene profiles between splenic CD11b+Gr-1+ cells from MyD88 and WT GVHD hosts by the indicated pair comparisons. Each number indicates the number of up- and downregulated unique genes, or shared genes. (E) The top 5 significant biological categories modulated by absence of MyD88 in CD11b+Gr-1+ cells in GVHD hosts. (F) Networks of genes in apoptosis of leukocyte and cytolysis related genes regulated by MyD88-deficiency in GVHD development. (G) Heat map for differential expression of Ag-presentation-related genes, cytokines, chemokines, metabolism, signaling, and transcription in splenic CD11b+Gr-1+ cells between WT and MyD88 KO GVHD hosts on day 7 post-transplantation.
|
Additionally, we focused on the Cellular Development category (p=2.91E-17), assuming that this category of genes would provide a clue for the apoptosis and death fate of the MyD88-KO CD11b+Gr-1+ cells in GVHD hosts. While checking the genes related to myeloid cell differentiation, we found that many of the genes involved in DC differentiation, maturation, and function were dramatically changed in their expression patterns (36). Among the genes known to be upregulated in DC differentiation and maturation, the following genes were found to be upregulated in MyD88-KO Gr-1+ cells (Fig. 5G): genes encoding proteins related to Ag processing and presentation (Mrc1, MHC I, MHC II, and CD86), cytokines and their receptors (IL-1, IL-10, IL-18, and tumor necrosis factor [TNF] receptor), lymphocyte-attracting chemokines and their receptors (chemokine ligand [CCL] 5, CCL7, CCL24, chemokine receptor [CCR] 3 and CCR7), enzymes involved in lipid metabolism (Cyp2b19 and Cyp2c70). Moreover, the transcriptional levels of signaling molecules in DCs, such as RAP1GAP, RAPGEF, TRAF3IP2, and STAT4, and transcriptional factors (interferon regulatory factor [IRF] 4 and peroxisome proliferator activated receptor gamma) were significantly modulated by MyD88-deficiency. Combined together, these data suggest that the MyD88-KO CD11b+Gr-1+ cells in GVHD hosts were more skewed toward DC differentiation than the WT counterparts.
Enhanced DC fractions in CD11b+Gr-1+ cells of MyD88-KO GVHD hosts
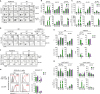
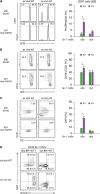
To verify the gene profiling data above, we compared cellular profiles of CD11b+Gr-1+ cells in the spleens of MyD88-KO and WT GVHD hosts on day 7 post-transplantation, using additional surface markers to identify DCs (CD11c+) and distinguish M- and PMN-MDSCs (CD124+Ly6ChiLy6Glow and CD244+Ly6ClowLy6Ghi, respectively) from monocytes (CD124−Ly6ChiLy6Glow) and neutrophils (CD244−Ly6ClowLy6Ghi) (16) in CD11b+Gr-1+ cells (Fig. 6A). Even with the fine demarcation, M- and PMN-MDSC populations were the major components of CD11b+Gr-1+ cells in WT GVHD hosts (25.00% and 63.20%, respectively), while the CD11c+ cells, neutrophils, and monocytes were the minor components (8.10%, 3.40%, and 0.96%, respectively; Fig. 6B). However, for CD11b+Gr-1+ cells in MyD88-KO GVHD hosts, CD11c+ cells were the most abundant cells, accounting for 44.94%, while the M- and PMN-MDSC fractions were reduced to 18.10% and 32.90%, respectively. Neutrophils and monocytes remained as minor populations (1.04% and 0.85%, respectively). CD11c+ cells in CD11b+Gr-1+ cells expressed MHC class II, CD80, and CD86, being identified as DCs, and expression levels of these molecules were significantly higher on the CD11c+ cells in MyD88-KO CD11b+Gr-1+ cells than on the WT counterparts (Fig. 6C). Importantly, the CD11c+ cells were the major cells comprising the annexin V+ apoptotic cells in CD11b+Gr-1+ cells from MyD88-KO GVHD hosts (Fig. 6D), indicating the presence of a positive relationship between cell death and DC differentiation of MyD88-KO CD11b+Gr-1+ cells in GVHD hosts.
 | Figure 6Increased proportion of DCs in MyD88-KO CD11b+Gr-1+ cells from GVHD hosts. (A, B) The composition of CD11b+Gr-1+ cells from spleen of allo GVHD hosts on day 7 post-transplantation. PMN-MDSCs (CD11c−CD11b+CD244+Ly6GhiLy6Cint) and M-MDSCs (CD11c−CD11b+CD124+Ly6GlowLy6Chi) including neutrophils (CD11c−CD11b+CD244−Ly6GhiLy6Cint) and monocytes (CD11c−CD11b+CD124−Ly6GlowLy6Chi). (C) Flow cytometric analysis of MHC class II, CD80, and CD86 on CD11c+CD11b+Gr-1+ cells isolated from spleen of WT and MyD88 KO BM GVHD hosts on day 7 post-transplantation. The Geom. MFI was measured and plotted. (D) Proportion of annexin V+ cells in CD11b+Gr-1+CD11c+ cells from spleen of allo GVHD hosts on day 7 post-transplantation. (E) Ag-presentation assay. Equal numbers of CFSE-labeled J15 CD8+ T cells (CD45.1+) were co-cultured with Gr-1+ cells (1×10⁵ cells) isolated from spleen in WT or MyD88 KO BM GVHD hosts on day 7 post-transplantation, in the presence of H60 peptide (1 µM) or VSV control peptide (1 µM) for 3 days. The proliferation of J15 CD8+ T cells (CD45.1+) elicited by H60 peptide was measured by CFSE dilution on day 3 by flow cytometry, and the proportion of proliferation is presented as mean±standard deviation. (F) Immunosuppression assay using Gr-1+ cells isolated from spleen in WT or MyD88-KO BM allo GVHD hosts on day 7 post-transplantation. CFSE-labeled CD45.1+ T cells (1×10⁵) were co-cultured with equal numbers of Gr-1+ cells. T cells only or mixed cells (1:1) were incubated in the absence or presence of anti-CD3 (2 µg/ml)/CD28 (1 µg/ml). The proliferation of CD45.1+ T cells was measured by CFSE dilution after 3 days by flow cytometry. The proportions of proliferated CD45.1+ CD4+ and CD45.1+ CD8+ T cells were indicated and plotted. Data (B-F) represent 3 independent experiments.
*p<0.05; **p<0.01; ***p<0.001 (WT vs. KO).
|
To test Ag presentation ability of the CD11c+ DCs in CD11b+Gr-1+ cells from MyD88-KO GVHD hosts, splenic Gr-1+ cells were loaded with H-2Kb-restricted CD8+ T cell epitope peptides for MiHA H60 (LTFNYRNL) or a VSV control Ag (RGYVYQG) before co-incubation with CFSE-labeled naïve CD8+ T cells expressing a transgenic TCR specific for H60, termed J15 (2737). Gr-1+ cells from the WT GVHD hosts were processed in parallel. When analyzed 3 days later, only the J15 T cells co-incubated with the H60 peptide-loaded Gr-1+ cells from MyD88-KO GVHD hosts showed CFSE-dilution (Fig. 6E), indicating that the CD11c+ DCs in MyD88-KO CD11b+Gr-1+ cells were functional, and able to activate and induce proliferation of T cells in Ag-specific manner. On the contrary, when the Gr-1+ cells from MyD88-KO GVHD hosts were subjected to immune suppression assay containing anti-CD3/CD28-stimulated activated polyclonal B6 CD4+ or CD8+ T cells, they were less suppressive than the WT counterparts (Fig. 6F). Together, these results demonstrate that functionally intact CD11c+DCs were present at significant frequencies in the CD11b+Gr-1+ cells generated from MyD88-KO BM in GVHD hosts, while authentic MDSCs with immune suppressive function dominated the WT counterparts. This provides an insight into how T cell alloreactivity was enhanced in MyD88-KO GVHD hosts.
Preferential DC differentiation of MyD88-KO BM cells under in vitro MDSC producing conditions
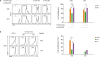
We then examined whether DC differentiation and the associated apoptotic property of MyD88-KO CD11b+Gr-1+ cells in GVHD hosts could be reproduced in vitro. BM cells were isolated from naïve MyD88-KO, and then cultured in media containing GM-CSF and LPS, which induced high inflammatory conditions to generate MDSCs in vitro (38). After 4 days, MyD88-KO BM-derived in vitro cells were harvested with higher numbers, but their annexin V+ cell levels were similar, compared to those of control in vitro cells derived from WT BM (Fig. 7A and B). Therefore, the apoptosis-prone characteristics of MyD88-KO CD11b+Gr-1+ cells were not reproduced in vitro. In the MyD88-KO and WT BM-derived in vitro cells, CD11b+ cells were present at similar frequencies. However, the CD11b+ cell profiles were different between the two, such that CD11c+ DC fractions were higher and CD244+Ly6ClowLy6Ghi PMN-MDSC fractions were lower in the in vitro MyD88-KO CD11b+ cells (12.20% and 26.50%, respectively) than in the WT counterparts (5.3% and 40.0%, respectively; Fig. 7C). In these in vitro cell cases, fractional representations of the CD124+Ly6ChiLy6Glow M-MDSC subset were not different between the MyD88-KO and WT CD11b+ cells. Despite this, arginase-1 and iNOS, which are MDSC functional mediators (14), were also expressed at lower levels in the M-MDSC subset, not only in the PMN-MDSC subset of MyD88-KO CD11b+, compared to the levels expressed by the WT counterparts (Fig. 7D). Consistently, the MyD88-KO in vitro cells were less active in suppression of activated T cells, but more active in inducing proliferation of the H60-specific J15 CD8+ T cells when loaded with H60 peptide (Fig. 8A and B). Thus, CD11c+ DCs were preferentially generated from MyD88-KO BM cells even in high inflammatory MDSC-producing in vitro conditions.
 | Figure 7Flow cytometric analysis of BM progenies generated by in vitro culture using MyD88 KO BM and WT BM donor mice. (A) Number of total cells after 4 days cultivation of TCD-BM of MyD88 KO and WT donor mice with GM-CSF plus LPS. (B) Proportion of annexin V+ cells in in vitro cultured TCD-BM of MyD88 KO and WT donor mice for 4 days with GM-CSF (40 ng/ml) plus LPS (1 µg/ml), (C) the proportion of CD11b+Gr-1+ MDSCs from TCD-BM of MyD88 KO and WT donor mice, and number of total cells after 4 days cultivation with GM-CSF plus LPS. PMN-MDSCs (CD11c−CD11b+Ly6GhiLy6ClowCD244+), and M-MDSCs (CD11c−CD11b+Ly6GlowLy6ChiCD124+), DC (CD11c+), neutrophils (CD11c−CD11b+Ly6GhiLy6ClowCD244−), and monocytes (CD11c−CD11b+Ly6GlowLy6ChiCD124−). (D) Flow cytometry analysis showing decreased expression of Arg-1 and iNOS on day 4 within PMN-MDSCs and M-MDSCs gated subpopulations in in vitro cultured TCD-BM cells from WT and MyD88-KO donor mice. The Geom. MFI was measured and plotted. Data (A-D) represent 3 independent experiments.
*p<0.05 (WT vs. KO).
|
 | Figure 8Functional tests of CD11b+Gr-1+ cells generated by in vitro culture using MyD88 KO BM and WT BM donor mice. (A) In vitro cultured-TCD-BM cells were co-cultured at a 1:1 ratio with CFSE-labeled T cells (1×10⁵) and stimulated with anti-CD3/CD28 antibodies for 3 days. The proliferation of J15 CD8+ T cells (CD45.1+) was determined by flow cytometry. (B) Ag-presentation assay was performed as described in Fig. 6E. CFSE-labeled J15 CD8+ T cells (CD45.1+) were co-cultured with WT or MyD88 KO TCD-BM (1×10⁵ cells) cultured in vitro in the presence of GM-CSF plus LPS for 4 days. After co-cultivation in the presence of H60 peptide (1 µM) or VSV control peptide (1 µM) for 3 days, the proliferation of J15 CD8+ T cells (CD45.1+) was determined by flow cytometry. Data (A and B) represent 3 independent experiments.
|
Cross-presentation of alloantigens and death of antigen presenting cells (APCs) in Gr-1+ cells of MyD88-KO GVHD hosts
Donor-derived APCs participate in activation of donor T cells by cross-presentation of the recipient's alloantigens, contributing to generation of GVHD (39). Therefore, we asked whether the DCs frequent in CD11b+Gr-1+ cells in MyD88-KO GVHD hosts would play roles as APCs, cross-presenting BALB.B alloantigens to B6 donor T cells in vivo. To answer this, we isolated Gr-1+ cells from MyD88-KO or WT GVHD hosts and co-incubated the ex vivo Gr-1+ cells directly, without the additional peptide-loading process, with CFSE-labeled naïve B6 CD8+ T cells. Ex vivo Gr-1+ cells from MyD88-KO or WT syngeneic recipients were included in parallel as controls. When CFSE-dilution by T cells was examined 3 days later, only the T cells co-incubated with the ex vivo Gr-1+ cells from MyD88-KO GVHD hosts showed CFSE dilution (11.5%), indicating that up to 11% of B6 T cells showed alloresponse to the ex vivo Gr-1+ cells from MyD88-KO GVHD hosts, but not to ex vivo cells from WT GVHD hosts, or from WT or MyD88-KO non-GVHD hosts (Fig. 9A). Moreover, CD44+ cell frequencies were significantly higher (53.5%) in the T cells co-incubated with the ex vivo Gr-1+ cells from the MyD88-KO GVHD host, compared to the frequencies (<40%) in T cells from the other experimental groups (Fig. 9B). Importantly, when DAPI-staining was included to identify dead cells in Gr-1+ cells after the co-incubation, the ex vivo Gr-1+ cells from MyD88-KO GVHD hosts were stained at significantly higher frequencies (24.3%) than those (<8.2%) from the other experimental groups (Fig. 9C). This implied that the CD11c+ DCs in ex vivo Gr-1+ cells from MyD88-KO GVHD hosts acted as APCs to activate B6 T cells during the co-incubation and were subsequently killed by the activated T cells. CD11b+Gr-1+CD11c+ cells in the spleens of MyD88-KO GVHD hosts were more prone to cell apoptosis and death, with higher fractions for annexin V+ and DAPI+ cells, compared with the WT counterparts (Fig. 9D). However, cells in non-GVHD recipients of WT or MyD88-KO BM were significantly low in apoptotic and dead cell fractions. These results illustrate that cross-presentation of BALB.B alloantigens by the CD11b+Gr-1+CD11c+ cells and then death of these APCs occurred in MyD88-KO GVHD hosts in vivo. This explains why the MyD88-KO BM progenies showed death fate only in GVHD hosts where activation of T cells occurred.
 | Figure 9MyD88 KO BM-derived DCs isolated from GVHD hosts are able to cross-present Allo-Ag. (A) Ag-presentation assay was performed using WT polyclonal CD8+ T cells. CFSE-labeled WT B6 CD8+ T cells (CD45.1+) were co-cultured with Gr-1+ cells (1×10⁵ cells) isolated from spleen of WT and MyD88 KO allogenic GVHD hosts including syngeneic non-GVHD control mice. After co-cultivation for 3 days, the proliferation of polyclonal WT CD8+ T cells (CD45.1+) was plotted. (B) The CD44 expression on CD8+ T cells was measured by flow cytometry. (C) The proportion of DAPI+ cells among non-T cell compartments (Gr-1+ cells) was plotted. (D) Apoptosis of CD11b+CD11c+ cells from WT and MyD88-KO BM GVHD (allo), and non-GVHD hosts (syn) was analyzed by following annexin V staining on day 7 post-transplantation. Data (A-D) represent 2 independent experiments.
*p<0.05 (WT vs. KO).
|
DISCUSSION
As an innate defense system, TLRs trigger a wide range of inflammatory responses (40). Most TLRs, with the exception of TLR3, are known to recruit MyD88 as a signaling adaptor (41). We have previously implicated the TLR/MyD88 signaling-axis in GVHD in the alleviation of disease severity, and suggested the protective mechanism acted through induction of CD11b+Gr-1+ MDSC immune suppressive cell expansion. This study demonstrates that the of lack of MDSC populations and disease aggravation in MyD88-KO GVHD hosts can be ascribed to the preference of MyD88-KO CD11b+Gr-1+ cells for DC differentiation, instead of cell expansion as MDSCs, under high inflammatory conditions. Our findings will provide insight into the role of MyD88 signaling in myelopoiesis of donor BM in GVHD hosts.
Using GVHD models in which various kinds of TLR ligands are released, our longitudinal dynamic analyses revealed that donor BM cells underwent proliferation and myeloid lineage differentiation immediately when placed in high inflammatory environments, and CD11b+Gr-1+ cells were the main intermediate populations with high proliferative potentials, consistent with previous reports on the role of TLR/MyD88-signaling in proliferation of hematopoietic cell progenitors (42). In addition to this conventional knowledge, the dynamics study elucidated several additional findings: 1) donor BM-derived CD11b+Gr-1+ cell expansion occurred in 2 phases in the recipients, and 2) TLR/MyD88-signaling was important in the second phase expansion (after day 5 post-transplantation), which was evidenced by the 2 opposite behaviors of WT vs. MyD88-KO CD11b+Gr-1+ cells (explosive expansion vs. cell death, respectively) in the second phase under GVHD conditions. Moreover, 3) levels of CD11b+Gr-1+ cells in the second phase were positively correlated with the inflammation levels in vivo, such that WT CD11b+Gr-1+ cells showed higher levels of expansion under GVHD conditions than in non-GVHD conditions. Importantly, 4) MyD88-signal appeared to be dispensable for CD11b+Gr-1+ cell expansion in mild inflammatory environments, as the MyD88-KO CD11b+Gr-1+ cells were able to manage the moderate levels of expansion in non-GVHD hosts. A plausible explanation for this is that other adaptor molecules could compensate for the MyD88-deficiency in low grade expansion under mild inflammatory conditions or in the absence of T cell activation. This suggests that MyD88-signaling is dominant for driving the massive expansion of CD11b+Gr-1+ cells in a high inflammatory environment or in the presence of T cell effector functions. However, since different ligands engage different TLRs using different adaptor-dependent signals (43), it is also possible that T cell immunity-associated tissue damage might release TLR ligands favoring MyD88 as the adaptor, different from the ligands released by tissue damage through irradiation-associated free-radicals (44) and microbial exposure (45). No matter which cue induces the MyD88-dependent CD11b+Gr-1+ cell expansion in the second phase in GVHD hosts, the fact that the presence or absence of MyD88-signaling affects CD11b+Gr-1+ cell expansion only in the second phase and only under high inflammatory GVHD conditions is an interesting phenomenon that should be studied further, to distinguish implications of MyD88 signaling and other adaptor-associated signaling in myelopoiesis under different inflammatory conditions.
MDSCs are precursors with the capacity to differentiate into different myeloid lineage cells, DCs, monocytes, macrophages, and granulocytes (15). Importantly, this study uncovered that MyD88-KO CD11b+Gr-1+ cells differentiate preferentially into DCs under high inflammatory conditions, and the DCs have the capacity to cross-present the recipient's alloantigens in GVHD hosts. It has been reported that signaling through TRIF-activated maturation of myeloid DCs (9). Thus, we suggest that dominance of TRIF-mediated signaling in the absence of MyD88 signal-driven expansion of CD11b+Gr-1+ cells may be a molecular mechanism promoting the DC differentiation in MyD88-KO GVHD hosts.
Conventional dendritic cells (cDCs) are typed into cDC1 and cDC2 according to expression of CD8 and CD11b, respectively, and are dependent on transcription factors IRF8 and IRF4, respectively (4647). Based on the upregulation of IRF4 and surface expression of CD11b, DCs preferentially generated in the CD11b+Gr-1+ cells of MyD88-KO GVHD hosts could be typed as cDC2. However, non-conventional DCs, such as monocyte-derived inflammatory DCs, and TNF-α- and iNOS-producing DCs (TipDCs) also express CD11b and are known to be generated in the presence of inflammatory and commensal bacteria stimuli (48). IRF4-dependency is known to generate monocyte-derived inflammatory DCs (4649), while TipDCs are known to be MyD88-dependent (50). Thus, CD11c+ DCs generated in MyD88-KO CD11b+Gr-1+ cells could also be typed as monocyte-derived inflammatory DCs. IRF8 is also known to be an MDSC-associated transcription factor (5152). According to the transcriptome data, IRF4 expression was upregulated, while IRF8 expression was downregulated, in Gr-1+ cells from MyD88-KO GVHD hosts, which implies the presence of cellular pathways directly linking MDSC and DC generation. More detailed studies using techniques such as single cell analysis are necessary for the understanding the myelopoiesis connecting MDSCs and DCs, and will help specifically type the DCs detected in MyD88-KO CD11b+Gr-1+ cells in GVHD hosts. Regardless of the pathway, we have identified preferential DC differentiation as a reason for the vulnerability of MyD88-KO CD11b+Gr-1+ cells to cell death and lack of CD11b+Gr-1+ MDSCs in GVHD hosts.
In summary, we have demonstrated that preferential DC differentiation of MyD88-KO CD11b+Gr-1+ cells, rather than explosive cell division as MDSCs, in the second phase in GVHD hosts is the cellular mechanism underlying the aggravation of GVHD in MyD88-KO BM recipients. Based on our results, we suggest that more abundant generation of MDSCs relative to DCs could be a primary mechanism for protecting hosts from severe GVHD by use of MyD88 signaling in donor BM. Our study provides findings important for understanding the MDSC biology and implication of MyD88 in myelopoiesis in the context of GVHD.
 XML Download