

 PDF
PDF ePub
ePub Citation
 Print
Print


INTRODUCTION
Osseointegrated implants for the replacement of missing teeth have recently become a routine treatment option [12]. The most important predictor of the success of an osseointegrated dental implant is the achievement and maintenance of implant stability [3]. Osseointegration refers to the establishment of a constitutional and mechanical network between the living bone tissue and the surface of the implant [3].
Clinical and basic researchers have reported that dental implant stability is important for treatment success at the time of surgery [45]. Primary stability (PS) at the time of surgery is a merely mechanical phenomenon depending on local bone quality and quantity [678], surgical preparation technique [9], and implant design [1011], and is one of the most important factors in the osseointegration process [36]. Secondary stability (SS) refers to the increase in stability due to bone formation and remodeling of the surrounding bone [12].
A number of traditional methods, including histological and histomorphometric observations, removal torque analysis [6], percussion tests, pull- and push- through tests [13], and the periotest method [8], are used to evaluate the initial bone quality and degree of osseointegration. However, these methods are invasive [6813], and often destructive. Resonance frequency analysis (RFA) is a noninvasive method that became available in 1996, and it is widely used to quantify PS and SS, as it can be used repeatedly both during and after an operation [4]. RFA is often performed using the Osstell Mentor device (Osstell™, Integration Diagnostics, Gothenburg, Sweden), which provides results in the form of the implant stability quotient (ISQ), which ranges from 1 (lowest stability) to 100 (highest stability). As RFA is noninvasive and nondestructive, it can be performed during osseointegration, and has been used in attempts to measure differences in osseointegration patterns between different approaches in implant surgery [141516]. An increase in implant stability has been measured in the clinic through RFA, and attributed to corticalization of the surrounding bone [1718]. Recent publications regarding implant stability measurements can be found, describing several in vitro and clinical investigations [19]. However, the extent to which RFA provides reliable predictions of the future osseointegration of dental implants is unclear, and further investigation is required.
Clinicians generally detect low bone density or limited bone resistance by a tactile assessment while drilling. If the bone density is low, it is frequently difficult to achieve ideal PS, and higher implant failure rates result. Accordingly, evaluating the host bone for implant insertion before surgery is valuable for increasing the predictability of treatment outcomes.
Computed tomography (CT) is, at present, the only diagnostic imaging tool that can be used in the clinic to determine the density and structure of the bones around the jaw [20]. It is an excellent modality for assessing the distribution of cortical and cancellous bone [21].
Previous studies have examined the impact of bone structure on implant stability in human subjects [171822] and a correlation between the ISQ and the thickness of cortical bone at the time of surgery has been reported. However, no data exist regarding SS after osseointegration.
The objective of this clinical retrospective study was to analyze factors contributing to implant PS at the time of surgery and SS at follow-up by RFA, and to investigate the influence of cortical bone thickness on stability. The aim of the study was to evaluate whether the ISQ of dental implants would be affected by cortical bone thickness during the osseointegration process. It was hypothesized that a correlation would exist between bone thickness and implant stability, including both PS and SS.
MATERIALS AND METHODS
Patient recruitment and selection criteria
Patients who had consented to implant treatment, attended the Tohoku University Hospital Dental Implant Center, and were scheduled for implant placement surgery between April 2013 and May 2015 were included in this study. There were 210 participants (79 men, 131 women), with an age range of 19 to 89 years, and a mean age of 55.8±13.3 years. This study was approved by the ethical committee at Tohoku University Graduate School of Dentistry, Sendai, Japan (permission number 26–33), and all patients provided written informed consent when they had finished implant treatment.
Prior to implant treatment, all patients were screened based on an interview sheet and diagnosis chart by a clinically experienced investigator. They filled in a questionnaire about factors, such as severe systemic diseases, habits (e.g., smoking), and presence or absence of parafunction, to document the patient's general and dental health conditions. Additionally, they were then examined clinically and radiologically to assess local bone and soft tissue conditions (e.g., the size of the alveolar ridge or inflammatory signs). Smokers who quit when starting implant treatment were included without distinction. Patients with other medical risk factors (e.g., controlled diabetes, malignant pathology other than in the cervicofacial area, and heart disease) were not excluded from treatment.
Five implant systems were placed using standard surgical protocols: 1) Osseospeed TX, Astra Tech, Mölndal, Sweden; 2) Strauman SLA soft tissue level implants Standard Plus; 3) Straumann SLA bone level implants, Basel, Switzerland; 4) NobelSpeedy Groovy, Nobel Biocare, Kloten, Sweden; and 5) GC SETiO, GC, Tokyo, Japan. The implant length ranged from 6 to 13 mm, and the diameters ranged from 3.0 to 5.0 mm.
The cases analyzed in this study included immediate-placement implants and bone-grafted implants, with the following techniques: simultaneous and staged guided bone regeneration (GBR), block bone graft, ridge expansion, socket lift, simultaneous and staged sinus augmentation, reconstructive bone graft with titanium mesh, and socket/ridge preservation techniques with bone replacement grafts using autografts (e.g. cortical bone and iliac particulate cancellous bone and marrow) and alloplasts (e.g. β-TCP and hydroxyapatite).
Preoperative evaluation: model scanning and computed tomography
Before the radiographic examinations, a model of the patient was made using an accurate alginate impression material (Aroma Fine Plus, GC, Tokyo, Japan), and a diagnostic wax-up of the prosthetic teeth was completed. computed tomography (CT) scans were taken for surgical planning, using cone-beam CT (3D Accuitomo, Morita Co., Tokyo, Japan) and multidetector CT (Aquilion ONE, Toshiba, Japan).
Preoperative planning
Digital Imaging and Communications in Medicine images of every scan (the patient's CT image and images of the model and wax-up of the prosthetic teeth) were imported into a software program (Simplant, DENTSPLY Implants NV, Mölndal, Sweden) to perform the preoperative planning. The implants were virtually placed in the optimal position, taking account of bone anatomy and the design of the prosthesis. It was determined whether the treatment required bone augmentation before placement of the dental implants.
Surgical procedures
In all patients, the administration of three 100-mg doses of antibiotic (cefdinir) was started 24 hours before surgery. The incision was performed with a minimally invasive flap elevation. All implants were placed using a surgical guide according to the manufacturer's instructions. During implant placement, the examiner made RFA measurements. The clinician chose to perform a 1-stage or 2-stage surgical procedure based on a tactile assessment of bone density or limited bone resistance while drilling. In the 1-stage group, healing abutments were placed, while in the 2-stage group, cover screws were used. The surgeon obtained tension-free closure around the healing abutment using nonresorbable nylon sutures (Softretch, GC, Tokyo, Japan). Postoperative prescriptions included 0.2% benzethonium chloride mouthwash (3 times a day for 14 days), loxoprofen sodium hydrate (60 mg, every 6 to 8 hours as needed for pain), and cefdinir (100 mg, 3 times a day for 1 week). The subjects presented for follow-up at 1 or 2 weeks for suture removal, followed by visits to assess osteointegration (before provisional restoration or at the time of the second operation) for the second RFA measurement. The mean interval of the visits for assessing osseointegration was 145.2±63.9 days (range, 47–432 days).
RFA measurements
The stability of each implant was measured using RFA (Osstell™, Integration Diagnostics, Gothenburg, Sweden). The ISQ value was measured in 3 directions at the time of surgery (PS) and after osseointegration (SS). The lowest of the 3 values was recorded. All the implants were inserted mono-cortically, and the ISQ values of clinically mobile implants (due to issues such as surgical error or a poor degree of bone density) were not determined, as the manufacturer warned of increased measurement variability in such cases. Such implants were thus excluded from the study. Additionally, cases of early failure or implant replacement were excluded. Therefore, the exclusion criteria were clinical mobility of the implants, early failure, implant replacement, and the absence of recorded data at each measurement point. In contrast, for implants that satisfied the inclusion criteria, PS and SS values were obtained.
Evaluation of cortical bone thickness
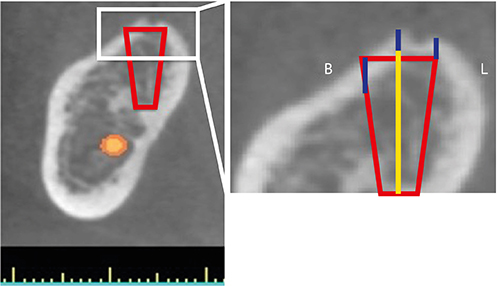
To evaluate cortical bone thickness, the thickness of the cortical bone at the site of implant placement on each cross-sectional CT image was measured digitally. The virtually-placed implant was planned in the Simplant® simulation (Figure 1). The outer cortical bone thickness at the image of the virtually-placed implant was measured digitally at 3 points (the middle of the implant, and 2 of the buccal, lingual, or palatal sides; side measurements were taken at 2 mm away from the center), and the mean value, in millimeters, was used as the cortical thickness of the bone. Cases without bone augmentation in which the cortical bone image was unclear were excluded from this assessment. In addition, cases of immediate placement and bone augmentation were also excluded, because the images of the cortical bone were also unclear in these cases.
Figure 1
Thickness of the cortical bone at the site of implant placement (red line) on each cross-sectional computed tomography image. The outer cortical bone surface surrounding the implant model was measured digitally at 3 points (blue lines): the center, and at 2 of the buccal, lingual, or palatal sides at 2 mm away from the center of the implant (yellow line).
B: buccal, L: lingual.

Statistical analysis
The data were analyzed with Statcel3 (OMS, Saitama, Japan). Differences in the means of continuous measurements were tested using the Student's t-test and the Tukey-Kramer test, and within-group comparisons of parameters were made using the paired-sample t-test for normally distributed data. The correlation between cortical bone thickness and stability was measured by the Spearman rank correlation coefficient. P values less than 0.05 were considered to indicate statistical significance.
RESULTS
In this study, 458 implants were placed from April 2013 to May 2015, of which 227 were excluded for not matching the inclusion criteria of the study, or because data were not recorded at each measurement point.
In the remaining cases, 229︎ implants were placed in 113︎ patients (66 females and 47 males; mean age, 50.1±17.1 years). The largest number of implants was placed in the posterior mandible (n=112) whereas only 6 implants were placed in the anterior mandibular region. Implants in the maxilla were placed in both the anterior maxilla (n=38) and the posterior maxilla (n=73).
The cases analyzed included immediate-placement implants (n=2) and bone-grafted implants (n=83) of the following types: simultaneous (n=34) and staged (n=2) GBR, block bone graft (n=18), ridge expansion (n=1), socket lift (n=8), simultaneous (n=2) and staged (n=11) sinus augmentation, reconstructive bone graft with titanium mesh (n=6), and socket/ridge preservation techniques (n=1).
ISQ measurements
The mean ISQ value (n=229) was 69.34±9.43 for PS and 75.99±6.23 for SS (Table 1, group A). A statistically significant difference was found in the ISQ value between PS and SS for all implants (paired-sample t-test; P<0.01).
Table 1
Descriptive and comparative mean ISQ values for implant site and surgical procedures
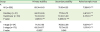
ISQ values are presented as mean±standard deviation.
Total sample size: n=229. A: Mean ISQ values for all cases; B: Relationship between implant site and ISQ mean values; C: Relationship between surgical procedures and ISQ mean values.
ISQ, implant stability quotient.
a)Statistically significant difference between primary stability and secondary stability (P<0.01) by the paired-sample t-test; b)Statistically significant difference between implant sites (P<0.01) by the Student's t-test; c)Statistically significant difference between surgical procedures (P<0.05) by the Student's t-test.
The mean ISQ values for each implant position site are shown in Table 1, group B. Mandibular implants had significantly higher mean ISQ values (PS: 72.23±8.59, SS: 79.00±5.09; n=117) than maxillary implants (PS: 66.27±9.36, SS: 72.78±5.72; n=111) for both PS and SS (Student's t-test; P<0.01). The differences between PS and SS within these 2 groups were statistically significant (paired-sample t-test; P<0.01).
The mean ISQ values by surgical procedure are shown in Table 1, group C. The 1-stage group had significantly higher mean ISQ values (PS: 71.91±7.82; n=54) than the 2-stage group (PS: 68.55±9.77; n=175) for PS (Student's t-test; P<0.01). In contrast, for SS, there was no significant difference in the mean ISQ value between the 1-stage group (SS: 76.85±5.06; n=54) and the 2-stage group (SS: 75.73±6.53; n=175). The differences between PS and SS within the 2 groups were statistically significant (paired-sample t-test; P<0.01).
The relationship between bone graft type and mean ISQ values is shown in Table 2. The cases were divided into non-augmentation, simultaneous augmentation, and staged augmentation groups for analysis. The mean ISQ values in the non-augmentation group (PS: 71.99±8.32, SS: 77.55±5.21; n=143) were significantly higher than those in the staged augmentation group (PS: 63.85±9.21, SS: 71.73±6.80; n=41) for both PS and SS (Tukey-Kramer test; P<0.01). Between the non-augmentation group and the simultaneous augmentation group, there were significant differences for both PS (Tukey-Kramer test; P<0.01) and SS (Tukey-Kramer test; P<0.05). Furthermore, the simultaneous augmentation group showed a significant difference from the staged augmentation group for SS (Tukey-Kramer test; P<0.05). The differences between PS and SS within the 3 groups were statistically significant (paired-sample t-test; P<0.01).
Table 2
Relationship between bone graft and mean ISQ values
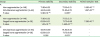
Total sample size: n=229. A: Comparison of non-augmentation with simultaneous augmentation; B: Comparison of non-augmentation with staged bone augmentation; C: Comparison of staged bone augmentation with staged bone augmentation.
ISQ: implant stability quotient.
a)Statistically significant difference between primary stability and secondary stability (P<0.01) by the paired-sample t-test; b)Statistically significant difference between the 3 groups (P<0.01) by the Tukey-Kramer test; c)Statistically significant difference between the 3 groups (P<0.05) by the Tukey-Kramer test.
Cortical bone thickness
The mean jawbone thickness was 1.574±0.61 mm (n=141). The mean mandible thickness was 1.740±0.64 mm (n=44), and the mean maxilla thickness was 1.207±0.34 mm (n=97). The cortical bone surrounding the implants in the mandible was significantly thicker than in the maxilla (P<0.01). However, there was no significant difference in cortical bone thickness between the 1-stage (1.640±0.58 mm; n=51) and 2-stage (1.536±0.63 mm; n=90) groups (Table 3).
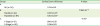
Table 3
Mean cortical bone thickness difference between implant sites and surgical procedures
| Group | Cortical bone thickness | P value | |
|---|---|---|---|
| A | |||
| All (n=141) | 1.574±0.61 | ||
| B | 7.280×10⁻⁷a) | ||
| Maxilla (n=44) | 1.207±0.34a) | ||
| Mandible (n=97) | 1.740±0.64a) | ||
| C | 0.457 | ||
| 1-Stage (n=51) | 1.640±0.58 | ||
| 2-Stage (n=90) | 1.536±0.63 | ||
Values are presented as mean±standard deviation (mm).
Total sample size: n=141. A: Cortical bone thickness in all cases; B: Relationship of cortical bone thickness with implant site; C: Relationship of cortical bone thickness with surgical procedure.
a)Statistically significant difference between implant sites (P<0.01) by the Student's t-test.
Correlations between cortical bone thickness and implant stability
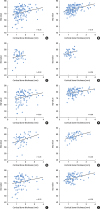
Figure 2 presents correlations between cortical bone thickness and implant stability. In the entire sample, a weak positive correlation was observed for both PS and SS (PS: r=0.25, P<0.01, SS: r=0.41, P<0.01). Comparing different implant sites, a weak positive correlation was observed in mandibular implants for SS (PS; r=0.20, P>0.05, SS; r=0.29, P<0.05). However, there was no correlation between implant stability and cortical bone thickness for implants in the maxilla (PS; r=0.03, P>0.05, SS; r=0.26, P>0.05). In the comparison of surgical procedures, a positive correlation was observed for SS in 1-stage procedures, and a weak positive correlation was observed in PS for 1-stage procedures and for both PS and SS in 2-stage procedures (1-stage: PS; r=0.31, P<0.05, SS: r=0.50, P<0.01, 2-stage: PS; r=0.23, P<0.05, SS; r=0.39, P<0.01).
Figure 2
Correlations between cortical bone thickness and implant stability quotient values. All (n=141): (A) All primary stability (P=3.590×10⁻⁴). (B) All secondary stability (P=1.339×10⁻⁶). Maxilla (n=44): (C) Primary stability at the maxilla (P=0.848), (D) Secondary stability at the maxilla (P=0.088). Mandible (n=97): (E) Primary stability at the mandible (P=0.050). (F) Secondary stability at the mandible (P=4.844×10⁻³). 1-Stage (n=51): (G) Primary stability for 1-stage procedures (P=0.027). (H) Secondary stability for 1-stage procedures (P=3.982×10⁻⁴). Two-stage (n=90): (I) Primary stability for 2-stage procedures (P=0.027). (J) Secondary stability for 2-stage procedures (P=2.646×10⁻⁴).
ISQ, implant stability quotient.
DISCUSSION
The present retrospective study demonstrates that dental implant stability, including both PS and SS, was weakly influenced by cortical bone thickness. Additionally, the results indicated that implant stability can be affected by a number of factors.
The need for a clinical diagnostic tool with high sensitivity for detecting early changes in osseointegration and evaluating the stability of dental implants is increasing with the more widespread use of immediate and early loading [141516]. Instruments that measure the resonant frequency of a small transducer on an implant are easy to use and promising for several applications, including measurements of different stages of the wound at the implant–bone interface [419].
The present study found higher ISQ values at both PS and SS in the mandible than in the maxilla. This is in agreement with the studies of Balleri et al. [23] and Ersanli et al. [24], in which implants placed in the mandible had higher ISQ values after osseointegration than those in the maxilla. This is also similar to the findings of Ostman et al. [25] and Bischof et al. [26], who reported that the highest ISQ values at insertion were obtained in the posterior mandible, although they detected no differences between the maxillary regions and the anterior mandible.
The present study identified a significant difference in mean ISQ values between 1-stage and 2-stage procedures at PS. In contrast, Tallarico et al. [27] reported no significant difference in ISQ values between 1- and 2-stage Nobel Biocare TiUnite implants in premolar or molar areas at any post-implantation time point. This difference may be due to the fact that the present study included cases of bone augmentation, while Tallarico et al. [27] did not.
The non-augmentation group had higher mean ISQ values at PS and SS than the simultaneous and staged augmentation groups. Furthermore, the mean ISQ value in the simultaneous augmentation group was significantly different from that of the staged augmentation groups for PS. In contrast, Al-Khaldi et al. [28] observed no significant difference in mean ISQ values between dental implants placed in grafted versus non-grafted anterior maxillary areas at implant placement or at abutment connection. In addition, almost all other reports that subdivided bone augmentation cases showed no significant difference at implant placement or after osseointegration [29303132]. Nevertheless, Rasmusson et al. [29] reported that the ISQ values at implant placement were lower for implants installed in interpositional block bone with LeFort I osteotomy than in other bone graft groups. Furthermore, the non-grafted control group also showed higher values than the grafted groups. These differences between previous studies and the present study might have occurred because the present study did not analyze cases with bone augmentation as a separate group.
A significant increase in ISQ values was observed from PS to SS, independent of implant position, surgical procedure, and augmentation, whereas Turkyilmaz et al. [32] did not find a significant change in the ISQ over time. On the other hand, Karl et al. [33] also reported changes in the ISQ during osseointegration.
The present study also found that cortical bone around the implant position site was significantly thicker in the mandible than in the maxilla, and showed a weak correlation between stability and cortical thickness when considering all the data, in broad agreement with the conclusions of several clinical studies on the importance of cortical thickness as a determining factor in the PS of implants [1718].
However, no correlation between cortical bone thickness in the maxilla and implant stability was found. The reason may be that cortical bone surrounding the implants in the maxilla was significantly thinner than in the mandible, and that maxillary alveolar bone has lower bone density than mandibular alveolar bone in general, which causes decreased implant stability [6]. Previous reports of in vivo experiments regarding bone density indicated that implant stability at the time of surgery was not affected by the quantity of cancellous bone [634]. Therefore, the present study suggests that bone quantity and quality influence stability after osseointegration. Clinicians are advised to take bone quantity and quality into account in prosthetic treatment.
PS is known to be affected by multiple factors (for example, bone quality and quantity [1718], surgical technique [22], and implant design [101118]). Although good PS, which is related to the original volume of bone contact, is not strictly required for the osseointegration of dental implants [56], it is an important for selecting a loading protocol [141516], and it is the most important factor when deciding the loading term. SS arises from secondary contact with woven and lamellar bone [6], which is influenced by the geometry of the implant [11], the roughness of the implant surface [1035], and the local amount and quality of host bone [634]. Hence, particularly in posterior regions of the maxilla, complications such as loss of integration may occur [36]. Moreover, regenerative techniques are often related to dental implant placement and might affect implant stability [2829303132]. Bone quality and quantity are frequently more affected in augmentation cases than in non-augmentation cases [2829303132].
The present study suggests that bone quality and quantity may be responsible for the relationship between PS at the time of surgery and SS after osseointegration. This might be a factor in the occurrence of complications such as loss of integration. RFA has been shown to be a reliable method for measuring implant stability [4233032]. It might serve as an important diagnostic tool to help clinicians evaluate the stability and prognosis of implants. Finally, it is important that treatment planning for dental implant therapy be based on a local assessment of the potential surgical site.
In conclusion, implant stability can be affected by a number of factors. According to the findings of this study, bone quality and quantity, as influenced by site of implant placement, the use of bone grafts, and cortical bone thickness can affect implant stability, and should be considered by the clinician before implant therapy. Further well-designed studies are required to analyze the influence of bone on PS and the stability of osseointegration using different evaluations of bone quality and quantity at the implant site in order to achieve predictable clinical success.
 XML Download