

 PDF
PDF ePub
ePub Citation
 Print
Print


INTRODUCTION
Pulmonary hypertension (PH) is a hemodynamic condition caused by multiple diseases of the lungs and heart, or other systemic diseases. PH is defined as an increase in mean pulmonary artery pressure (mPAP) to ≥ 25 mmHg at rest, as determined by right heart catheterization (RHC), the ‘gold standard’.1) Right ventricular (RV) function in PH is a very important determinant of clinical presentation and prognosis. RV function can be indirectly measured in RHC with right atrial pressure (RAP) to estimate preload, pulmonary artery pressure (PAP), or pulmonary vascular resistance to estimate afterload and stroke volume to reflect contractility.2)
However, RHC is invasive and has fatality risk. Therefore, various noninvasive methods have been used to diagnose PH and evaluate RV function including echocardiography, computed tomography (CT) and magnetic resonance imaging (MRI).
The present review discusses the role of echocardiography and other imaging modalities in diagnosis, evaluation of prognosis, treatment response, and follow up of patients with PH.
ASSESSMENT OF PULMONARY ARTERY PRESSURE
PAP can be estimated on the basis of tricuspid regurgitation (TR) jet velocity. The velocity of TR reflects the pressure gradient between RA and RV, as shown in the Bernoulli equation: ΔP = 4 × TRVmax2.2)3) The addition of RAP to the pressure gradient represents RV systolic pressure, which is considered equal to systolic PAP (sPAP) in the absence of pulmonary stenosis. European guidelines consider the echocardiographic diagnosis of PH ‘likely’ when TR Vmax is > 3.4 m/s and ‘possible’ when TR Vmax is between 2.9 and 3.4 m/s or when TR Vmax is ≤ 2.8 m/s with additional variables suggestive of PH (RV dilatation, RV hypertrophy, or increased pulmonary regurgitant flow velocity).3)
When pulmonary regurgitation (PR) is present, the velocity rises rapidly after the pulmonic valve closes and decreases gradually until the next opening. Mean PAP can be estimated with peak PR velocity using the equation mPAP = 4 × PR Vmax2 + RAP.4)
RIGHT VENTRICULAR STRUCTURAL CHANGES AND FUNCTION IN PH
Quantification of volume and function of the RV remains difficult due to the complex RV structure.7) Therefore, various approaches with multiple imaging modalities including echocardiography, CT, and MRI are needed to evaluate RV volume and function precisely.
Echocardiography
Two-dimensional measurements and Doppler
RV structure and function can be assessed with echocardiography at the time of first diagnosis and during serial follow up in patients with PH.8)
The RV dilates in response to increased PAP and RV remodeling. Enlarged RV can predict mortality in patients with pulmonary disease and pulmonary arterial hypertension (PAH).9)10) RV dimension is measured at the basal mid-cavity level and longitudinally in the four-chamber view. The RV dimension (upper limit 42 mm) should also be compared with left ventricular (LV) dimensions to help distinguish enlarged RV from global heart dilatation (Figure 1A).4)
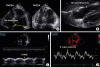 | Figure 1Methods of analysis of right ventricular (RV) structures and RV function. (A) RV dimension is measured at the basal level in the four-chamber view. RV fractional area change can be calculated as (RV end-diastolic area [RVEDA] - RV end-systolic area [RVESA]) / RVEDA × 100) and, is a simple way to evaluate RV systolic function. (B) RV thickness more than 5 mm is suspicious of RV hypertrophy secondary to pulmonary hypertension. (C) Tricuspid annular plane systolic excursion (TAPSE) is the distance of the tricuspid annulus during the cardiac cycle using M-mode. (D) The peak systolic velocity of the lateral tricuspid annulus (S′) is measured by pulsed tissue Doppler imaging.
|
As the disease progresses, RV hypertrophy develops, resulting in a wall thickness greater than 5 mm (Figure 1B).11)
Significant TR is commonly seen in advanced PH. TR occurs secondary to increased PAP, RV dilatation, tricuspid annular dilatation and apical displacement of tricuspid leaflets.12)
RV fractional area change (FAC) is a two-dimensional measure of RV global systolic function and is calculated as [(end-diastolic area − end-systolic area) / (end-diastolic area)] × 100. An RV FAC < 35% indicates RV systolic dysfunction (Figure 1A).11) Lee et al.13) reported that FAC provided a more accurate estimate of RV systolic function compared with tricuspid annular plane systolic excursion (TAPSE) and could be used as an independent predictor of morbidity and mortality. MRI derived RV FAC approximated RV ejection fraction (EF) well in a large cohort of patients with PH.14)15)
However, Sato et al.16) showed that RVEF in patients with PH was best estimated by TAPSE compared with RV FAC. Longitudinal systolic RV function can be estimated using TAPSE (Figure 1C) and peak systolic velocity of the lateral tricuspid annulus (S′) (Figure 1D). TAPSE has previously been shown to be correlated to RVEF measured by first-pass ventriculography17) and MRI.16) The normal cut off value of TAPSE is 16 mm.18) TAPSE also has significant prognostic importance in PAH, especially in patients with idiopathic PAH, systemic sclerosis-associated PAH, and Eisenmenger's syndrome.19)20)21) However, TAPSE does not correlate well with chamber remodeling that does not equally affect the basal, mid, and apical portions of the RV, especially in cases of severe TR.22)
Doppler tissue imaging (DTI) can measure S′, which is the peak velocity of longitudinal movement of the tricuspid lateral annulus at systolic phase and representative of regional RV systolic function. S′ is well correlated with TAPSE, and the lower reference limit in normal control patients has been established as 10 cm/s.11)23) But, the value of S′ has limitations to assess global RV systolic function in some pathological conditions with differing systolic velocities of the basal and middle segments of the RV free wall.24)
Three-dimensional echocardiography
Complex anatomy of RV can be well assessed using three-dimensional echocardiography (3DE), which. can evaluate RV volumes and EF with improved reproducibility and accuracy. Many studies have shown that real-time 3DE (RT3DE) with a-two-dimensional summation method provide comparable and feasible measurements of RV volume and function in patients with PH compared to MRI.25)26)27) Evaluation of RV volume and EF by RT3DE has shown higher discriminating power-compared with two-dimensional RV diastolic area and-relative FAC.28)
Many 3D data sets require offline processing. Commercially available dedicated systems are commonly used to analyze RV 3D volumetric datasets and with a disc summation method, to calculate-RV end diastolic (RVEDV), end-systolic volume (RVESV), and RVEF. After manual tracing of the endocardial borders, the software automatically detects the RV surfaces throughout the cardiac cycle on each of the three planes at both end-diastole and end-systole and edits the contour revision. Papillary muscles, moderator bands, and trabeculae should be included in the cavity volume (Figure 2).28)
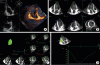 | Figure 2Real-time three-dimensional echocardiography images using a commercially available system (EchoPAC PC, TomTec Imaging, Inc., Munich, Germany). (A) 3D images of RV are acquired in the RV focused four-chamber view. (B) Alignment of the LV / RV axis is based on the mitral valve, tricuspid valve, and apex. Aortic annulus and junction of the ventricle should be pointed identified manually. (C) Contour revision is edited at end-diastolic phase in four-chamber and short axis views from base to apex. (D) RV volume and RV function are measured by automatic analysis. LV: left ventricle, RV: right ventricle.
|
Jenkins et al.29) reported that 3DE slightly overestimated RVEDV and RVESV compared to MRI, although the level of overestimation was not statistically significant. In another study by Leibundgut et al.,30) no significant difference was observed for EF between 3DE and MRI. The lower cut-off for 3D RVEF is 44%, and the upper reference limits for EDV and ESV are 89 mL/m2 and 45 mL/m2, respectively.4)
Strain imaging
Strain is a method for measurement of regional or global deformation of the myocardium and is expressed as a percentage. Longitudinal strain, which can be measured by DTI and two-dimensional speckle tracking echocardiography (2DSTE), is a reliable and accurate way to measure RV systolic function, and has been validated with MRI for several human cardiovascular diseases (Figure 3).31)32)33)
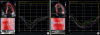 | Figure 3Longitudinal strain measured by two-dimensional speckle tracking echocardiography. (A) Right ventricular global longitudinal strain (RVGLS) is −23% with normal global RV function. (B) RVGLS is −14% suggestive of decreased RV function.
|
Strain analysis using 2DSTE provides an angle-independent measurement of RV systolic function with better reproducibility than DTI analysis.34) RV global longitudinal strain (RVGLS) with 2DSTE is decreased in PH patients. Patients with systemic sclerosis related PH were found to have markedly decreased RVGLS (−12.6 vs −16%), and a cutoff value of −13.7% predicted reduced long-term survival.35) In another study, RVGLS ≥ −19% was significantly associated with all-cause mortality in 150 patients with PH of different etiology.36) Fine et al.37) examined a large population with PH and found that two-dimensional RV strain analysis could discriminate between patients who had a relatively good versus a poor prognosis. In a recent meta-analysis, RV strain performed using 2DSTE provided important prognostic value within a large and mixed populations of PH patients.38)
RV free wall LS (RVFWS) by DTI is measured using the RV free wall in an RV-focused apical 4-chamber view at a high frame rate of acquisition (> 40 frames/s) and can be applied in various diseases.39)40) An update of cardiac chamber quantification using meta-analysis of several studies found normal two-dimensional RVFWS to be −29 ± 4.5% with a suggested cutoff value > −20% to be abnormal.41) The values of RVGLS and RVFWS were significantly lower in pressure overloaded patients compared to volume overloaded patients.42) Two-dimensional RV strain also can help identify the early signs of RV dysfunction36) and can detect subclinical alterations in RV function before symptom onset.43)
LV strain analysis has developed to include 3D imaging, and 3DE software has improved in its ability to reconstruct dynamic volumetric data sets and perform strain analysis of both LV and RV. Smith et al.44) evaluated 3D RV free wall strain and RVEF in 97 patients with PH. They found that all RV strain parameters were diminished in patients versus controls, and RV area strain was the independent echocardiographic variable associated with mortality. 3D RV strain analysis offers improved multidirectional deformation assessment, allowing both longitudinal and circumferential strain calculation, while also providing the ability to measure axis-independent indices such as area strain.45)
RV-specific programs46) in which RV global and regional motion and deformation (circumferential, longitudinal, and area strains) were affected in all segments (p < 0.001 against healthy controls) have been validated. Global RV area strain > −18% was the most powerful RV function parameter predicting increased risk of death.
COMPUTED TOMOGRAPHY AND COMPUTED TOMOGRAPHY PULMONARY ANGIOGRAPHY
CT is also useful to evaluate cardiopulmonary structures and the cause of PH. CT can identify the underlying disease including parenchymal lung diseases and systemic diseases with manifestations in the lung parenchyma. The most prominent finding on CT suggestive of PH is dilation of the main pulmonary artery (PA). A systematic review of the sensitivity and specificity of different PA diameter cutoffs for identifying PH found an average reported cutoff of 29.5 mm (range 25.0–33.2) among 12 studies that included patients from different PH groups.47) Dilatation of the main PA and a main PA to ascending aorta (AA) diameter ratio > 1.0 are highly indicative of PH.48) The PA/AA diameter ratio correlated strongly with RHC-derived mean PA pressure and was enhanced when combined with echocardiography-derived RV systolic pressure to detect PH (Figure 4).49)
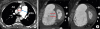 | Figure 4CT findings of pulmonary hypertension (PH). (A) Dilatation of the main pulmonary artery (MPA) and an MPA to ascending aorta (AA) diameter ratio > 1 are highly suspicious of PH. (B) Right ventricular dilation, hypertrophy, flattening and bowing of the interventricular septum are seen.
|
Reflux of intravenous contrast into the hepatic veins, RV hypertrophy, RV dilatation, flattening of the interventricular septum, and dilation of the bronchial arteries can be also found in patients with PH.50) Chronic pressure and volume load cause RV hypertrophy and septal bowing into the LV during the cardiac cycle. Chan et al.51) showed that increased end‑diastolic thickness of the RV free wall (≥ 6 mm), increased RV/LV lumen ratio ≥ 1.28, and RV/LV wall ratio ≥ 0.32 also predict PH.
Multidetector CT also plays a significant role in identifying PH type. Left heart disease (Group 2)52) is the most common cause of PH and chronic elevation of LV filling pressure due to various causes results in this type of PH. Therefore, imaging to assess structural and valvular abnormalities causing elevated left-side filling pressure is important for evaluation of PH. Interstitial edema with interlobular septal thickening, centrilobular nodular opacities, and/or pleural effusions also are found.53)
PH due to lung disease or hypoxia is classified as Group 3.52) Parenchymal lung findings with chronic obstructive pulmonary disease and interstitial lung disease that may be idiopathic or secondary to connective tissue disease or sarcoidosis are observed in patients of Group 3. Pulmonary nodules, extracardiac shunts, and bronchial, and vascular abnormalities can also readily be seen by CT.54)
PH due to chronic thromboembolic disease (Group 4)52) typically shows mosaic perfusion of lung parenchyma, large bronchial artery collaterals, RV enlargement, and irregular vascular wall thickening.55) CT pulmonary angiography shows dilated central PA with thrombi filling defects that may be complete, partial, eccentric, and even calcified, although this is rare.56)
CARDIAC MRI
Cardiac MRI (cMRI) is the reference standard for assessment of RV size and systolic function with good resolution, multi-planar imaging and high tissue characterization.57) Morphological and functional changes of RV in PH can be seen in cMRI. When the pressure in the RV is equal to that of the LV, the interventricular septum becomes flat, if the pressure increases further, paradoxical bowing occurs. Flattening of the interventricular septum can be quantified using cine MRI and is associated with presence of PH.58) In cine MRI, RV and LV end-diastolic and end-systolic volumes can be quantified and used to calculate EF and stroke volume.59) Dilated RV and thickened RV wall are also suggestive of PH. RV dilation is diagnosed in axial images when RV:LV diameter is > 1, and RV hypertrophy is diagnosed when RV wall thickness is > 4 mm.60)
Cine cMRI-derived ventricular mass index (RV/LV mass)55) and interventricular septal angle measurements can estimate pulmonary pressure noninvasively and precisely in PH patients, as shown by Swift et al.,61) and can be used in the clinical routine.62) Increased RV volume and reduced RVEF are predictive of worse outcome in patients with PAH.10)63) Serial cMRI evaluation seems to be of additional prognostic importance and accurate prognostication can aid in adequate and timely intensification of PAH-specific therapy.64)
The typical pattern of delayed enhancement is seen in anterior and posterior RV insertion sites to the interventricular septum in PH patients.65)66) Total delayed enhancement mass correlates with the degree of RV functional change, which suggests that the degree of RV remodeling increases with increased afterload.67) The volume of delayed enhancement correlates with RV remodeling, RV dysfunction, and interventricular septal angle, indicating adverse prognosis.65)
PA flow parameters measured with phase-contrast velocity-encoded cMRI can quantify pulmonary pressure and resistance, as well as cardiac output. Sanz et al.68) found the average blood velocity throughout the cardiac cycle to be strongly correlated with pulmonary pressures and resistance. In the early phase of PH, RV contractility increases in response to pressure overload, but it gradually decreases with severe uncoupling as the disease progresses.69) PA stiffness increases early in the course of PH, and increased PA stiffness is associated with reduced functional capacity and survival in PH patients.70)71)
CONCLUSION
Echocardiography is the first-line diagnostic technique for diagnosis of PH and assessment of RV function. CT evaluates vascular structures, size and morphologic changes of cardiac chambers, and lung parenchyma. cMRI is considered the gold standard for measuring RV volume and EF, although it is limited by cost and availability. Quantification of RV volume and function using RT3DE, CT, and cMRI shows good agreement, and there are unique advantages and limitations of each modality. Understanding these different limitations will aid in diagnosis, evaluation of etiology, and prognosis in patients with PH.
FUTURE PERSPECTIVES
Strain images with 2DSTE can characterize derangements in deformation and other adverse remodeling changes associated with RV dysfunction. As strain analysis software continues to improve, routine 3D RV strain assessment will become an important component of a comprehensive echocardiographic evaluation of RV function. Dual-energy CT provides similar vascular and parenchymal findings to conventional CT with the added benefit of perfusion analysis of the lung via iodine maps. Thus, vascular anatomy, parenchymal morphology, and functional analysis of the lung can be obtained in a single test. Myocardial strain in MRI with myocardial tagging or tracking techniques can analyze regional myocardial function. Two-dimensional and 4D flow MRI permits noninvasive measurements of complex 3D hemodynamic changes with assessment of aortic and PA peak velocities. Novel imaging techniques continued to be investigated, and their roles in diagnostic evaluation of PH and RV function remain to be elucidated.
 XML Download