

 PDF
PDF Citation
 Print
Print


Abbreviations
APC
allophycocyanin
BV
Brilliant Violet™
CTR
CellTrace Red™
CTV
CellTrace Violet™
DC
dendritic cell
DR
antigen-D related
ICI
immune checkpoint inhibitor
Lag-3
lymphocyte activation gene-3
moDC
monocyte-derived dendritic cell
RE
response element
Tim-3
T-cell immunoglobulin and mucin-domain containing-3
INTRODUCTION
Immune checkpoint inhibitors (ICIs), a new class of anticancer drugs that block the effect of inhibitory immune checkpoint receptors, introduced a new era of cancer immunotherapy (1). As of 2018, 2 anti-PD-1 Abs (nivolumab and pembrolizumab) and 3 anti-PD-L1 Abs (atezolizumab, avelumab, and durvalumab) have been approved by the US Food and Drug Administration for the treatment of various cancers, including malignant melanoma (23), non-small cell lung cancer (456), head and neck squamous cell cancer (7), Hodgkin's lymphoma (8), bladder cancer (9), gastric cancer (10), cervical cancer (11), and cancers with microsatellite instability (1213). Based on this success, other anti-PD-1 or anti-PD-L1 Abs are currently being developed (141516). In addition, much preclinical and clinical research on anti-PD-1 or anti-PD-L1 Abs in combination with conventional chemotherapies, target therapies, or immunomodulators has expanded the usage of anti-PD-1 and anti-PD-L1 Abs (171819).
Although many pharmaceutical companies are developing new ICIs and immunomodulators for cancer treatment, in vitro assays for evaluation of the T cell-activating capacity of drug candidates have limitations and need to be improved. Currently, a cell line-based PD-1 blockade reporter gene bioassay is available. This assay is performed using a kit containing Jurkat cells that stably express PD-1 and NFAT-response element (RE)-luciferase reporter, and Chinese hamster ovary-K1 cells that stably express PD-L1 and TCR activator (20). However, this assay system has limitations. Jurkat cells have significant defects in TCR signaling, particularly in the PI3K pathway (21); thus, the NFAT reporter incompletely presents the effects of anti-PD-1. In addition, it is hard to evaluate the effects of the combination of anti-PD-1 with other immunomodulatory agents. A MLR using monocyte-derived dendritic cells (moDCs) is also used to evaluate the functional activities of anti-PD-1 blocking Abs (2223). However, whether moDC-based MLR can be used to evaluate the functional activities of other immunomodulators has not yet been shown. Moreover, it is difficult to perform moDC-based MLR on the large-scale because moDCs need to be prepared with special effort.
In the present study, we established a modified two-round MLR without moDCs for evaluation of the functional activities of anti-PD-1 blocking Abs and other immunomodulators. We re-applied the same stimulator PBMCs to the allo-stimulated responder cells on day 6 when anti-PD-1 or immunomodulators were added to the MLR. By using this two-round MLR method, we showed that anti-PD-1 increased the proliferation of allo-reactive T cells in a dose-dependent manner. We also evaluated the functional activities of other immunomodulators in combination with anti-PD-1.
MATERIALS AND METHODS
PBMCs
Peripheral blood was obtained from healthy donors. PBMCs were isolated from whole blood by standard Ficoll-Paque (GE Healthcare, Uppsala, Sweden) density gradient centrifugation and cryopreserved until use. This study was conducted according to the principles of the Declaration of Helsinki and approved by the Institutional Review Board of the Institution (KH 2010-21).
Reagents and Abs
The following fluorochrome-conjugated mAbs were used for multicolor flow cytometry: anti-CD3-Brilliant Violet™ (BV) 786 (SK7), anti-CD4-BV786 (RPA-T4), anti-CD4-BV605 (RPA-T4), anti-CD8-allophycocyanin (APC)-H7 (RPA-T8), anti-CD14-BV605 (M5E2), anti-CD11c-BV650 (B-ly6), anti-CD19-PE-CF594 (HIB19), anti-HLA-antigen-D related (DR)-PerCP-Cy5.5 (G46-6), anti-PD-L1-PE-Cy7 (MIH1), anti-PD-L2-PE (MIH18) (BD Bioscience, San Jose, CA, USA), anti-PD-1-BV421 (EH12.2H7), anti-CD3-APC (SK7), anti-T-cell immunoglobulin and mucin-domain containing-3 (Tim-3)-PE (F38-E2E) (Biolegend, San Jose, CA, USA) and anti-lymphocyte activation gene-3 (Lag-3)-PE-eFluor610 (3DS223H) (Invitrogen, Carlsbad, CA, USA). For functional assays, anti-PD-1 (EH12.2H7, Biolegend) and mouse IgG1 isotype control Abs (IS5-21F5, Miltenyi Biotec, Bergisch Gladbach, Germany) were used. TGF-β receptor-1 inhibitor (galunisertib, LY2157299) was purchased from Selleckchem Chemicals (Houston, TX, USA) and lenalidomide from Abcam (Cambridge, MA, USA).
MLR
Stimulators were prepared by pooling PBMCs from 5 donors and gamma-irradiated (30 Gy) with a cesium-137 source. Stimulators were labeled with CFSE (Invitrogen) to be distinguished from responder cells. Responder PBMCs were labeled with CellTrace Violet™ (CTV; Invitrogen) or CellTrace Red™ (CTR; Invitrogen). Labeling was performed with 1–2×10⁶ cells/ml in PBS containing 5% FBS (WelGENE, Daegu, Korea) for 20 min at 37°C according to the manufacturer's protocols. After washing with PBS containing 5% FBS, CFSE-labeled stimulators and CTV- or CTR-labeled responders were resuspended at 1×10⁶ cells/ml RPMI 1640 (WelGENE) with 10% FBS, and 1×10⁵ stimulator cells/well and 1×10⁵ responder cells/well were placed in 96-well round bottom plates. The plates were maintained in a 37°C CO2 incubator for 6 days.
In the two-round MLR, the first round was performed as described above. For the second round, all of the cells from the first round were harvested and pooled on day 6. The harvested cells including CTR-labeled responders and CFSE-labeled stimulators from the first-round MLR were further labeled with CTV (1–2×10⁶ cells/ml) in PBS containing 5% FBS for 20 min at 37°C. Stimulator PBMCs from the same donors as in the first round were pooled, irradiated (30 Gy), and stained with CFSE. Both the harvested cells from the first-round MLR and stimulator cells were resuspended at 1×10⁶ cells/ml in RPMI 1640 with 10% FBS, and 1×10⁵ harvested (responder) cells/well and 1×10⁵ stimulator cells/well were placed in new 96-well round bottom plates. Anti-PD-1 (10 μg/ml) or other immunomodulators, such as lenalidomide or galunisertib, were added to the MLR culture at this time point. The plates were incubated for 5 days and the percentage of CTVlow proliferating CD4+ or CD8+ T cells analyzed by surface marker staining and flow cytometry. To measure T-cell proliferation accurately, the mitotic index (24) was calculated as follows:
Mitotic Index = Total Number of Mitotic EventsAbsolute Number of Precursor Cells = ∑n0(Xn(T)−Xn(T)2n)/∑n0(Xn(T)2n)
where Xn(T) is the absolute number of daughter T cells in each division peak n.
Flow cytometry
Incubated cells were harvested with FACS staining buffer (PBS containing 1% FBS, 0.1% sodium azide, and 2 mM EDTA). Dead cells were stained using the Live/Dead fixable cell stain kit (Invitrogen). After washing with FACS staining buffer, the cells were stained with fluorochrome-conjugated Abs for 20 min at room temperature. Multicolor flow cytometry was performed using an LSR II flow cytometer or FACSCelesta™ (BD Bioscience) and the data analyzed by FlowJo V10 software (TreeStar, San Carlos, CA, USA).
RESULTS
PD-1 expression is upregulated in allo-reactive CD4+ and CD8+ T cells during MLR
We performed conventional MLR assays using responder PBMCs and pooled irradiated stimulator PBMCs and measured the proliferation of CD4+ and CD8+ T cells by tracing the CTV dye dilution (Fig. 1A). The proliferation of allo-reactive CD4+ and CD8+ T cells was detected by dilution of CTV dye on day 4 and increased until day 6 (Fig. 1B and C). The expression of immune checkpoint receptors, including PD-1, Tim-3, and Lag-3, on CD4+ and CD8+ T cells was also increased during MLR (Fig. 1D). In particular, the percentage of PD-1+ cells was significantly higher among CTVlow proliferating CD4+ or CD8+ T cells than non-proliferating CD4+ or CD8+ T cells (Fig. 1E and F), indicating that PD-1 expression is increased preferentially in allo-reactive CD4+ and CD8+ T cells during MLR.
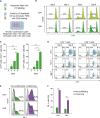 | Figure 1Upregulation of PD-1 expression in allo-reactive CD4+ and CD8+ T cells during MLR. (A) Conventional MLR was performed as described in the section of Materials and Methods. (B) Representative FACS histograms for CTV in the gate of responder CD4+ and CD8+ T cells are presented. (C) The percentage of CTVlow proliferating cells among responder CD4+ and CD8+ T cells was analyzed during MLR. (D) Representative FACS plots for PD-1, Tim-3, and Lag-3 with CTV in the gate of responder CD4+ and CD8+ T cells are presented. (E) Representative FACS histograms for PD-1 in the gate of proliferating (CTVlow) and non-proliferating responder CD4+ and CD8+ T cells are presented. (F) The percentage of PD-1+ cells among proliferating (CTVlow) and non-proliferating responder CD4+ and CD8+ T cells was analyzed during MLR. The experiment was performed with responder PBMCs from 3 donors, and triplicate data from a single donor is presented as representative data. Error bars represent SEM.
**p<0.01; ***p<0.001.
|
Conventional MLR is not suitable for evaluation of the functional activities of anti-PD-1
We tested whether anti-PD-1 blocking Abs can increase the proliferation of allo-reactive CD4+ and CD8+ T cells during conventional MLR. When the MLR culture was set-up, anti-PD-1 blocking or isotype control Abs were added to the culture and incubated for 6 days. Although PD-1 expression was increased in allo-reactive CD4+ and CD8+ T cells during MLR, anti-PD-1 blocking Abs did not increase the proliferation of CD4+ and CD8+ T cells (Fig. 2A and B).
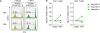 | Figure 2Effects of anti-PD-1 blocking Abs in conventional MLR. Anti-PD-1 blocking or isotype control Abs were added to conventional MLR cultures when the culture was set-up. (A) Representative FACS histograms for CTV in the gate of responder CD4+ and CD8+ T cells with anti-PD-1 blocking or isotype control Abs are presented. Vertical lines indicate the number of cell division. (B) The ratio of the mitotic index with and without anti-PD-1 (mitotic index with anti-PD-1/mitotic index with isotype control Abs) was calculated for responder CD4+ and CD8+ T cells. The experiment was performed with responder PBMCs from 3 donors.
|
PD-L1+ or PD-L2+ cells disappear gradually during MLR
Next, we examined whether the ligands for PD-1 are expressed by cells in the MLR culture. We evaluated the expression of PD-L1 and PD-L2 on T cells (CD3+), B cells (CD19+CD3−CD14−), monocytes (CD14+CD3−CD19−), and dendritic cells (DCs; CD3−CD14−CD19−CD11c+HLA-DR+) in stimulator (CFSE+) cells and responder (CTV+) cells. Among gamma-irradiated stimulator cells, considerable numbers of monocytes expressed PD-L1 (Fig. 3A) and PD-L2 (Fig. 3B), and B cells expressed PD-L1 (Fig. 3A) at the beginning (day 0). However, the number of PD-L1+ or PD-L2+ cells decreased gradually, and only small numbers of monocytes expressed PD-L1 or PD-L2 on day 6 (Fig. 3A and B). More than half of gamma-irradiated stimulator cells died within the first 2 days, and less than 10% of stimulator cells survived until day 6 (Fig. 3C). Among responder cells, PD-L1 was expressed by monocytes and B cells (Fig. 3D), and PD-L2 by monocytes (Fig. 3E) at the beginning (day 0), similar to stimulator cells. However, the number of PD-L1+ or PD-L2+ cells among responder cells also significantly decreased during MLR (Fig. 3D and E).
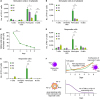 | Figure 3Number of PD-L1+ and PD-L2+ cells during MLR. (A, B) The numbers of PD-L1+ (A) and PD-L2+ (B) stimulator (CFSE+) cells in a well of 96-well round bottom plates were analyzed during MLR. When MLR was set up, 1×10⁵ gamma-irradiated stimulator cells were placed per well. T cells, DCs, monocytes, and B cells were analyzed separately. (C) The percentage of viable cells among stimulator cells was analyzed during MLR. (D, E) The numbers of PD-L1+ (D) and PD-L2+ (E) responder (CTV+) cells in a well of 96-well round bottom plates were analyzed during MLR. When MLR was set up, 1×10⁵ responder cells were placed per well. T cells, DCs, monocytes, and B cells were analyzed separately. The experiment was performed with responder PBMCs from 3 donors, and triplicate data from a single donor is presented as representative data. Error bars represent SEM. (F) Kinetic changes in PD-1 expression on responder T cells and PD-L1 or PD-L2 expression on Ag-presenting cells during conventional MLR are illustrated.
*p<0.05; **p<0.01; ***p<0.001.
|
These data explain why anti-PD-1 blocking Abs could not increase the proliferation of allo-reactive T cells during conventional MLR. Anti-PD-1 can enhance T-cell activity only when PD-1 is expressed on T cells and PD-L1 or PD-L2 are expressed on Ag-presenting cells. During conventional MLR, though PD-1 expression gradually increased on allo-reactive T cells, PD-L1+ and PD-L2+ cells disappeared early (Fig. 3F). Therefore, PD-1 expressed by allo-reactive T cells cannot interact with its ligands, and anti-PD-1 blocking Abs cannot reveal the functional activities.
Anti-PD-1 increased the proliferation of CD4+ and CD8+ T cells during two-round MLR
To solve this problem, we developed a two-round MLR method. In this assay, CTR-labeled responder cells were co-cultured with CFSE-labeled stimulator cells (first-round MLR). After 6 days, all of the cells from the first round were harvested and labeled with CTV, and the same stimulator cells were prepared by pooling the same donors' PBMCs, gamma-irradiated (30 Gy), and labeled with CFSE. The CTV-labeled, harvested cells from the first round were co-cultured with the CFSE-labeled stimulator cells (second-round MLR; Fig. 4A). Anti-PD-1 blocking or isotype control Abs were added to the MLR culture at this time point. After 5 days, we evaluated the proliferation of CD4+ and CD8+ T cells based on the percentage of CTVlow cells, which proliferated during the second round. In this system, anti-PD-1 blocking Abs significantly increased the proliferation of CD4+ and CD8+ T cells (Fig. 4B and C), and anti-PD-1 blocking Abs increased the proliferation of CD4+ and CD8+ T cells in a dose-dependent manner (Fig. 4D).
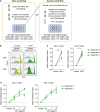 | Figure 4Effects of anti-PD-1 blocking Abs in two-round MLR. (A) two-round MLR was performed as described in the section of Materials and Methods. Anti-PD-1 blocking Abs were added to the MLR culture when the second-round of MLR was set-up. (B) Representative FACS histograms for CTV in the gate of responder CD4+ and CD8+ T cells with anti-PD-1 blocking or isotype control Abs are presented. Vertical lines indicate the number of cell division. (C) The ratio of the mitotic index with and without anti-PD-1 (mitotic index with anti-PD-1/mitotic index with isotype control Abs) was calculated for responder CD4+ and CD8+ T cells. The experiment was performed with responder PBMCs from 3 donors in triplicate. (D) Anti-PD-1 blocking Abs were added to the second-round MLR at various doses, and the ratio of the mitotic index with and without anti-PD-1 was calculated for responder CD4+ and CD8+ T cells. The experiment was performed with responder PBMCs from 2 donors in triplicate. Error bars represent SEM.
**p<0.01.
|
Two-round MLR could evaluate the effects of immunomodulators in combination with anti-PD-1
We examined whether the two-round MLR can be used to evaluate the functional activities of other immunomodulatory agents. We used lenalidomide, which is known to have immune modulatory effects, and found that lenalidomide alone increased the proliferation of CD8+ T cells (Fig. 5A and B), and the combination of lenalidomide with anti-PD-1 further increased the proliferation of CD8+ T cells in a dose-dependent manner (Fig. 5C).
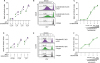 | Figure 5Effects of immunomodulators in combination with anti-PD-1 in two-round MLR. Two-round MLR was performed with immunomodulators, lenalidomide (A-C) or galunisertib (D, F) at various doses in combination with anti-PD-1. Lenalidomode, galunisertib, or anti-PD-1 was added to the MLR culture when the second-round of MLR was set-up. The mitotic index ratio was calculated as the mitotic index in the presence of immunomodulators or anti-PD-1 divided by the mitotic index in the absence of both immunomodulators and anti-PD-1 for responder CD8+ T cells. (B) Representative FACS histograms for CTV in the gate of responder CD8+ T cells with lenalidomide (10 μM) in combination with anti-PD-1 blocking or isotype control Abs are presented. (E) Representative FACS histograms for CTV in the gate of responder CD8+ T cells with galunisertib (1 μM) in combination with anti-PD-1 blocking or isotype control Abs are presented. Vertical lines indicate the number of cell division. The experiment was performed with responder PBMCs from 3 donors (A, D), and triplicate data from a single donor is presented as representative data (C, F). Error bars represent SEM.
|
We also examined the functional activities of galunisertib, a TGF-β receptor 1 inhibitor, in the two-round MLR system. Galunisertib alone increased the proliferation of CD8+ T cells (Fig. 5D and E), and the combination of galunisertib with anti-PD-1 further enhanced the proliferation of CD8+ T cells in a dose-dependent manner (Fig. 5F).
DISCUSSION
Evaluation of the effectiveness of anti-PD-1 blocking Abs requires special considerations compared to other therapeutic Abs that directly deplete malignant cells, such as anti-CD20, anti-epidermal growth factor receptor, and anti-human epidermal growth receptor 2 Abs. Because anti-PD-1 blocking Abs interfere with the interaction between PD-1 and its ligands, restoring the function of exhausted T cells, we need a system containing both PD-1-expressing T cells and PD-L1- or PD-L2-expressing cells for in vitro evaluation of the functional activities of anti-PD-1 Abs.
Although a bioluminescent cell-based assay kit is available to evaluate the functional activities of anti-PD-1 Abs (20), the assay kit has some limitations. In this assay kit, PD-1-transfected Jurkat cells with NFAT-RE-luciferase reporter are used as responding cells. However, Jurkat cells have a fundamental signaling defect in the PI3K pathway, one of the central downstream pathways of TCR signaling (21). PD-1 signaling inhibits Akt phosphorylation by preventing CD28-mediated activation of PI3K, and Jurkat cells harbor many mutations in genes related to TCR signaling, including PTEN, INPP5D, CTLA4, and SYK (25). It is difficult to evaluate the effects of the combination of anti-PD-1 with other immunomodulatory agents.
In the present study, we established the two-round MLR method that can evaluate the T cell-activating capacity of anti-PD-1 and other immunomodulators. Initially, we performed conventional MLR and found that it cannot be used to evaluate the functional activities of anti-PD-1 blocking Abs. During conventional MLR, although PD-1 expression is gradually increased on allo-reactive T cells, PD-L1+ or PD-L2+ cells disappear early (Fig. 3F). Therefore, PD-1 expressed by allo-reactive T cells cannot interact with its ligands in conventional MLR, and anti-PD-1 blocking Abs cannot reveal the functional activities. However, in the two-round MLR, anti-PD-1 blocking Abs are added to the second round when PD-L1+ and PD-L2+ cells are newly provided from stimulator cells. By using this method, we could evaluate the T cell-activating capacity of not only anti-PD-1, but also other immunomodulators, such as lenalidomide and galunisertib, a TGF-β receptor-1 inhibitor. The two-round MLR does not require moDCs and enables the large-scale assays required for in vitro screening of drug candidates. This method can also be used to evaluate the combination treatment of anti-PD-1 with various immunomodulators.
In summary, we established a two-round MLR method without moDCs for evaluation of the functional activities of anti-PD-1 Abs and immunomodulators. By using this method, we showed that anti-PD-1 blocking Ab or immunomodulators increased the proliferation of allo-reactive T cells. We also evaluated the functional activities of immunomodulators in combination with anti-PD-1. This method can be used to screen drug candidates in the development of new ICIs and immunomodulators.
 XML Download