

 PDF
PDF ePub
ePub Citation
 Print
Print


INTRODUCTION
Hypogonadism in men is defined by the Endocrine Society as a clinical syndrome that results from failure of the testis to produce physiological levels of testosterone (T) due to disruption of one or more levels of the hypothalamic-pituitary-testicular axis [1]. While there is no established T level below which all men should undergo treatment, most symptoms of hypogonadism begin below T levels of 300 ng/dL, which corresponds to most laboratories' lower limit of normal [12]. Associated symptoms include decreased libido, erectile dysfunction, decreased physical stamina and strength, depressed mood, fatigue, increased visceral adiposity, sleep disturbance, and/or poor concentration and memory [3]. Hypogonadism is classified as primary, secondary, or compensated. Primary hypogonadism represents the failure of testes to produce T and is diagnosed by laboratory measurements of decreased T and elevated luteinizing hormone (LH). Secondary hypogonadism represents failure at the level of the hypothalamus or pituitary to adequately stimulate testicular function and is diagnosed by laboratory measures of decreased T and decreased LH. Compensated hypogonadism is a more recently recognized clinical entity and represents a subclinical, prodromal state of primary hypogonadism [4]. In compensated hypogonadism T levels are within the normal range but LH levels are increased.
Men with low T and the clinical symptoms of hypogonadism are typically treated with testosterone replacement therapy (TRT). Although TRT is widely used, it is not without side effects. Side effects include polycythemia, hypertension, increased estrogen, fluid retention, infertility, and possibly cardiovascular disease [456]. A widely-used alternative to TRT is off-label clomiphene citrate (CC). CC is a selective estrogen receptor modulator that increases production of endogenous T in men with still-functioning Leydig cells by inhibiting the negative feedback of estradiol onto the hypothalamus. Patients have reported equal satisfaction in the use of TRT versus CC [5]. However, considering that the mechanism of CC depends on the presence of functioning Leydig cells, CC is a less favorable option for men with primary hypogonadism compared to those with secondary hypogonadism. Given the difference in treatment options between primary and secondary hypogonadism, it is important to classify the type of hypogonadism as primary or secondary in men who present with the clinical symptoms of hypogonadism and low T.
In 2006 the Hypogonadism in Males study estimated the prevalence hypogonadism to be 38.7% among men over the age of 45 years presenting to primary care clinics [6]. However this study did not classify hypogonadism into primary, secondary or compensated. In 2010, Tajar et al [4] published findings on the prevalence of hypogonadism in the community at large using data from the European Male Aging Study (EMAS). They estimated the overall prevalence of hypogonadism among older men to be 23.3% with secondary hypogonadism being the most prevalent subtype (approximately 50%). They also found elevated BMI to be associated with secondary hypogonadism. What is not known is the prevalence of the subtypes of hypogonadism in the population presenting with symptoms of low T to tertiary academic centers.
The goal of our study was to assess and classify the prevalence of hypogonadism among men presenting to a tertiary academic center with a diagnosis of ‘low testosterone’, ‘decreased libido’, or ‘lack of energy’. A second goal of our study was to evaluate risk factors such as age, body mass index (BMI), smoking status, alcohol consumption, and presence of comorbidity as possible predictors of primary, secondary, or compensated hypogonadism.
Go to : 
MATERIALS AND METHODS
1. Subjects
After institutional review board (IRB) approval, the medical records of all men with International Classification of Diseases (ICD)-9 diagnosis codes R68.82 and 799.81 for low libido, 257.2 for testicular hypofunction, and E29.1 for other testicular hypofunction between 2013 and 2017 at a tertiary academic center were reviewed. We included only men who had at least two T levels and at least one LH level drawn before 10:00 am on the same day. Patients who had been on T replacement, CC, anabolic steroids, anastrazole, or human chorionic gonadotropin (HCG) for any period were excluded.
2. Hormone measurements
All T and LH levels for patients included in our study were drawn before 10:00 am on the same day. T was measured by liquid chromatography/tandem mass spectrometry (LC/MS/MS) or electrochemiluminescence immunoassay (ECLIA) per Quest Diagnostics and LabCorp protocols respectively. LH was measured by ECLIA per Quest Diagnostics and LabCorp protocols.
3. Experimental design
We classified men based on T and LH levels as: eugonadal (T>300 ng/dL and LH<8 mIU/mL; n=99), primary (T<300 ng/dL and LH>8 mIU/mL; n=17), secondary (T<300 ng/dL and LH<8 mIU/mL; n=98), and compensated (T>300 ng/dL and LH>8 mIU/mL; n=17) hypogonadism. T of 300 ng/dL is similar to what has been used in prior studies and is the cut-off established by the laboratory which measured our population's T level. A total of 300 ng/dL is also the cutoff level supported by the American Urological Association to support the diagnosis of low T [2]. Similarly, LH of 8 mIU/mL is the cut-off established by the laboratory which measured our population's LH level.
4. Statistical methods
Normality of the data was tested using the Shapiro-Francia W' test. One-way ANOVA and its nonparametric analogue Kruskal-Wallis test were used for normally and non-normally distributed values respectively. Fisher's exact test was used for categorial analysis. Pair-wise comparison was conducted using the Dunn test with Bonferroni adjustment for variables which showed significance on Kruskal-Wallis test. A logistic regression model was constructed to predict the gonadal status of men at presentation using the eugonadal group for comparison. Risk factors such as age, BMI, current smoking status, alcohol use, and comorbidities as measured by a Charlson comorbidity index ≥1 or <1 were investigated and compared. All statistical analyses were conducted using STATA MP ver. 15 (Stata-Corp, College Station, TX, USA).
5. Ethics statement
The study protocol was approved by the IRB of The University of Miami (IRB No. 20170849). Informed consent was confirmed by the IRB.
Go to :
RESULTS
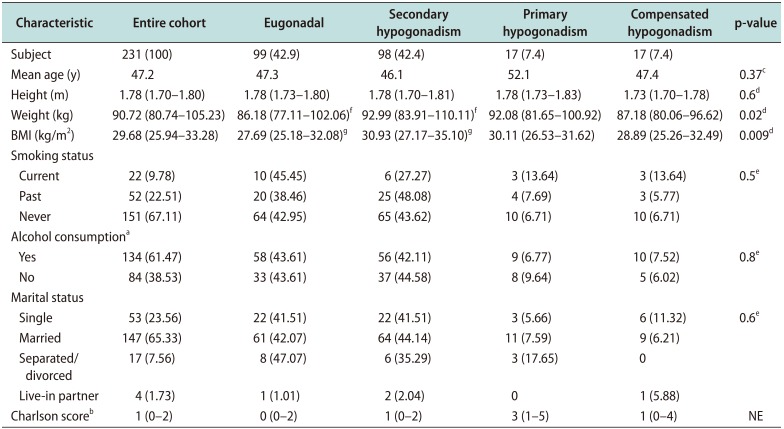
Of the 760 men who were associated with ICD-9 diagnosis codes R68.82 and 799.81 for low libido, 257.2 for testicular hypofunction, and E29.1 for other testicular hypofunction between 2013 and 2017, 231 met inclusion criteria and had both T and LH levels. Of these 231 men, 99 (42.9%) were eugonadal and 132 (57.1%) were hypogonadal. Of the hypogonadal group, 98 (74.2%) were secondary hypogonadal, 17 (12.9%) were compensated hypogonadal, and 17 (12.9%) were primary hypogonadal (Fig. 1). Men with secondary hypogonadism had similar age, comorbidities, prevalence of smoking and alcohol use compared to eugonadal men. Men presenting with secondary hypogonadism had significantly greater BMI in comparison to eugonadal men (median BMI, 30.93 kg/m2
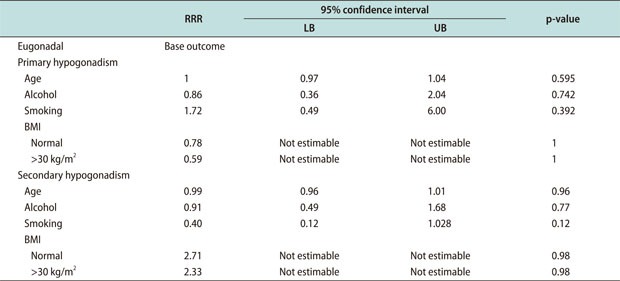
vs. 27.69 kg/m2, p=0.003; Table 1). Characteristics such as BMI, age, comorbidity, smoking, or alcohol use did not appear to predict diagnosis of secondary or primary hypogonadism (Appendix).
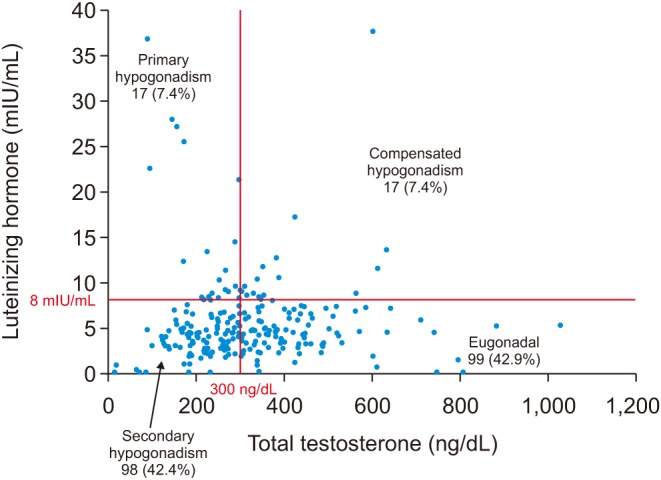 | Fig. 1Of the 231 men included in our study population, 99 (42.9%) were eugonadal, 98 (42.4%) had secondary hypogonadism, 17 (7.4%) had primary hypogonadism, and 17 (7.4%) had compensated hypogonadism.
|
Table 1
Subject demographics
Values are presented as number (%), mean only, or median (interquartile range).
BMI: body mass index, NE: not estimable.
aMore than 5 times a week. bAge-adjusted Charlson score. cOne-way ANOVA. dKruskal-Wallis test. eFisher's exact test. f,gSignificantly differed in the pairwise Dunn test with Bonferroni adjustment (fp=0.01, gp=0.003).
![]()
Go to :
DISCUSSION
Previous studies have reported the prevalence and classification of hypogonadism in the general population. The purpose of our study was to classify the hypogonadal status of men presenting to a tertiary academic center and investigate risk factors and possible predictors of hypogonadal classification. Among our study population, we found secondary hypogonadism to be clearly the most prevalent form of hypogonadism, which was associated with only elevated BMI. To the authors' knowledge no prior study has sought to classify the gonadal status of men presenting to a tertiary care center.
The present study findings are closely aligned with the findings of the EMAS study in several ways, demonstrating similarity between the general population and men presenting to a tertiary care center. The studies align with regards to the prevalence of secondary hypogonadism compared to primary hypogonadism. The present study found the ratio of secondary hypogonadism to primary hypogonadism to be 5.7:1 among men presenting to a tertiary care center; compared to the EMAS study which found a ratio of 5.9:1 among the general population [4]. These similar ratios could demonstrate that men with secondary and primary hypogonadism present to tertiary centers at similar rates.
The association between elevated BMI and secondary hypogonadism is well-documented in the literature, and several mechanisms have been proposed to reconcile this relationship [7]. Proposed mechanisms include peripheral aromatization of T to estradiol, production of proinflammatory cytokines by adipocytes, and insulin resistance as part of the overall obesity phenotype [89]. Similarly, elevated BMI associated with secondary hypogonadism was the only significant risk factor associated with hypogonadism among our population of men presenting to a tertiary academic center. These findings are also closely aligned with the findings of EMAS study, which found elevated BMI to be the single most powerful predictor of low T among men with secondary hypogonadism in the general population [4]. While our study did not contain a sample size large enough for elevated BMI to predict secondary hypogonadism, we were able to find an association between elevated BMI and secondary hypogonadism. We were unable to find significant association between age, smoking status, alcohol consumption, or comorbidity and our study population.
The main strength of our study is the strict inclusion criteria that we used. Only men with T and LH drawn on the same day, using EIA and ECLIA respectively, were included. We also excluded any patient who had used T replacement, CC, anabolic steroids, anastrazole, or HCG for any period in their history. Limitations include our inability to survey patients' symptoms associated with hypogonadism using a systematic, validated questionnaire. We do however believe that this limitation is mitigated somewhat by the fact that our study population is based on patients who carry a diagnosis of low libido. It is therefore reasonable to conclude that a large proportion of our study population endorse some of the clinical symptoms of hypogonadism. The main limitation of our study is that we were only able to meaningfully classify our population using total testosterone (TT) level rather than free testosterone (FT). Obesity is associated with a decrease in circulating sex hormone-binding globulin, leading to a rise in FT relative to TT [10]. Therefore, it is possible that some proportion of our study population could be reclassified as eugonadal rather than secondary hypogonadal when using FT instead of TT. We were also unable to gather prolactin levels for our patient population given the retroactive design of our study, which is useful for identifying the etiology of hypothalamic or pituitary dysfunction in men with secondary hypogonadism.
Go to :
CONCLUSIONS
Men presenting to tertiary academic centers with hypogonadism and low T are likely to be have secondary hypogonadism and an elevated BMI. Conversely, elevated BMI should strengthen physician suspicions of secondary hypogonadism. Gonadal status should be confirmed with LH measurement in addition to T measurement among these men and the high prevalence of secondary hypogonadism among this population should be taken into account when considering treatment options for these patients. While TRT may still be an option for these patients, alternatives in the form of CC and even lifestyle modification exist, which may provide better results, lower cost, or a milder side effect profile [11].
Go to :
 XML Download