

 PDF
PDF ePub
ePub Citation
 Print
Print


Introduction
Abnormal wound healing in pulmonary fibrosis is characterized by fibroblast and myofibroblast migration and proliferation, decreased myofibroblast apoptosis, and increased activity of and responses to fibrogenic cytokines, especially transforming growth factor β1 (TGF-β1)123.
TGF-β induces phosphorylation of Smad2/3, which is released and further propagates the signal of TGF-β. Changes in the level of Smad have been reported in human fibroblasts and epithelial cells following treatment with glucocorticoids, interferon-γ, and pirfenidone456. TGF-β1 utilizes not only the Smad pathway, but also non-Smad pathways. These non-Smad pathways include the following signaling pathways and molecules: the phosphatidylinositol-3-kinase (PI3K)/Akt pathways, mitogen-activated protein kinase (MAPK), and Rho-like GTPase7. Pendaries et al.8 reported that retinoic acid receptors (RARs) interfere with the TGF-β signaling pathway.
Retinoic acids (RAs), which are active vitamin A derivatives, play a critical role in cell differentiation, proliferation, and apoptosis8910. It has been established that RA exerts its action through the activation of RARs and retinoid X receptors that regulate various transcriptional factors11. Understanding the roles of RA can provide new insights into the products of oncogenes/suppressor genes and the chronic fibrosis of human organs as it is associated with the TGF-β1 signaling pathway.
Additionally, it is well-known that TGF-β1 activates the extracellular-signal-regulated kinase and the MAPK pathway through mitogen-activated protein/extracellular signal-regulated kinase (MEK) in the non-Smad pathway7.
The purpose of this investigation was to determine whether RAs could inhibit the TGF-β1 induced phosphorylation of Smad2/3, and to determine the difference in TGF-β1 expression between epithelial cells and fibroblasts upon pretreatment with MAPK inhibitors. Additionally, we aimed to compare the degree of expression between phospho-Smad2 (p-Smad2) and 3 (p-Smad3) in each cell type. Furthermore, we intended to confirm the effect of TGF-β1 and RA in a bleomycin- induced lung injury and fibrosis mouse model.
Materials and Methods
1. Human epithelial cell line and fibroblast cell line
The A549 epithelial and CCD-11Lu fibroblast cell lines that were used for the experiments in this study were purchased from the American Type Culture Collection (ATCC, Rockville, MD, USA).
The study design in this report was approved by the Institutional Animal Care Committee at the Medical College of Yonsei University (2014-0368). This experiment was performed in compliance with recommendations in the Guide for the Care and Use of Laboratory Animals by the National Institutes of Health.
2. Chemicals and antibodies
TGF-β1 was purchased from Calbiochem (San Diego, CA, USA). Three types of RA, including all-trans retinoic acid (ATRA), 9-cis RA, and 13-cis RA were purchased from Sigma-Aldrich (St. Louis, MO, USA). The primary antibodies to Smad proteins for use in western blotting were obtained from Cell Signaling Technology (Danvers, MA, USA) and Zymed (San Francisco, CA, USA). β-Actin was used as a negative control, and was obtained from Delta Biolabs (Gilroy, CA, USA). The MEK 1/2 inhibitor, U0126, was purchased from Cell Signaling Technology (Beverly, MA, USA) and the p38 MAPK inhibitor (SB203580) was purchased from Santa Cruz Biotechnology (Santa Cruz, CA, USA).
3. Cell culture and chemical stimulation
A549 cells were cultured in RPMI 1640 medium (Gibco BRL, Grand Island, NY, USA) supplemented with 10% fetal bovine serum (FBS; Gibco BRL). CCD-11Lu cells were cultured in EMEM (Beckton Dickinson & Company, Lincoln Park, NJ, USA). Cells were incubated at 37℃ with 5% CO2 for 24-hour durations, and subcultured two-to-three times, weekly, to maintain log phase growth.
To examine the effects of RA on the phosphorylation of Smad induced by TGF-β1, A549 cells were stimulated as follows: (1) TGF-β1, (2) RA, (3) 1 hour pre-stimulated with TGF-β1 prior to RA treatment, and (4) 1 hour pre-treated with RA prior to TGF-β1 stimulation. As a negative control, cells were incubated with only culture medium.
In total, 10−6 mol/L of each individual RA and/or 5 ng/mL of TGF-β1 were administered to the cells. RA and TGF-β1 were administered to A549 cells without delay. After stimulation, A549 cells were incubated for 24 hours, and then subjected to western blotting, as described below.
In a separate experiment, to investigate the effects of TGF-β1 on A549 cells and CCD-11Lu cells, each cell line was pre-treated with a p38 MAPK inhibitor, a MEK 1/2 inhibitor, or neither (control). These pre-treated cells were stimulated as described above; (1) TGF-β1, (2) RA, (3) pre-stimulated with TGF-β1 prior to RA treatment, and (4) pre-treated with RA prior to TGF-β1 stimulation.
4. Western blotting analysis (in vitro )
2×10⁶ cells were dissolved in 100-mm culture plates and pre-incubated with RPMI 1640 medium. After 24 hours in the presence or absence of chemical stimulation, as described above, cells were washed twice with cold phosphate buffered saline (PBS), scraped and solubilized in a RIPA-B buffer containing 0.5% nonidet P-40, 20 mM Tris-HCl (pH 8.0), 50 mM NaCl, 50 mM NaF, 100 µM Na3VO4, 1 mM DTT, 50 µg/mL phenylmethanesulfonylfluoride, 20 µg/mL aprotinin, and 20 µg/mL leupeptin. After 30 minutes at 4℃, cell lysates were cleared of debris by centrifugation at 12,000 rpm at 4℃ for 20 minutes. The protein lysates (20 µg) were applied to 10% sodium dodecyl sulfate polyacrylamide gel electrophoresis gel (SDS-PAGE) gels and transferred to nitrocellulose membranes (Amersham Biosciences, Piscataway, NJ, USA). The membranes were blocked at room temperature with 5% skim milk in TBST (1×TBS, 0.1% Tween 20). After washing twice in TBST, the membranes were incubated with primary Smad antibodies for 2 hours at room temperature. The membranes were then washed 3 times for 10 minutes, each, in TBST, and incubated with the relevant horseradish peroxidase–conjugated secondary antibodies (diluted 1:1,000 in 3% bovine serum albumin in TBST) for 1 hour. After washing three times in TBST, the reactive proteins were visualized using an enhanced chemiluminescence detection system (Amersham Biosciences).
5. Bleomycin-induced lung injury and fibrosis model
Male C57BL/6J mice, 7 weeks old and weighing 18–22 g, were purchased from Orient Bio (Seongnam, Korea). Mice were provided with rodent food and water in a controlled environment. Twelve mice were divided into the following three groups (n=4/group): (A) a control group with PBS inhalation, (B) a bleomycin plus PBS group, and (C) a bleomycin plus ATRA (25 mg/kg) group. Bleomycin (3 mg/mL; Dong-A Pharmaceutical, Co., Ltd., Seoul, Korea) was dissolved in PBS (3 mL). The mice were first lightly anesthetized by inhalation of isoflurane (Abbott Laboratories, North Chicago, IL, USA) in a supine position, and then PBS and bleomycin (50 µL) were administered intranasally. In the bleomycin plus ATRA group, 0.5 mg of ATRA (Sigma) powder dissolved in 0.1 mL dimethyl sulfoxide (DMSO) was injected. In the bleomycin plus ATRA group, bleomycin was only once inhaled and ATRA was injected three times per week, through intrapenitoneum. To collect lung specimens, the experimental mice were sacrificed on day 7 or day 21 using a lethal overdose of xylazine.
6. Histology
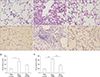
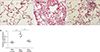
The pulmonary artery was flushed with sterile saline at low pressure, and the right lung was excised and stored at −80℃. Before the left lung was excised, it was inflated via tracheotomy using 4% low-melting point agarose in PBS at 25 cm H2O pressure until pleural margins became sharp. After the left lungs were excised, the mouse lung tissues were fixed overnight in 10% formaldehyde in PBS, and embedded in paraffin. Serial sections (5-µm thick) were then stained with hematoxylin and eosin or with Masson's Trichrome stain. Lung injury score was calculated under a light microscope by two qualified investigators blinded to samples according to the weighted scale guideline12.
7. Western blotting analysis (in vivo)
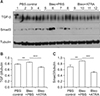
Using PRO-PREP Extraction Solution (600 µL, Cat. #17081, iNtRON Biotechnology, Seongnam, Korea), the excised frozen right lungs (10 mg) were mechanically homogenized, lysed by incubation for 20–30 minutes in a freezer at −20℃, and then centrifuged at 13,000 ×g for 30 minutes at 4℃. Equal aliquots of protein were resolved on SDS-PAGE and transferred to nitrocellulose membranes. The membranes were probed with TGF-β1 (Calbiochem), Smad3 (Millipore Technologies, Billerica, MA, USA), and α-tubulin (Cell Signaling Technology), labeled with anti-rabbit or anti-goat IgG conjugated to horseradish peroxidase, and visualized using a Super-Signal West Pico Chemiluminescence Detection Kit (Pierce, Rockford, IL, USA). Band densities were measured by the Alpha Ease FC software version 4.1.0 (Innotech, San Leandro, CA, USA). Images were analyzed semi-quantitatively using NIH Image J.
8. Hydroxyproline assay
The amount of collagen in the left lung was measured using a hydroxyproline assay kit (Cell Biolabs, San Diego, CA, USA). Lung tissue was homogenized in 100 mL of distilled water, and hydrolyzed in 100 µL 12 N HCl for 3 hours at 120℃. The hydrolyzed samples were mixed with 5 mg of activated charcoal, and centrifuged at 10,000×g for 5 minutes at 4℃. The absorbance of hydroxyproline content was determined at a wavelength of 540 nm, and absolute values were determined from a standard curve.
Results
1. TGF-β1 induced Smad2/3 phosphorylation
To understand the early molecular mechanism involved in the TGF-β1 induced phosphorylation of Smad, the phosphorylation of Smad2/3 was examined using a phospho-specific antibody. TGF-β1 stimulation induced the phosphorylation of Smad2/3 in A549 cells. Time-course analysis revealed that the phosphorylation of Smad2/3 was detected 15 minutes after TGF-β1 stimulation and lasted for 24 hours. The phosphorylation of Smad2/3 in A549 cells reached its peak at 1 hour following TGF-β1 stimulation (Figure 1).
2. The effects of Smad phosphorylation by RA and TGF-β1 stimulation
To examine the dose-dependent effects of RA on the activation of Smad, RAs were dissolved in DMSO (final concentration in culture medium was 0.1%) and the final concentrations of the RAs were 10−7, 10−6, and 10−5 mol/L. A549 cells were incubated with FBS-free RPMI alone or in the presence of various concentrations of each RA for 48 hours. They were subjected to western blotting to identify Smad2/3. The optimal RA concentration was 10−6 mol/L (Figure 2).
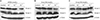
Following TGF-β1 stimulation, both Smad2/3 and p-Smad2/3 were increased compared with the control A549 cells. Each of the three RAs (10−6 mol/L), ATRA, 9-cis RA, and 13-cis RA, elicited a similar effect on Smad phosphorylation. The RAs selectively inhibited the phosphorylation of Smad2/3. When cells were pre-stimulated with TGF-β1 and then treated with the three RAs, the phosphorylation of Smad2/3 was completely abrogated (Figure 3A).
However, when the cells were stimulated with each of the RAs before TGF-β1, different results were observed. After stimulation with TGF-β1, the RAs completely inhibited the phosphorylation of Smad2/3, but when the cells were pretreated with RA and then stimulated with TGF-β1, the phosphorylation of Smad2/3 was not completely suppressed (Figure 3B).
3. Effects of ATRA and MAPK inhibitors differ between A549 epithelial cells and CCD-11Lu fibroblasts
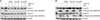
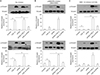
Similar to the A549 epithelial cells, TGF-β1 significantly increased p-Smad2/3 expression in CCD-11Lu fibroblasts, and this effect was completely suppressed by administration of the ATRA. However, when these cells were pre-treated with each of the ATRA, followed by TGF-β1 administration, suppression of p-Smad2/3 expression was not observed (Figures 4A, 5A).
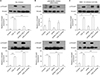
To compare the effects of ATRA and MAPK inhibitors on the phosphorylation of Smad2/3 induced by TGF-β1 between A549 epithelial cells and CCD-11Lu fibroblasts, the cell lines were pre-treated with a p38 MAPK inhibitor (SB203580; 6 µM for 30 minutes) or a MEK 1/2 inhibitor (U0126; 10 µM for 30 minutes) prior to administration of RA and/or TGF-β1 (Figures 4B, C, 5B, C). TGF-β1 administration increased p-Smad2/3 levels, both in A549 and CCD-11Lu cells. However, there were some differences between A549 and CCD-11Lu cells when they were pre-treated with the p38 MAPK inhibitor. In A549 cells, TGF-β1 did not increase p-Smad2 levels. Additionally, p-Smad2/3 levels in A549 cells pre-treated with the p38 MAPK inhibitor, followed by administration of TGF-β1, were lower than those in the cells that were not pre-treated. A549 cells pre-treated with the MEK 1/2 inhibitor showed stable p-Smad3 levels. Although TGF-β1 treatment elevated the levels of p-Smad2 significantly in A549 cells pre-treated with the MEK 1/2 inhibitor, p-Smad2 levels were lower than those in the cells that were not pre-treated.
In CCD-11Lu cells, regardless of pre-treatment with MAPK inhibitors, TGF-β1 increased p-Smad3 levels. p-Smad2 levels, however, were not increased in response to pre-treatment with the p38 MAPK inhibitor.
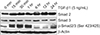
4. ATRA attenuates bleomycin-induced lung injury and fibrosis in mouse model
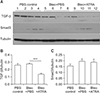
As shown in Figures 6 and 7, bleomycin treatment significantly induced lung injury after both 1 week (p<0.05) and 3 weeks (p<0.001), and ATRA significantly attenuated the lung injury at 3 weeks. At 1 week, the TGF-β and Smad3 levels in the bleomycin group were significantly increased compared with those in the control group (p<0.01 for both levels), but subsequent treatment with 0.5 mg ATRA significantly blocked this increase (p<0.001 for both levels) (Figure 8). However, at 3 weeks, neither TGF-β nor Smad3 levels were significantly increased in the bleomycin group. ATRA only significantly blocked the increase of TGF-β levels (p<0.001), failing to significantly block Smad3 levels (Figure 9).
Discussion
In this study, we demonstrated that RA inhibits the phosphorylation of Smad2/3 induced by TGF-β1 in both epithelial cells and fibroblasts. In addition, the inhibition of Smad2/3 phosphorylation using RA was clearly demonstrated in cells pre-treated with TGF-β1. This implies that RA may have an inhibitory effect on the progression of pulmonary fibrosis in patients who demonstrate activation and over-stimulation of TGF-β1, but not a preventative effect. This phenomenon was also investigated in a bleomycin-induced lung injury and fibrosis mouse model at 1 and 3 weeks. Furthermore, we demonstrated the inhibitory effect of pre-treatment with the p38 MAPK and MEK inhibitors on Smad phosphorylation induced by TGF-β1, and outlined differences in the effects on epithelial cells and fibroblasts. Our study suggests that a combination of MAPK inhibitors and ATRA may exert preventative and inhibitory effects on pulmonary fibrosis.
There is evidence that interactions between RA and TGF-β play important roles in cellular proliferation and differentiation, including modulation of the balance between these two processes13.
The effects of RA on pulmonary fibrosis have been investigated, and RA has been shown to inhibit TGF-β1–induced collagen production from human lung fibroblasts, as well as from both idiopathic pulmonary fibrosis and neonatal lung fibroblasts1415. The inhibitory effects of RA on TGF-β1 are closely related to the phosphorylation of Smad31617. A study demonstrated that ATRA prevents radiation- or bleomycininduced pulmonary fibrosis through reduced production of interleukin 6, TGF-β1, and collagen from human fetal lung fibroblasts18. These data may provide the rationale for exploring the clinical use of ATRA for the prevention of radiationinduced pulmonary fibrosis and other pathologic conditions involving pulmonary fibrosis.
It has been shown that RA induced hypochondrogenesis through regulation of the TGF-β1 pathway, suggesting a role for TGF-β receptor II (TβRII)/Smad in retinoid-induced cleft palate19. In contrast to embryonic cells, RA increased820 or decreased21 expression of TGF-β1 in leukemic cells. TGF-β1 in combination with ATRA acted synergistically to inhibit growth, and to stimulate apoptosis of these cells. The results for the effects of RA on the expression of TGF-β1 are conflicted; depending on cell type, culture conditions, and type of RA used, both elevations and reductions have been reported. This study demonstrated that RAs completely inhibited the phosphorylation of Smad2/3 in the presence of RA alone and when pre-stimulated with TGF-β1 followed by administration of RA. However, RAs did not completely suppress the phosphorylation of Smad2/3 when cells were pre-treated RA followed TGF-β1 stimulation. In our study, epithelial cells that were pre-treated with RA followed TGF-β1 stimulation showed greater phosphorylated Smad2/3 expression than TGF-β1 stimulated epithelial cells that were not pre-treated with RA. This might be the result of a different spatiotemporal status of pre-stimulation because cells pre-treated with RA have a higher responsiveness to TβRII induction to exogenous TGF-β1 administration, as was observed in HL-60 leukemic cells22, where the induction of TβRII led to an increased response to exogenous TGF-β1 and increased phosphorylation of Smad2/3.
In contrast, it might be the result of other mechanisms of Smad phosphorylation. TGF-β1 was shown to activate the PI3K and ERK pathways, which led to Smad3 phosphorylation at the linker region in rat myofibroblasts23. Additional studies are needed to elucidate the effects of RA on the various mechanisms of the TGF-β1 signal transduction pathway, and on the various target genes that promote fibrosis, apoptosis, and epithelial-mesenchymal transition (EMT).
Many studies have indicated that unregulated recovery of epithelial injury is the beginning and cause of pulmonary fibrosis pathogenesis12425. Ross et al.26 demonstrated that Smad3 expression is regulated by mitogen-activated protein kinase kinase-1 (MEK1) in epithelial and smooth muscle cells. p-Smad3 was not increased in epithelial cells in our study upon pre-treatment with a MEK 1/2 inhibitor (Figure 4C). However, in fibroblasts pre-treated with the MEK 1/2 inhibitor, the effect of TGF-β1 was not inhibited (Figure 5C). Our study demonstrated that pre-treatment with MAPK inhibitors was effective in preventing the effect of TGF-β1 on epithelial cells.
Through Smad or non-Smad pathway and extracellular stimuli, TGF-β activate all ERK, p38 MAPK, and JNK MAPK27. In our study, pre-treatment of epithelial cells and fibroblast with a p38 MAPK inhibitor showed a non-significant response to TGF-β1 in p-Smad2. Although TGF-β1 also significantly elevated p-Smad3 expression, regardless of pre-treatment with the p38 MAPK inhibitor, the levels of expression were lower in the absence of the inhibitor. Therefore, the p38 MAPK inhibitor could be effective against both Smad2 and Smad3 phosphorylation.
Previous studies have demonstrated that TGF-β1 is associated with MAPK signaling and EMT induction2829. Through EMT, epithelial cells might be converted to myofibroblasts30. Abnormal activated alveolar epithelial cells are important mediators that induce the formation of fibroblast and myofibroblast foci, which secrete excessive amounts of collagen, resulting in scarring and compromised lung function31. In our study, both fibroblasts and epithelial cells pre-treated with MAPK inhibitors showed significant decreases in Smad2 phosphorylation. Additionally, ATRA was shown to be effective in both epithelial cells and fibroblasts, pre-treated with a MAPK inhibitor, in suppressing p-Smad3. Furthermore, bleomycin-induced lung injury and fibrosis was reduced in vivo by ATRA in our study. At 1 week, TGF-β and Smad3 levels were increased by bleomycin treatment and decreased by subsequent treatment with ATRA. At 3 weeks, TGF-β and Smad3 levels showed increases similar to those shown at 1 week, but only the levels of TGF-β were significantly reduced by ATRA. This could be explained by the possibility that, while TGF-β and Smad3 play important roles in bleomycin-induced lung damage at 1 week, other pathways might exist in lung injury after 1 week. Shi et al.32 showed that the signal of TGF-β was significantly stronger than that in the control group in an animal model within 2 weeks, and the signal of TGF-β was weaker later, as observed in our results. Additional experiments are needed to confirm the role of ATRA and MAPK inhibitors in bleomycin-induced lung fibrosis according to time change. Therefore, early treatment with RA and MAPK inhibitors could be of use in preventing and inhibiting the effect of TGF-β1 in both epithelial cells and fibroblasts. In addition, as shown in the mouse experiment, mechanisms of treatment other than ATRA are needed to lower the level of Smad.
In conclusion, our observations suggest that interactions between RA and TGF-β1 signal transduction pathways may, thus, provide a variety of mechanisms by which subtle alterations in p-Smad expression. Administration of combinations of RA and MAPK inhibitors had inhibitory effects on the phosphorylation of Smad2/3 induced by TGF-β1.
 XML Download