

 PDF
PDF ePub
ePub Citation
 Print
Print


Introduction
Pharmacokinetics (PK) represents essential information for drug development and pharmacotherapy practice. PK describes the processing of administered drugs by the human body in the form of specific formulations: absorption, distribution, metabolism, and excretion. The time course of drug concentrations is the product of these processes, and exposure to any drug is determined in the context of PK parameters. Level of exposure, rather than dose given, is the most critical determinant of individual response to a drug. Therefore, the human effective dose can be estimated during drug development stages based upon PK evidence (dose-exposure relationships) observed in animals. In clinical settings, when drug response varies among patients, clinicians may suspect that PK differences cause such variability. Thus, PK education and training should be provided to clinical personnel, and pharmacology societies recommend that such training should be included in undergraduate curricula.[12]
PK theories are generally included in textbooks of pharmacology, and almost every undergraduate pharmacology course taught in schools of medicine and pharmacy includes lectures on PK. However, the concept of PK is difficult for undergraduate students to understand, even when they have prior experience with similar course content (e.g., chemical kinetics), because it requires fundamental knowledge about human physiology and pharmaceutics and the ability to use mathematical expressions as descriptive tools. Furthermore, even if a student understands all of the PK theories and concepts presented, such understanding does not guarantee that the student will be able to apply PK knowledge to real situations. Although various efforts have been made to address this problem, classical wet lab-based methods have a number of shortcomings. Animal-based PK experiments can create learning opportunities in a variety of situations, but too much detail is required for students to perform.[3] Clinical PK exercises require a subject, allow only minimal sampling within a limited time, and make it practically impossible to learn more difficult routes such as intravenous infusion. Above all, in both cases, there are ethical problems associated with using animal or human subjects for the learning of already known knowledge.[4] As a result, in silico exercises have been suggested during the last few decades.[56]
There are many commercially available training software packages for PK. Based on our previous experience using in silico exercise packages to teach undergraduate courses, we identified two major problems. First, software packages vary by operating system during installation and execution, and therefore exercises cannot be administered as self-learning sessions because the computer environment varies among students. In addition, it is necessary to purchase new versions of software packages whenever there the computer system is upgraded, with upgrades occurring more frequently as computer science improves. Second, most packages provide only limited learning opportunities, and function more like repetitions of PK lectures since they include pre-determined scenarios for dosing and sampling, and focus on data analysis and parameter calculation.
In this study, we develop flexible simulation software that is user-friendly for both the trainer and trainee, along with learning materials to facilitate practical PK education. We review its educational effectiveness and student satisfaction.
Methods
Simulation scenarios
In order to develop a flexible PK learning software package, we did not implement specific PK study scenarios in our software. Instead, general formulas for time courses of drug concentrations after single and multiple dosing were used to build the source code, which allows users to simulate any situation fitting their learning objectives. We selected route of administration (intravascular, IV or extravascular, EV), dosing amount (mg), number of doses, dosing interval (hours), and duration of infusion (for continuous infusion, hours) as input values (dosing information) for user-defined scenarios.
Pharmacokinetic model
Considering the purpose of the software, which was for undergraduate education, the most fundamental PK theory was selected for inclusion. A mathematical relationship for a 1-compartment model was implemented in the form of differential equations with reference to Pharmacokinetics by Gibaldi and Perrier.[7] The following equation was used for IV dosing:
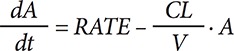
where CL is the clearance, V is the apparent volume of distribution, RATE is the infusion rate and A is the amount of the drug in the body. The value calculated using the dosing amount (DOSE) and duration of infusion (Dinf) was used to determine RATE (DOSE/Dinf) and was set to 0 in the case of bolus injection. To implement EV dosing, the first-order absorption kinetics from the single depot compartment structure was used:
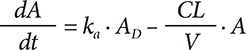
where ka is the absorption rate constant and AD is the drug amount in the depot compartment. Regardless of the simulation scenario, to illustrate a standard covariate relationship, V was set to be proportional to body weight (BW) with a slope of VPW (volume of distribution per unit body weight). Thus, to perform simulations for a typical individual, a total of 5 parameter values (CL, V, BW, VPW, and ka for EV dosing) were required and were set as mandatory PK input values.
The concept of population PK was also taken into consideration for further application. To reflect between-subject variability (BSV), each parameter was modeled as follows:
Pi = PTV · exp(ETAi)
where Pi is the individual parameter value, PTV is the typical value of the parameter given for the typical individual, and ETAi is the difference between Pi and PTV assuming a log-normal distribution. ETAis are randomly generated from the distribution of N(0, ω2) and ω2 was set to be calculated from the magnitude of BSV for each parameter given by the user in the form of the coefficient of variation (CV, %) as follows:
ω2 = ln{(CV / 100)2 + 1}
In addition, user designations of values for correlation coefficients between ETAis of each pair of parameters and for the magnitude of residual error (intra-subject variability) were also allowed. For actual simulation practice, the number of virtual subjects must be input to the system. However, knowledge about population PK is not considered adequate at the undergraduate level; thus, we set the use of population simulations to be optional.
Source code
The source code was written using R (version 3.4.4, The R Foundation, Vienna, Austria) since R is the most widely-used software for PK programming by clinical pharmacology scientists in Korea. All input data were rearranged into two datasets parameters set according to virtual subjects and the dosing history set that was to be simulated. A set of individual PK parameters was randomly generated as a matrix reflecting the magnitude of BSV of each parameter and correlation coefficients between parameters using the ‘mvrnorm’ function implemented in the ‘MASS’ library. These sets were used together as inputs for the differential equations used to generate the time-concentration profile. The ‘compiler’ and ‘deSolve’ libraries were used to handle differential equations.
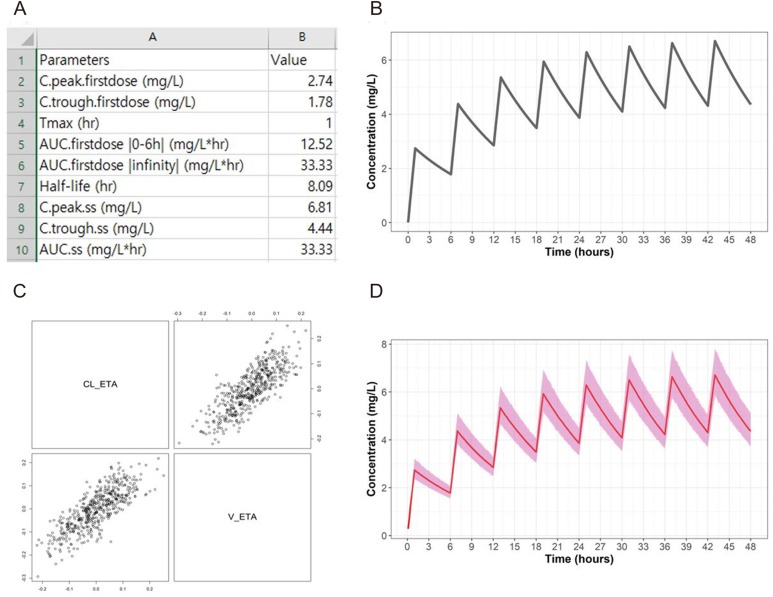
After obtaining the time-concentration profile for a given scenario, output tables and figures were produced. The tables included the actual values of maximum drug concentrations (Cmax), the time needed to reach the maximum value (tmax), area under the time-concentration curve until the last observation (AUCt), total AUC (AUCinf), and elimination half-life (t1/2) for a single dose simulation. For multiple doses, the maximum, the minimum concentration (at the time of the next planned dose), and AUC observed after the last dose were added. Linear scale and semi-log scale plots of time-concentration curves were given in the output window alongside separate files. The plots were generated using the ‘scales’ and ‘ggplot2’ libraries.
Software development
For user convenience, we developed two types of software. Since this software development project was originally a part of the EDISON program funded by the Korean Ministry of Education, the source code was uploaded to the Computational Medicine section of the EDISON system (www.edison.re.kr) for translation into a web-based simulator. However, due to the characteristics of the system, which is optimized for large-scale simulations requiring more than a few hours to complete, several difficulties (e.g., user interface, system run time) were identified when performing simple tasks for undergraduate students such as single-dose and multiple-dose PK simulations without population variability parameters. Thus, to increase the efficiency of class management, a standalone-type software package was developed for personal computers.
The standalone-type program was constructed with free software in the Windows 10 Pro (Microsoft Corporation, Redmond, WA, USA) environment using the JAVA language (jdk1.8.0_131, Oracle Corporation, Redwood City, CA, USA). For the R/JAVA interface, the JAVA/R Interface (JRI) library in the ‘rJava’ package and the ‘eval()’ method from JAVA were recruited. JavaFX Scene Builder (ver. 9.0.1, Oracle Corporation, Redwood City, CA, USA) was selected as a controller. We implemented a GUI function using this controller, with which the user may input the simulation scenario and view simulation results. Once output files are generated through the source code in R, the files are imported by the controller and presented on the screen through the ‘ImageView’ functionality of JavaFX.
Apache Ant™ (ver. 1.10.5, The Apache Software Foundation, Wakefield, MA, USA) was used for the actual build-up of the program. The installation file was produced through two steps. First, the build-up product (.jar file) was converted into an .exe file using launch4j (ver. 3.9), developed by Grzegorz Kowal. At the next step, the execution file was packaged into a single installation file together with other applications and files required to run the software. Inno Setup Compiler [ver. 5.5.9(a)] developed by Jordan Russell and Martijn Laan was used for this procedure. The installation path and folder structure were also defined during this step.
Results
Installation
We confirmed that there were no significant errors in the source code or the installation file during production. The source code was successfully developed as a web-based simulator, which is available at any time after log-in to the EDISON system. This system requires no installation procedures. The standalone-type software takes several minutes for installation with the actual time varying according to the system environment. When the installation is completed, the applications and files may be located according to the folder structure and the path defined during development. We have not found any installation errors in the computer environment of Windows 7 or 10 (both 32-bit and 64-bit systems) thus far.
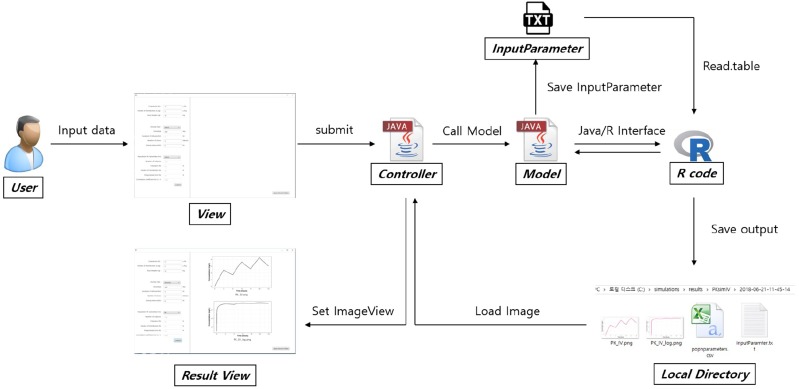
System structure and user interface
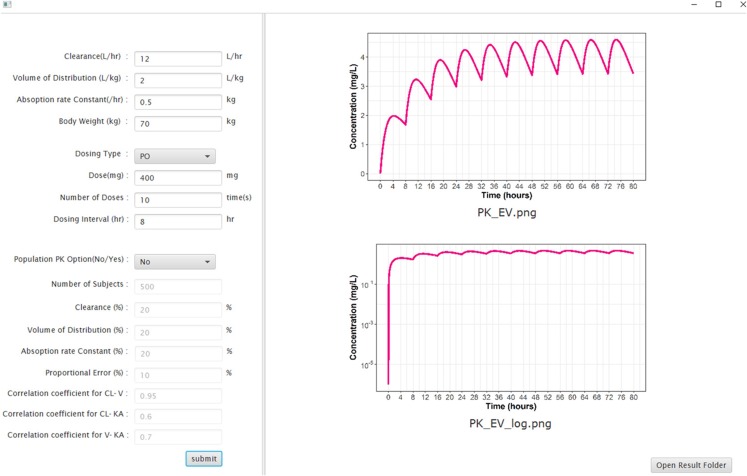
The EDISON web-based simulator and the standalone-type software have similar structures. Since the build-up of the web-based simulator primarily follows the internal rules of the EDISON system, the overall structure of the software can be explained better by outlining the standalone-type software. As described in METHODS, a translational workflow between various components is established as shown in Figure 1. To utilize the simulation functionality, the final product has an input window with fields for PK parameter values, dosing regimen, and population PK options. When a simulation is performed the resulting time-concentration profile is shown in the output window. The actual user interface of the standalone-type EV simulation program is shown in Figure 2. The user can navigate to the folder where the output files are saved by clicking on the ‘Open Results Folder’ button in the output window.
Software performance
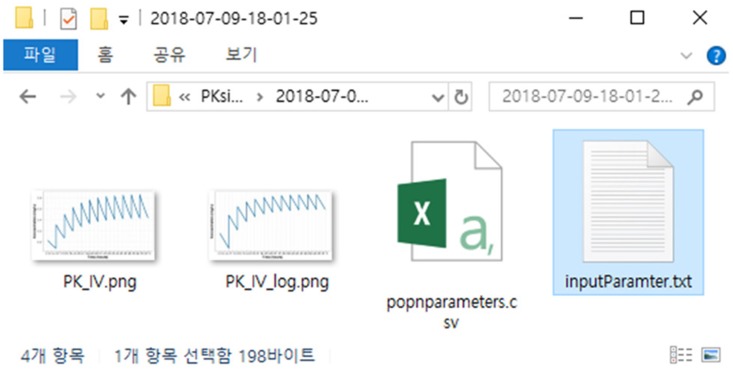
Various single-dose and multiple-dose simulations are well-performed when using the software for both IV and EV dosing situations without any errors in the Windows 7 or 10 environment (both 32-bit and 64-bit systems). The output tables and figures are properly obtained regardless of the simulation scenarios or the utilization of the population PK option. The output files are stored in a folder named according to the time of simulation execution (in the format of ‘YYYY-MM-DD-HH-MM-SS’). For population PK simulations, the actual distribution of randomly generated parameter values is also output as a figure file in the form of a scatterplot matrix. The contents of the output folder are shown in Figure 3. Examples of separate table and figure files are shown in Figure 4. The average simulation runtimes are approximately 2 seconds and 5 seconds for single-dose and multiple-dose scenarios, respectively. When the population PK option is allowed with parameter correlation coefficients (N = 500), the runtime extends to 20–30 seconds. The runtime also depends on the performance of the personal computer and the complexity of the simulation scenario.
Application to undergraduate training
We have developed learning materials to accompany our software that can be used for teaching undergraduate students along with an in silico PK exercise (provided as supplementary material). Currently, more than 400 medical and nursing students at 5 different Korean universities have completed training exercises using the software and the learning material. According to the feedback system in the EDISON website, more than 75% of students thought that the software was easy to use and approximately 82% answered that the software exercise was helpful for improving their understandings of PK concepts.
Discussion
In this study, we developed a user-friendly software package suitable for undergraduate education. Considering the increasing popularity of in silico-based PK education, it seems very appropriate to develop such software as an open tool for wide use in Korea. We used open source tools to build everything, from the source code to the software for building the system. We confirmed satisfactory levels of performance and created a system that meets our development objectives. The UI is intuitive, and if a user has basic PK knowledge, it can be used immediately after program execution without requiring a separate manual. In addition, by incorporating uncomplicated PK theory, simulation results may be obtained within 1 minute even if the population PK option is selected and many parameters are considered, and users can learn about various situations in a short time.
For more than two years, we were very satisfied with the results of training using this software to teach many undergraduate classes. From the viewpoint of the instructor, student participation was improved compared to indirect experience-based PK exercises using other media, and the learning outcomes that were achievable during limited class time were greatly increased. In addition, the practice of serial sampling after administering pharmaceuticals to a small number of volunteers focuses mainly on the procedural side, and practical training regarding PK theory is impossible. However, when using our in silico method, rich data could be obtained and analyzed for various dosing regimens, providing more opportunities for learning about the principles and concepts of PK. Student satisfaction was high. Many students reported that the program was easy to understand. We found that our development goal of producing user-friendly software was fully realized, and students indicated that their own understanding of PK was improved after use.
In order to increase the utilization of our software, we are planning further development. First, we would like to add options that reflect various types of drug absorption patterns as well as models that take into consideration different distribution characteristics, such as the 2-compartment model. If these functions are added, the software is expected to be suitable for training graduate students and for industry scientist education. In addition, it is possible to obtain various simulation plots without R or NONMEM by reporting the final model obtained as the result of PK modeling, making our software useful for purposes beyond simple education. However, additional functions such as auxiliary lines should also be developed. In terms of system performance, it is necessary to provide more advanced web-based services using R Shiny, because the web-based application is more accessible than individual PC-based applications that require separate installation files. In such cases, it is recommended to use R Shiny because the source code itself is written in R and system development and use efficiency is better than that obtained by using a separate program such as JAVA. In addition, it will then be possible to develop a method for reporting simulation results using the ‘Rmarkdown’ package.
In silico-based PK education is highly effective and is readily applicable.[568] Pharmacology experts will be able to actively use our software when teaching various audiences, including undergraduates. If individual user experience is reflected in future development, higher level software development is possible.
 XML Download