Journal List > Korean J Orthod > v.49(1) > 1109418

Song, Chae, Shin, Sung, Song, Baek, and Kim: Influence of heritability on craniofacial soft tissue characteristics of monozygotic twins, dizygotic twins, and their siblings using Falconer's method and principal components analysis

Abstract

Objective

The purpose of this study was to investigate the influence of heritability on the craniofacial soft tissue cephalometric characteristics of monozygotic (MZ) twins, dizygotic (DZ) twins, and their siblings (SIB).

Methods

The samples comprised Korean adult twins and their siblings (mean age, 39.8 years; MZ group, n = 36 pairs; DZ group, n = 13 pairs of the same gender; and SIB group, n = 26 pairs of the same gender). Thirty cephalometric variables were measured to characterize facial profile, facial height, soft-tissue thickness, and projection of nose and lip. Falconer's method was used to calculate heritability (low heritability, h2 < 0.2; high heritability, h2 > 0.9). After principal components analysis (PCA) was performed to extract the models, we calculated the intraclass correlation coefficient (ICC) value and heritability of each component.

Results

The MZ group exhibited higher ICC values for all cephalometric variables than DZ and SIB groups. Among cephalometric variables, the highest h2(MZ-DZ) and h2(MZ-SIB) values were observed for the nasolabial angle (NLA, 1.544 and 2.036), chin angle (1.342 and 1.112), soft tissue chin thickness (2.872 and 1.226), and upper lip thickness ratio (1.592 and 1.026). PCA derived eight components with 84.5% of a cumulative explanation. The components that exhibited higher values of h2(MZ-DZ) and h2(MZ-SIB) were PCA2, which includes facial convexity, NLA, and nose projection (1.026 and 0.972), and PCA7, which includes chin angle and soft tissue chin thickness (2.107 and 1.169).

Conclusions

The nose and soft tissue chin were more influenced by genetic factors than other soft tissues.

INTRODUCTION

It is an important clinical issue to determine which craniofacial structures are influenced by genetic factors and cannot be significantly changed by orthodontic and/or orthopedic treatment. Although there have been numerous previous studies regarding the heritability of craniofacial structures, most investigations have focused on the heritability of skeletal tissue and dentition.12345678 A recent paradigm in the orthodontic field is soft tissue-based diagnosis.910 However, there has been a lack of heritability research regarding craniofacial soft tissues that determine actual facial appearance. The methodologies frequently used in craniofacial soft tissue studies include two-dimensional (2D) digital photographs, 2D cephalograms, three-dimensional (3D) scanning, 3D digital stereophotogrammetry, magnetic resonance imaging, computed tomography (CT), and/or ultrasound scans.1112131415161718 However, there are limitations in using “cutting-edge” technology in terms of cost, radiation dosage, and availability of equipment. Therefore, in this study, 2D cephalometric analysis was conducted because of its low cost and ease of use in clinical situations.
In terms of genetic influence on craniofacial structure, Vanco et al.11 suggested that the shape of the nose and lip might be under strong genetic influences. Naini and Moss12 reported that the strongest genetic influence was demonstrated on the triangular area of the midface, which encompasses the lateral orbital rims, intercanthal area, and nose. Similarly, Weinberg et al.16 proposed that the length and width of the central midface exhibited high heritability. To the best of our knowledge, only a single study has been performed regarding the heritability of craniofacial structures in Korean twins and their families. Kim et al.15 performed factor analysis and extracted three factors (lower face portion, orbital region, and vertical length) that demonstrated low-to-moderate heritability. However, there are several considerations that affect interpretation of their study. First, their samples consisted of individuals from 38 families, rather than twins.15 Second, they used 2D digital photographs,15 rather than the cephalometric radiographs that constitute a universal diagnostic tool in the orthodontic field. Third, they only measured linear variables between two landmark points,15 rather than angular and ratio cephalometric variables, which more clearly describe the shape of the craniofacial region.
Therefore, this study was undertaken to investigate the influence of heritability on craniofacial soft tissue cephalometric characteristics of monozygotic (MZ) twins, dizygotic (DZ) twins and their siblings with linear, angular, and ratio cephalometric variables. The null hypotheses were as follows: (1) there was no significant difference in the heritability of craniofacial soft tissue cephalometric characteristics of MZ and DZ twins and their siblings; and (2) there were no significant differences in the heritability of facial profile, facial height, soft tissue thickness, or projection of the nose and lip.

MATERIALS AND METHODS

This retrospective study was performed by using initial samples (553 Korean adult twins and their families) whose lateral cephalometric radiograms were taken at the Samsung Medical Center, Seoul, South Korea. Exclusion criteria were as follows: (1) those who had an edentulous area within the anterior teeth, which could affect facial profile; (2) those who had a removable prosthesis that could affect the vertical dimension of the face; (3) those who had undergone orthodontic treatment, orthognathic surgery, or craniofacial plastic surgery; and (4) those whose age was < 19 years old.19 The twin study protocol was reviewed and approved by the Institutional Review Board, School of Public Health, Seoul National University, Seoul, South Korea (IRB 2005-08-113-027). Informed consent was obtained from all subjects. The final samples consisted of 150 individuals (75 pairs; MZ twins, n = 36 pairs; DZ twins, n = 13 pairs; and siblings [SIB], n = 26 pairs; Table 1). Among the initial samples, sibling pairs were selected from families with MZ or DZ twins. Pairs of DZ twins and SIBs were matched with respect to gender (Table 1). To minimize the age effect, SIB pairs were selected with an age difference of ≤ 5 years (Table 1).
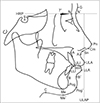
Lateral cephalograms were taken in the natural head position. Landmarks and reference lines used for cephalometric measurement are illustrated in Figures 1 and 2. To investigate which area was significantly affected by heredity, craniofacial soft tissue characteristics were divided into four parts: facial profile, facial height, soft tissue thickness, and projection of the nose and lip. A total of 30 linear, angular, and ratio cephalometric variables were measured to identify the characteristics of the four designated parts. All measurements were performed by a single operator (JMS) with V-Ceph 7.0 program (Cybermed, Seoul, Korea). To verify the reliability of measurement, 20 randomly selected subjects were remeasured by the same operator (JMS) after 4 weeks to calculate intra-correlation, the results of which were valid (p < 0.01). Since there were no significant differences between the first and second measurements, we employed the first set of measurements.

Intraclass correlation coefficient (ICC)

The ICC values of 30 cephalometric variables in the MZ, DZ, and SIB groups were calculated through reliability analysis, as follows.20
ICC = (MSbetween − MSwithin) / (MSbetween + MSwithin)
MSwithin: the mean-square estimates of within-pair variance
MSbetween: the mean-square estimate of between-pair variance
A particular phenotype appears as a sum of genetic and environmental factors. In a narrow sense, heritability (h2) can be defined as the proportion of trait variances influenced by genetic factors, rather than by environmental factors.19 Since MZ twins share identical genes, the genetic effect is equal in MZ twins.19 DZ twins or their siblings of the same gender share half of their genes.19 An estimate of heritability is approximately twice the difference in ICC between MZ and DZ or between MZ and SIB.192021 A higher ICC value indicates higher concordance of variables in the twin pair. Falconer's method was used to calculate heritability192021; it is simple and easy to apply for calculating the heritability of craniofacial variables because it uses the difference in ICC between MZ and DZ or between MZ and SIB.
h2(MZ-DZ) = 2 (ICCMZ − ICCDZ) and h2(MZ-SIB) = 2 (ICCMZ − ICCSIB), where ICCMZ corresponds to ICC of MZ pairs; ICCDZ corresponds to ICC of DZ pairs; and ICCSIB corresponds to ICC of SIB pairs.
h2 values close to or below 0 are regarded as low heritability; h2 values close to or above 1 are regarded as high heritability.192021 In the present study, h2 values < 0.2 were considered low heritability; values > 0.9 were considered high heritability, similar to the criteria of Kim et al.19
Principal components analysis (PCA) is a useful statistical technique to find a pattern in data with a high number of dimensions; it uses an orthogonal transformation to convert a set of observations of possibly correlated variables into a set of values of linearly uncorrelated variables, known as principal components.615162223 In recent years, PCA has been applied to gain a more intuitive understanding of craniofacial variables.615162223 PCA with Kaiser normalization varimax rotation was used to extract factors by grouping 30 cephalometric variables based on statistical correlation (cut-off value, > 1). After the arithmetic means of variable ICC values were calculated as the ICC value of each factor, h2 was calculated to understand the heritability of the craniofacial soft tissues. All statistical analyses were performed by using SPSS with a significance level of 0.05 (IBM SPSS Statistics version 21, IBM Corp., Armonk, NY, USA).

RESULTS

ICC values of MZ, DZ, and SIB groups

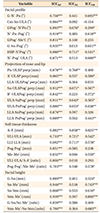
The MZ group exhibited higher ICC values for all cephalometric variables, compared to the DZ and sibling groups (Table 2), which indicates that soft tissue measurements in each pair were most similar in MZ twins, compared to DZ twins and their siblings. In particular, N'-Pn-Pog' (°, 0.919, p < 0.001), G-Sn-Pog' (°, 0.935, p < 0.001), Sn-ULAPog' perp (mm, 0.912, p < 0.001), ULA-SnPog' perp (mm, 0.911, p < 0.001), Sn-Me' (mm, 0.946, p < 0.001), and Stm-Me' (mm, 0.939, p < 0.001) showed high ICC values in the MZ group (Table 2).

Heritability values in h2(MZ-DZ) and h2(MZ-SIB)

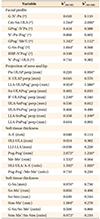
For cephalometric measurements, the highest h2(MZ-DZ) and h2(MZ-SIB) values were observed at the nasolabial angle (Cm-Sn-ULA [°], 1.544 and 2.036), chin angle (GPog'-Me'C [°], 1.342 and 1.112), lower lip to H line (LLA-ULAPog' perp [mm], 0.924 and 1.586), soft tissue chin thickness (Pog-Pog' [mm], 2.872 and 1.226), and upper lip thickness ratio (ULI-ULA/A-A' [ratio], 1.592 and 1.026) (Table 3).

Principal components analysis

PCA derived eight components (Table 4), and its cumulative explanation was 84.5% (Table 5). The components that exhibited higher values of h2(MZ-DZ) and h2(MZ-SIB), compared with other components, were PCA2, which depicts facial convexity, nasolabial angle, and nose projection (1.026 and 0.972, respectively), and PCA7, which depicts chin angle and soft-tissue chin thickness (2.107 and 1.169, respectively) (Table 5).

DISCUSSION

ICC values of MZ, DZ, and SIB groups

High ICC values were found in all cephalometric variables of the craniofacial soft tissue in the MZ group compared to those in the DZ and sibling groups (Table 2). These findings were similar to those of Vanco et al.,11 which suggested that the MZ twins resembled each other to a higher degree than DZ twins, with respect to anterior and vertical aspects of cephalometric measurements.

Heritability values in h2(MZ-DZ) and h2(MZ-SIB)

Nasolabial angle (Cm-Sn-ULA; inclination of the upper lip in relation to the nose) showed high h2(MZ-DZ) and h2(MZ-SIB) values (1.544 and 2.036, Table 3) similar to the findings of Weinberg et al.,16 who reported that the principal component containing the nasolabial angle showed a relatively high degree of heritability. The upper lip thickness variables showed relatively low h2(MZ-DZ) and h2(MZ-SIB) values (A-A'[mm], 0.048 and 0.114; ULI-ULA [mm], 0.024 and 0.382; Table 3), similar to the results of Tsagkrasoulis et al.,24 who suggested a relatively low heritability of the lip area. However, the upper lip thickness ratio (ULI-ULA/A-A', indicating the degree of upper lip strain) and the distance from the lower lip to the H line (LLA-ULAPog' perp, mm) showed high h2(MZ-DZ) and h2(MZ-SIB) values (1.592 and 1.026; 0.924 and 1.586; Table 3). Because the distance from the lower lip to the E-line showed higher h2(MZ-DZ) and h2(MZ-SIB) (LLA-PnPog' perp [mm], 0.654 and 0.892, Table 3) than the distance from the upper lip to the E-line (ULA-PnPog' perp [mm], 0.466 and 0.496, Table 3), lower lip prominence may be more influenced by genetic factors than upper lip prominence. These findings were similar to those of Baydaş et al.,13 who reported moderate heritability in the distance from the lower lip to the E line and low heritability in the distance from the upper lip to the E line (0.53 vs. 0.3). Djordjevic et al.25 also suggested that lower lip prominence, in relation to the chin, was under a dominant genetic influence. The anterior middle one-third of facial height (G-Sn) had a higher h2(MZ-DZ) value than upper lip height (Sn-Stm) (0.976 vs. 0.630; Table 3), which was similar to the findings of Naini and Moss12 and Weinberg et al.16 Taken together, these findings suggested that nose length was under a strong genetic influence. However, this result contrasted with the findings reported by Amini and Borzabadi-Farahani.8
The finding that soft tissue chin thickness showed higher h2(MZ-DZ) and h2(MZ-SIB) values than lower lip thickness (Pog-Pog' [mm], 2.872 and 1.226 vs. LLI-LLA [mm], −0.038 and 0.228; Table 3) was in agreement with the report by Baydaş et al.,13 who described a high degree of heritability of chin thickness in Turkish siblings. Several previous studies demonstrated differences in facial soft tissue thickness according to sex, Angle's classification, and mandibular plane angle.262728 Moreover, Amini and Borzabadi-Farahani8 and Šidlauskas et al.22 reported high heritability in SNB, saddle angle (N-S-Ar), gonial angle (Ar-Go-Me) and mandibular shape (Dc-Xi-Pm, Co-Go-Me, and Ar-Go-Me). Interestingly, the chin angle (GPog'-Me'C, °) showed higher h2(MZ-DZ) and h2(MZ-SIB) values (1.342 and 1.112, Table 3). Because this angle could decrease based on forward and/or downward placement of the chin, the chin angle might be affected by anteroposterior position of the mandible, facial hyper- or hypodivergent pattern, or chin thickness.

Principal components analysis

PCA1 consisted of lip protrusion variables. This finding was similar with the results reported by Djordjevic et al.,25 which extracted lip protrusion variables as first and second factors in scaled and unscaled PCA (heritability; 1.015 and 0.783, respectively). It is important to note that lip protrusion variables, which comprise one of the main issues in orthodontic diagnosis and treatment planning, were extracted as an initial factor in the present study. PCA2 and PCA7, which described facial convexity, nasolabial angle, nose projection, chin angle, and soft tissue chin thickness, exhibited higher values of h2(MZ-DZ) and h2(MZ-SIB) (1.026 and 0.972; 2.107 and 1.169, respectively; Tables 4 and 5). PCA6, including lip thickness variables, showed the lowest values of h2(MZ-DZ) and h2(MZ-SIB) (0.253 and 0.364, Tables 4 and 5). These findings indicate that the shape of facial profile, nose projection, and thickness and shape of the soft tissue chin were more influenced by genetic factors than were lip thickness variables; this was consistent with the results of Djordjevic et al.,25 who suggested that the prominence and height of nose and the prominence of lower lip, in relation to the chin, are dominantly influenced by genetic factors.
The heritability data of the craniofacial soft tissue cephalometric variables obtained from this study could be used as basic guidelines for orthodontic diagnosis and treatment planning and/or prediction of soft tissue changes after completion of growth. However, there are some limitations in this study: First, since this study used a relatively small sample size, it is necessary to increase the number of twins and match the numbers of MZ, DZ, and SIB pairs in future studies. Second, since soft tissue chin was more strongly influenced by genetic factors, further studies are necessary to investigate heritability correlations among chin thickness, mandibular shape, and facial vertical pattern, based on diverse skeletal patterns. Third, since this study was performed with 2D cephalometric radiographs, it is necessary to perform further analysis with 3D-CT or facial scanning. Fourth, since this study investigated heritability in facial soft tissue solely in Korean twins, it is necessary to compare our results with those from twin studies in other populations. Lastly, this study was performed by using a cross-sectional study design, and the mean age of samples was 39.8 years (Table 1). Therefore, to observe the effect of aging on changes in craniofacial soft tissue, a longitudinal follow-up study is necessary.

CONCLUSION

  • The first hypothesis, that there was no significant difference in the heritability of craniofacial soft tissue cephalometric characteristics of MZ twins, DZ twins and their siblings, was rejected. Soft tissue measurements in each pair were most similar between MZ twins, compared to DZ twins and their siblings.

  • The second hypothesis, that there was no significant difference in the heritability of facial profile, facial height, soft tissue thickness, and projection of the nose and lip, was rejected. The nose and soft tissue chin were more strongly influenced by genetic factors, compared to other soft tissues.

Figures and Tables

Figure 1

Landmarks and reference planes used in the cephalometric analysis. S, Sella; N, nasion; A, A point; B, B point; Pog, pogonion; Me, menton; G, glabella; N', soft tissue nasion; Pn, pronasale; Cm, columella; Sn, subnasale; A', soft tissue A point; ULA, upper lip anterior; Stm, stomion; ULI, upper lip inside; LLI, lower lip inside; LLA, lower lip anterior; B', soft tissue B point; Pog', soft tissue pogonion; Me', soft tissue menton; C, cervical point; HRP, horizontal reference plane, a horizontal plane angulated 7° clockwise to the SN line passing through Sella; ULAP, ULA perpendicular plane to HRP, a perpendicular line to the HRP passing through ULA.

kjod-49-3-g001
Figure 2

Cephalometric variables.

Facial profile: 1, G-N'-Pn (angle determined by points G, N', and Pn); 2, Cm-Sn-ULA (angle determined by points Cm, Sn, and ULA); 3, GPog'-N'Pn (angle formed by G-Pog' and N'-Pn lines); 4, N'-Pn-Pog' (angle determined by points N', Pn and Pog'); 5, GPog'-Me'C (angle formed by G-Pog' and Me'C lines); 6, G-Sn-Pog' (angle determined by points G, Sn, and Pog'); 7, HRP-N'Pog' (angle formed by HRP and N'Pog' lines); 8, N'-Pog'-ULA (angle determined by points N', Pog' and ULA'). Projection of nose and lip: 9, Pn-ULAP perp (perpendicular distance from point Pn to ULAP in mm); 10, A'-ULAP perp (perpendicular distance from point A' to ULAP in mm); 11, LLA-ULAPog' perp (perpendicular distance from point LLA to ULA-Pog' line in mm); 12, Sn-ULAPog' perp (perpendicular distance from point Sn to ULA-Pog' line in mm); 13, B'-ULAPog' perp (perpendicular distance from point B' to ULA-Pog' line in mm); 14, ULA-SnPog' perp (perpendicular distance from point ULA to Sn-Pog' line in mm); 15, LLA-SnPog' perp (perpendicular distance from point LLA to Sn-Pog' line in mm); 16, ULA-PnPog' perp (perpendicular distance from point ULA to Pn-Pog' line in mm); 17, LLA-PnPog' perp (perpendicular distance from point LLA to Pn-Pog' line in mm). Soft tissue thickness: 18, A-A' (distance between points A and A' in mm); 19, ULI-ULA (distance between points ULI and ULA in mm); 20, LLI-LLA (distance between points LLI and LLA in mm); 21, Pog-Pog' (distance between points Pog and Pog' in mm); 22, Me-Me' (distance between points Me and Me' in mm); 23, ULI-ULA/A-A' (the ratio of the distance between points ULI and ULA to the distance between points A and A'); 24, Pog-Pog'/Me-Me' (ratio of the distance between points Pog and Pog' to the distance between points Me and Me'). Facial height: 25, G-Sn (vertical height between point G and Sn in mm); 26, Sn-Me' (vertical height between point Sn and Me' in mm); 27, Sn-Stm (vertical height between point Sn and Stm in mm); 28, Stm-Me' (vertical height between point Stm and Me' in mm); 29, G-Sn/Sn-Me' (ratio of the distance between points G and Sn to the distance between points Sn and Me'); 30, Stm-Me'/Sn-Stm (ratio of the distance between points Stm and Me' to the distance between points Sn and Stm).
See Figure 1 for definition of each landmark.
kjod-49-3-g002
Table 1

Demographic characteristics of the samples

kjod-49-3-i001

Values are presented as number (%) or mean ± standard deviation (range).

MZ, Monozygotic twin; DZ, dizygotic twin; SIB, sibling.

Table 2

Intraclass correlation coefficients (ICCs) in the monozygotic (MZ), dizygotic (DZ), and sibling (SIB) groups

kjod-49-3-i002

ICCs are positive and large when variation within the pairs is much lesser than variation between the pairs.

*p < 0.05, **p < 0.01; ***p < 0.001.

See Figures 1 and 2 for definitions of each landmark or measurement.

Table 3

Heritability values in h2(MZ-DZ) and h2(MZ-SIB)

kjod-49-3-i003

h2, Heritability; MZ, monozygotic twin; DZ, dizygotic twin; SIB, sibling; MZ-DZ, difference between MZ and DZ; MZ-SIB, difference between MZ and SIB; h2(MZ-DZ), 2 (ICCMZ − ICCDZ); h2(MZ-SIB), 2 (ICCMZ − ICCSIB).

*h2 values > 0.9 were considered high heritability.

See Figures 1 and 2 for definitions of each landmark or measurement.

Table 4

Principal components analysis (PCA) after varimax rotation

kjod-49-3-i004

perp, Perpendicular.

See Figures 1 and 2 for definitions of each landmark or measurement.

Table 5

Intraclass correlation coefficients (ICCs) and heritability (h2) for each of the principal components analysis (PCA)

kjod-49-3-i005

MZ, Monozygotic twin; DZ, dizygotic twin; SIB, sibling; h2(MZ-DZ), 2 (ICCMZ − ICCDZ); h2(MZ-SIB), 2 (ICCMZ − ICCSIB).

*h2 values > 0.9 were considered high heritability.

Notes

How to cite this article Song J, Chae HS, Shin JW, Sung J, Song YM, Baek SH, Kim YH. Influence of heritability on craniofacial soft tissue characteristics of monozygotic twins, dizygotic twins, and their siblings using Falconer's method and principal components analysis. Korean J Orthod 2019;49:3-11.

CONFLICTS OF INTEREST No potential conflict of interest relevant to this article was reported.

References

1. Hunter WS. A study of the inheritance of craniofacial characteristics as seen in lateral cephalograms of 72 like-sexed twins. Rep Congr Eur Orthod Soc. 1965; 41:59–70.
pmid
2. Nakata N, Yu PI, Davis B, Nance WE. The use of genetic data in the prediction of craniofacial dimensions. Am J Orthod. 1973; 63:471–480.
crossref pmid
3. Nakasima A, Ichinose M, Nakata S, Takahama Y. Hereditary factors in the craniofacial morphology of Angle's Class II and Class III malocclusions. Am J Orthod. 1982; 82:150–156.
crossref pmid
4. Manfredi C, Martina R, Grossi GB, Giuliani M. Heritability of 39 orthodontic cephalometric parameters on MZ, DZ twins and MN-paired singletons. Am J Orthod Dentofacial Orthop. 1997; 111:44–51.
crossref pmid
5. Savoye I, Loos R, Carels C, Derom C, Vlietinck R. A genetic study of anteroposterior and vertical facial proportions using model-fitting. Angle Orthod. 1998; 68:467–470.
pmid
6. Carels C, Van Cauwenberghe N, Savoye I, Willems G, Loos R, Derom C, et al. A quantitative genetic study of cephalometric variables in twins. Clin Orthod Res. 2001; 4:130–140.
crossref pmid
7. Johannsdottir B, Thorarinsson F, Thordarson A, Magnusson TE. Heritability of craniofacial characteristics between parents and offspring estimated from lateral cephalograms. Am J Orthod Dentofacial Orthop. 2005; 127:200–207. quiz 260-1.
crossref pmid
8. Amini F, Borzabadi-Farahani A. Heritability of dental and skeletal cephalometric variables in monozygous and dizygous Iranian twins. Orthod Waves. 2009; 68:72–79.
crossref
9. Ackerman JL, Proffit WR. Soft tissue limitations in orthodontics: treatment planning guidelines. Angle Orthod. 1997; 67:327–336.
pmid
10. Terajima M, Furuichi Y, Aoki Y, Goto TK, Tokumori K, Nakasima A. A 3-dimensional method for analyzing facial soft-tissue morphology of patients with jaw deformities. Am J Orthod Dentofacial Orthop. 2009; 135:715–722.
crossref pmid
11. Vanco C, Kasai K, Sergi R, Richards LC, Townsend GC. Genetic and environmental influences on facial profile. Aust Dent J. 1995; 40:104–109.
crossref pmid
12. Naini FB, Moss JP. Three-dimensional assessment of the relative contribution of genetics and environment to various facial parameters with the twin method. Am J Orthod Dentofacial Orthop. 2004; 126:655–665.
crossref pmid
13. Baydaş B, Erdem A, Yavuz I, Ceylan I. Heritability of facial proportions and soft-tissue profile characteristics in Turkish Anatolian siblings. Am J Orthod Dentofacial Orthop. 2007; 131:504–509.
crossref pmid
14. Sipahioğlu S, Ulubay H, Diren HB. Midline facial soft tissue thickness database of Turkish population: MRI study. Forensic Sci Int. 2012; 219:282.e1–282.e8.
crossref
15. Kim HJ, Im SW, Jargal G, Lee S, Yi JH, Park JY, et al. Heritabilities of facial measurements and their latent factors in Korean families. Genomics Inform. 2013; 11:83–92.
crossref pmid pmc
16. Weinberg SM, Parsons TE, Marazita ML, Maher BS. Heritability of face shape in twins: a preliminary study using 3D stereophotogrammetry and geometric morphometrics. Dent 3000. 2013; 1:14.
crossref pmid pmc
17. Baillie LJ, Mirijali SA, Niven BE, Blyth P, Dias GJ. Ancestry and BMI influences on facial soft tissue depths for a cohort of Chinese and caucasoid women in Dunedin, New Zealand. J Forensic Sci. 2015; 60:1146–1154.
crossref pmid
18. Thiemann N, Keil V, Roy U. In vivo facial soft tissue depths of a modern adult population from Germany. Int J Legal Med. 2017; 131:1455–1488.
crossref pmid
19. Kim E, Sung J, Song YM, Chae HS, Mo SS, Kim YH, et al. Heritability of facial skeletal and dental characteristics of monozygotic and dizygotic twins using cephalometric analysis and Falconer's method. J Craniofac Surg. 2018; 29:e274–e279.
crossref
20. Shrout PE, Fleiss JL. Intraclass correlations: uses in assessing rater reliability. Psychol Bull. 1979; 86:420–428.
crossref pmid
21. Falconer DS. Introduction to quantitative genetics. 1st ed. New Jersey: Prentice Hall Press;1975.
22. Šidlauskas M, Šalomskienė L, Andriuškevičiūtė I, Šidlauskienė M, Labanauskas Ž, Vasiliauskas A, et al. Heritability of mandibular cephalometric variables in twins with completed craniofacial growth. Eur J Orthod. 2016; 38:493–502.
crossref pmid
23. Mayer C, Windhager S, Schaefer K, Mitteroecker P. BMI and WHR are reflected in female facial shape and texture: a geometric morphometric image analysis. PLoS One. 2017; 12:e0169336.
crossref
24. Tsagkrasoulis D, Hysi P, Spector T, Montana G. Heritability maps of human face morphology through large-scale automated three-dimensional phenotyping. Sci Rep. 2017; 7:45885.
crossref
25. Djordjevic J, Zhurov AI, Richmond S. Visigen Consortium. Genetic and environmental contributions to facial morphological variation: A 3D population-based twin study. PLoS One. 2016; 11:e0162250.
crossref
26. Macari AT, Hanna AE. Comparisons of soft tissue chin thickness in adult patients with various mandibular divergence patterns. Angle Orthod. 2014; 84:708–714.
crossref pmid
27. Somaiah S, Khan MU, Muddaiah S, Shetty B, Reddy G, Siddegowda R. Comparison of soft tissue chin thickness in adult patients with various mandibular divergence patterns in Kodava population. Int J Orthod Rehabil. 2017; 8:51–56.
crossref
28. Kurkcuoglu A, Pelin C, Ozener B, Zagyapan R, Sahinoglu Z, Yazici AC. Facial soft tissue thickness in individuals with different occlusion patterns in adult Turkish subjects. Homo. 2011; 62:288–297.
crossref pmid
TOOLS
ORCID iDs

Jeongmin Song
https://orcid.org/0000-0002-5034-5256

Young Ho Kim
https://orcid.org/0000-0002-4284-1874

Similar articles