Journal List > J Korean Med Sci > v.33(51) > 1109204

Kim, Chung, Hwang, Jung, Kwon, Hwang, Bae, Park, Jeong, Kwak, Song, Seo, Byun, Hong, and Chung: Efficacy of First-Line Targeted Therapy in Real-World Korean Patients with Metastatic Renal Cell Carcinoma: Focus on Sunitinib and Pazopanib

Abstract

Background

To evaluate survival outcomes and prognostic factors for overall survival (OS) in patients with metastatic renal cell carcinoma (mRCC) who received sunitinib (SU) and pazopanib (PZ) as first-line therapy in real-world Korean clinical practice.

Methods

Data of 554 patients with mRCC who received SU or PZ at eight institutions between 2012 and 2016 were retrospectively reviewed. Based on the targeted therapy, the patients were divided into SU (n = 293) or PZ (n = 261) groups, and the clinicopathological variables and survival rates of the two groups were compared. A multivariable Cox proportional hazard model was used to determine the prognostic factors for OS.

Results

The median follow-up was 16.4 months (interquartile range, 8.3–31.3). Patients in the PZ group were older, and no significant difference was observed in the performance status (PS) between the two groups. In the SU group, the dose reduction rate was higher and the incidence of grade 3 toxicity was more frequent. The objective response rates were comparable between the two groups (SU, 32.1% vs. PZ, 36.4%). OS did not differ significantly between the two groups (SU, 36.5 months vs. PZ, 40.2 months; log-rank, P = 0.955). Body mass index, Eastern Cooperative Oncology Group PS > 2, synchronous metastasis, poor Heng risk criteria, and liver and bone metastases were associated with a shorter OS.

Conclusion

Our real-world data of Korean patients with mRCC suggested that SU and PZ had similar efficacies as first-line therapy for mRCC. However, PZ was better tolerated than SU in Korean patients.

Graphical Abstract

jkms-33-e325-abf001.jpg

INTRODUCTION

Renal cell carcinoma (RCC) represents nearly 90% of the primary neoplasms of the kidney and approximately 80% of RCCs are classified as the clear cell subtype.12 Up to 30% of affected patients are initially diagnosed with metastatic disease.3
Since the late 1990s, the early detection of RCC by the widespread use of imaging modalities and improvements in surgical and medical treatment have decreased the mortality rate of RCC.4 In addition, compared with cytokines, the emergence of targeted therapies, including tyrosine kinase inhibitors (TKIs) and mammalian target of rapamycin, have prolonged the overall survival (OS) of patients with metastatic RCC (mRCC).5
Current guidelines suggest the use of sunitinib (SU), pazopanib (PZ), or bevacizumab with interferon as a first-line treatment for favorable or intermediate-risk patients with predominantly clear cell histology.67 SU and PZ have been widely used for a relatively long time as the first-line treatment for mRCC. In a large randomized controlled trial (RCT) comparing the two drugs, PZ was not inferior to SU, and fewer adverse events were reported.89 However, studies comparing the efficacy and safety of both the drugs in real-world clinical practice are not sufficient.
Since the introduction of the first TKI treatment in 2005, improvement in treatment outcomes has been reported in the late treatment group compared to the early treatment group.10 The understanding of and experience with TKI drugs in the late treatment group has led to better clinical results. In addition, the clinical environment differs from the RCT environment; analysis of real-world data could complement structured studies, such as RCTs, and improve clinical outcomes and patient experience.
Based on these considerations, this multicenter retrospective study evaluated the survival outcomes and prognostic factors for OS in Korean patients with mRCC who received first-line TKI therapy.

METHODS

Study design and patients

We retrospectively retrieved the clinical and pathological data of 1,121 individuals with mRCC treated with first-line systemic TKI therapy from a prospectively managed multicenter database in Korea. Among them, data of 554 patients with mRCC treated with SU (n = 293) or PZ (n = 261) as first-line TKI therapy between January 2012 and November 2016 were retrospectively reviewed. The choice of the TKI agent was at the discretion of the treating physician. Each drug was administered at a standard dose (SU, 50 mg daily for 4 weeks, followed by 2 weeks off drug per treatment cycle; PZ, 800 mg daily continuously). Depending on the severity of the side effects, dose reduction for PZ and SU was determined. Treatment was continued until Response Evaluation Criteria In Solid Tumors (RECIST)-defined disease progression, development of unacceptable toxic effects, or death. Clinical responses were assessed according to the RECIST with computed tomography or magnetic resonance imaging. OS was defined as the interval from the date of the first-line targeted therapy initiation to the date of death from any cause. If patients did not experience death, the OS time period ceased at the time of the last follow-up. Progression-free survival (PFS) was defined as the time from the first day of treatment to the time of disease progression.

Statistical analysis

The χ2 or Mann-Whitney U tests were performed for comparison of categorical and continuous variables, respectively, between the two groups. PFS and OS were analyzed using Kaplan-Meier methods and log-rank tests. Univariate and multivariate Cox proportional hazards regression analyses were performed to assess the association between baseline parameters and PFS or OS. All P values correspond to two-sided tests, with P values of < 0.05 considered statistically significant. All statistical analyses were conducted using IBM SPSS statistics for Windows, version 23.0 (IBM Corp., Armonk, NY, USA).

Ethics statement

This study was approved by the Institutional Review Board (IRB) at each participating center (Chonnam National University Hwasun Hospital, IRB No. CNUHH-EXP-2018-058).

RESULTS

Patient and disease characteristics

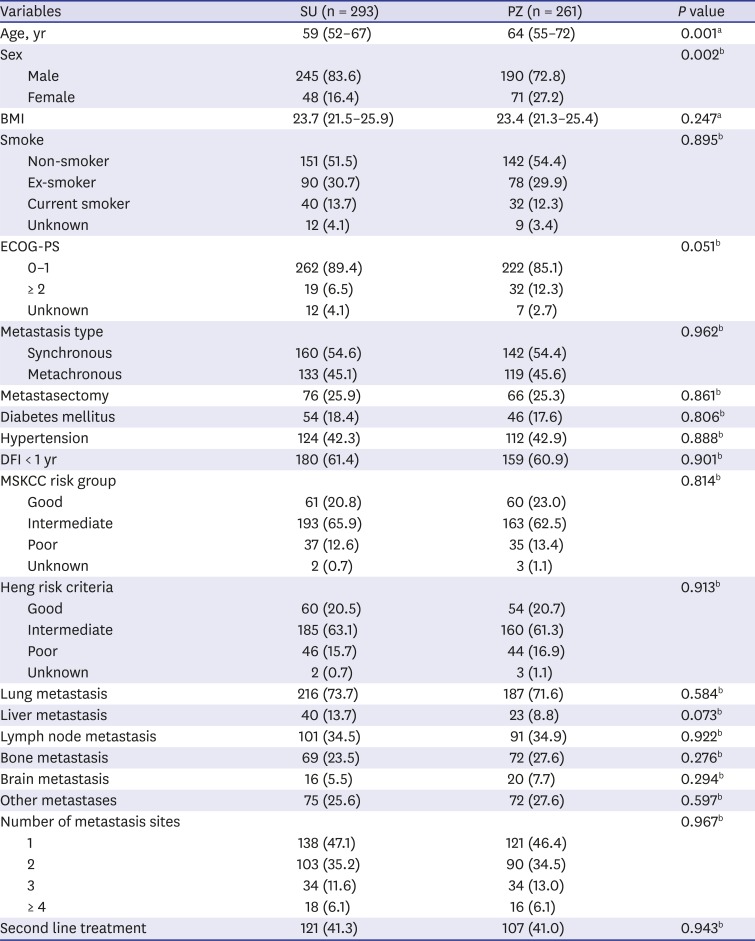
The baseline demographic and clinical characteristics are summarized in Table 1. The median age was 61 years (range, 53–70 years). Most of the patients were men (435 patients, 78.1%) with an Eastern Cooperative Oncology Group performance status (ECOG-PS) of 0 or 1 (484 patients, 87.1%). A total of 252 patients (45.4%) underwent prior nephrectomy and 142 patients (25.6%) underwent metastasectomy. After a median follow-up of 16.4 months (95% confidence interval [CI], 14.7–17.8; interquartile range [IQR], 8.3–31.3), 314 patients (56.7%) had disease progression and 187 patients (33.8%) died. Comparison of the demographic and clinical features between the two groups revealed that the PZ group comprised older patients (64 vs. 59 years; P = 0.001) and had a significantly higher percentage of women (27.2% vs. 16.4%; P = 0.002). With respect to the Memorial Sloan-Kettering Cancer Center and Heng risk criteria, no statistical difference between the two groups was found, and the majority of the patients had intermediate-risk disease (65.9% and 63.1% in the SU group vs. 62.5% and 61.3% in the PZ group; P = 0.814 and P = 0.914, respectively). In addition, use of 2nd line therapy after disease progression were also similar between the two groups (41.3% in the SU group vs. 41.0% in the PZ group; P = 0.943).
Table 1

Baseline characteristics

jkms-33-e325-i001
Variables SU (n = 293) PZ (n = 261) P value
Age, yr 59 (52–67) 64 (55–72) 0.001a
Sex 0.002b
Male 245 (83.6) 190 (72.8)
Female 48 (16.4) 71 (27.2)
BMI 23.7 (21.5–25.9) 23.4 (21.3–25.4) 0.247a
Smoke 0.895b
Non-smoker 151 (51.5) 142 (54.4)
Ex-smoker 90 (30.7) 78 (29.9)
Current smoker 40 (13.7) 32 (12.3)
Unknown 12 (4.1) 9 (3.4)
ECOG-PS 0.051b
0–1 262 (89.4) 222 (85.1)
≥ 2 19 (6.5) 32 (12.3)
Unknown 12 (4.1) 7 (2.7)
Metastasis type 0.962b
Synchronous 160 (54.6) 142 (54.4)
Metachronous 133 (45.1) 119 (45.6)
Metastasectomy 76 (25.9) 66 (25.3) 0.861b
Diabetes mellitus 54 (18.4) 46 (17.6) 0.806b
Hypertension 124 (42.3) 112 (42.9) 0.888b
DFI < 1 yr 180 (61.4) 159 (60.9) 0.901b
MSKCC risk group 0.814b
Good 61 (20.8) 60 (23.0)
Intermediate 193 (65.9) 163 (62.5)
Poor 37 (12.6) 35 (13.4)
Unknown 2 (0.7) 3 (1.1)
Heng risk criteria 0.913b
Good 60 (20.5) 54 (20.7)
Intermediate 185 (63.1) 160 (61.3)
Poor 46 (15.7) 44 (16.9)
Unknown 2 (0.7) 3 (1.1)
Lung metastasis 216 (73.7) 187 (71.6) 0.584b
Liver metastasis 40 (13.7) 23 (8.8) 0.073b
Lymph node metastasis 101 (34.5) 91 (34.9) 0.922b
Bone metastasis 69 (23.5) 72 (27.6) 0.276b
Brain metastasis 16 (5.5) 20 (7.7) 0.294b
Other metastases 75 (25.6) 72 (27.6) 0.597b
Number of metastasis sites 0.967b
1 138 (47.1) 121 (46.4)
2 103 (35.2) 90 (34.5)
3 34 (11.6) 34 (13.0)
≥ 4 18 (6.1) 16 (6.1)
Second line treatment 121 (41.3) 107 (41.0) 0.943b
Values are presented as median (interquartile range) or number (%).
SU = sunitinib, PZ = pazopanib, BMI = body mass index, ECOG-PS = Eastern Cooperative Oncology Group performance status, DFI = disease-free interval, MSKCC = Memorial Sloan Kettering Cancer Center.
aThe Mann-Whitney U test; bThe χ2 test.

Treatment efficacy

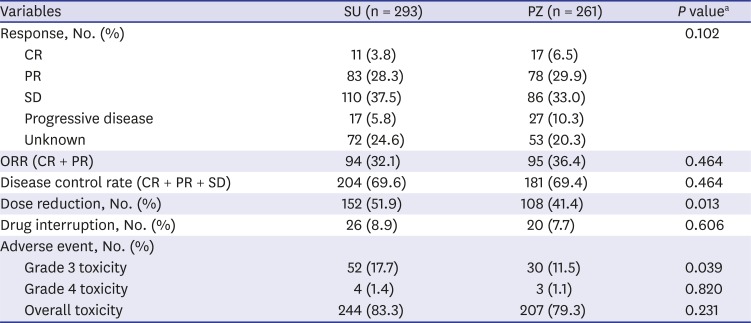
Complete responses were observed in 17 patients in the PZ group (6.5%) and in 11 in the SU group (3.8%). Partial responses (PRs) were observed in 78 patients in the PZ group (29.9%) and in 83 in the SU group (28.3%). Complete and PR patients had favorable Heng risk, more metachronous metastasis, more metastasectomy, longer disease-free interval, more lung metastasis, less bone metastasis and less disease burden (number of metastasis sites < 4) compared with stable and progressive disease patients (all P < 0.05, Supplementary Table 1).
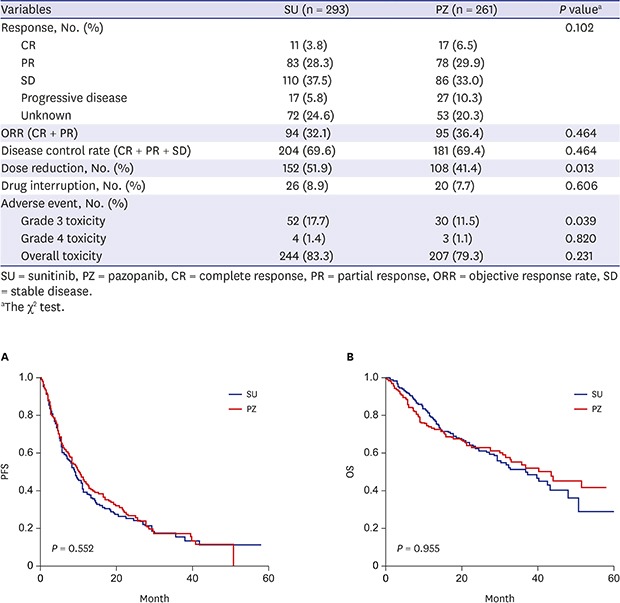
The objective response rates (ORRs) (PZ, 36.4% vs. SU, 32.1%) and disease control rates (PZ, 69.4% vs. SU, 69.6%) did not differ between the SU and PZ groups (P = 0.464). The overall toxicity was also comparable between the groups (P = 0.231). However, grade 3 toxicity was lower in patients treated with first-line PZ compared to those treated with SU (11.5% vs. 17.7%; P = 0.039). Dose reduction occurred more frequently in the SU group than in the PZ group (51.9% vs. 41.4%; P = 0.013); however, there was no difference in drug interruption between the two groups (SU, 8.9% vs. PZ, 7.7%; P = 0.606) (Table 2).
Table 2

Response rates and adverse events

jkms-33-e325-i002
Variables SU (n = 293) PZ (n = 261) P valuea
Response, No. (%) 0.102
CR 11 (3.8) 17 (6.5)
PR 83 (28.3) 78 (29.9)
SD 110 (37.5) 86 (33.0)
Progressive disease 17 (5.8) 27 (10.3)
Unknown 72 (24.6) 53 (20.3)
ORR (CR + PR) 94 (32.1) 95 (36.4) 0.464
Disease control rate (CR + PR + SD) 204 (69.6) 181 (69.4) 0.464
Dose reduction, No. (%) 152 (51.9) 108 (41.4) 0.013
Drug interruption, No. (%) 26 (8.9) 20 (7.7) 0.606
Adverse event, No. (%)
Grade 3 toxicity 52 (17.7) 30 (11.5) 0.039
Grade 4 toxicity 4 (1.4) 3 (1.1) 0.820
Overall toxicity 244 (83.3) 207 (79.3) 0.231
SU = sunitinib, PZ = pazopanib, CR = complete response, PR = partial response, ORR = objective response rate, SD = stable disease.
aThe χ2 test.

Oncologic outcomes and prognostic factors

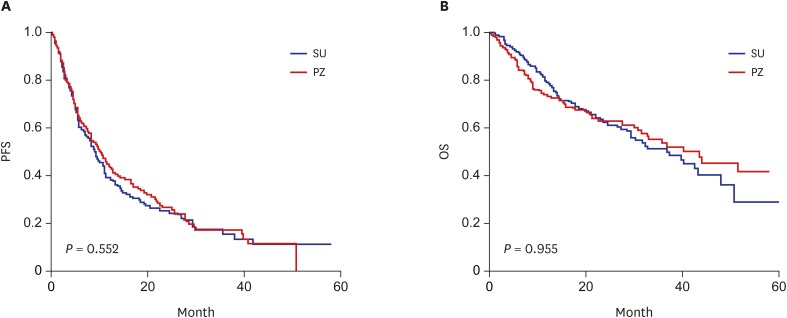
The PFS for SU was 9.0 months (95% CI, 7.3–10.9) and that for PZ was 10.1 months (95% CI, 8.3–12.4; log-rank test, P = 0.552) (Fig. 1A). The median OS was 40.2 months in the PZ group (95% CI, 31.3–51.2) and 36.5 months in the SU group (95% CI, 29.0–47.9), with no difference between the two groups with respect to OS (log-rank test, P = 0.955) (Fig. 1B). In addition, the use of 2nd line therapy after disease progression in each treatment and with or without dose reduction within and across treatment did not differ on OS (Supplementary Fig. 1).
Fig. 1

Kaplan-Meier analysis of OS and PFS stratified by targeted therapy. (A) PFS. SU 9.0 months (95% CI, 7.3–10.9) vs. PZ 10.1 months (95% CI, 8.3–12.4); P = 0.552 (log-rank test). (B) OS. SU 36.5 months (95% CI, 29.0–47.9) vs. PZ 40.2 months (95% CI, 31.3–51.2); P = 0.955 (log-rank test).

OS = overall survival, PFS = progression-free survival, SU = sunitinib, CI = confidence interval, PZ = pazopanib.
jkms-33-e325-g001
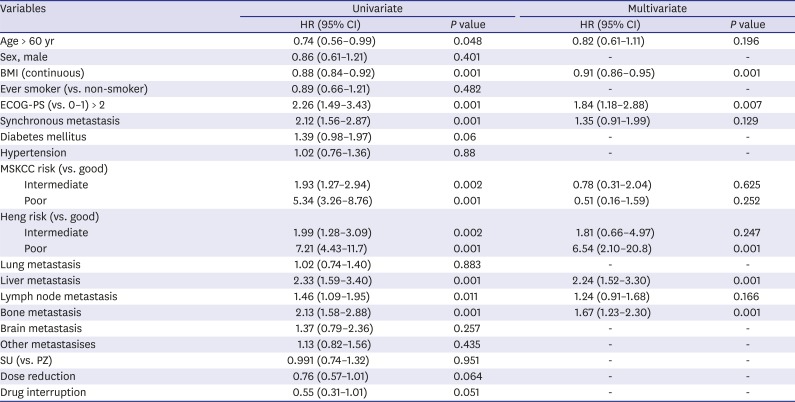
Univariable and multivariable Cox regression analyses of the prognostic factors for OS among patients with mRCC treated with SU and PZ are shown in Table 3. The results of multivariate analysis indicated that the prognostic factors associated with a significantly shorter OS included a lower body mass index (BMI) (hazard ratio [HR], 0.91; 95% CI, 0.86–0.95), ECOG-PS of 2 or higher (HR, 1.84; 95% CI, 1.18–2.88), and poor Heng risk criteria (HR, 6.54; 95% CI, 2.10–20.8). Metastases in the liver (HR, 2.24; 95% CI, 1.52–3.30) and bone (HR, 1.67; 95% CI, 1.23–2.30) were also associated with a significantly shorter OS.
Table 3

Prognostic factors for OS among patients treated with SU and PZ

jkms-33-e325-i003
Variables Univariate Multivariate
HR (95% CI) P value HR (95% CI) P value
Age > 60 yr 0.74 (0.56–0.99) 0.048 0.82 (0.61–1.11) 0.196
Sex, male 0.86 (0.61–1.21) 0.401 - -
BMI (continuous) 0.88 (0.84–0.92) 0.001 0.91 (0.86–0.95) 0.001
Ever smoker (vs. non-smoker) 0.89 (0.66–1.21) 0.482 - -
ECOG-PS (vs. 0–1) > 2 2.26 (1.49–3.43) 0.001 1.84 (1.18–2.88) 0.007
Synchronous metastasis 2.12 (1.56–2.87) 0.001 1.35 (0.91–1.99) 0.129
Diabetes mellitus 1.39 (0.98–1.97) 0.06 - -
Hypertension 1.02 (0.76–1.36) 0.88 - -
MSKCC risk (vs. good)
Intermediate 1.93 (1.27–2.94) 0.002 0.78 (0.31–2.04) 0.625
Poor 5.34 (3.26–8.76) 0.001 0.51 (0.16–1.59) 0.252
Heng risk (vs. good)
Intermediate 1.99 (1.28–3.09) 0.002 1.81 (0.66–4.97) 0.247
Poor 7.21 (4.43–11.7) 0.001 6.54 (2.10–20.8) 0.001
Lung metastasis 1.02 (0.74–1.40) 0.883 - -
Liver metastasis 2.33 (1.59–3.40) 0.001 2.24 (1.52–3.30) 0.001
Lymph node metastasis 1.46 (1.09–1.95) 0.011 1.24 (0.91–1.68) 0.166
Bone metastasis 2.13 (1.58–2.88) 0.001 1.67 (1.23–2.30) 0.001
Brain metastasis 1.37 (0.79–2.36) 0.257 - -
Other metastases 1.13 (0.82–1.56) 0.435 - -
SU (vs. PZ) 0.991 (0.74–1.32) 0.951 - -
Dose reduction 0.76 (0.57–1.01) 0.064 - -
Drug interruption 0.55 (0.31–1.01) 0.051 - -
OS = overall survival, SU = sunitinib, PZ = pazopanib, HR = hazard ratio, CI = confidence interval, BMI = body mass index, ECOG-PS = Eastern Cooperative Oncology Group performance status, MSKCC = Memorial Sloan Kettering Cancer Center.

DISCUSSION

The results of our study indicate that although dose reduction was more frequent in the SU group than in the PZ group, both SU and PZ had similar efficacy as the first-line treatment for Korean patients with mRCC. Lower BMI, ECOG-PS > 2, synchronous metastasis, poor Heng risk criteria, and liver and bone metastases were associated with a shorter OS.
Although both SU and PZ are approved as the first-line treatment of mRCC, the efficacy and safety of the two drugs remain unclear. Previously, the COMPARZ study showed that PZ is not inferior to SU with respect to PFS.89
In the PISCES study, 70% of patients who had experienced both drugs preferred PZ compared to only 22% who preferred SU.11 Recently, a large retrospective study by the International Metastatic RCC Database Consortium confirmed in real-world practice that SU and PZ showed similar efficacy as the first-line setting for mRCC and that they did not affect oncologic outcomes with subsequent second-line treatment.12 Consistent with previous studies, there was no significant difference in OS between the SU and PZ groups in the present study.81112
In a retrospective comparison of ethnicity with respect to tolerability, the side effects of SU were reportedly higher in Asian patients than in those of other ethnicities. Inter-ethnic pharmacokinetic and pharmacogenomics differences could account for the variation in tolerability and are still under study.131415 In our results, the incidence of grade 3 adverse events and drug reduction was significantly lower in patients treated with PZ than in patients treated with SU. The proportion of elderly and female patients was higher in the PZ group, which implies that clinicians preferred PZ for patients expected to have a relatively low tolerance. Although, regardless of treatment, actual adverse events did not differ between young and old ages, male patients had more overall adverse events compared to female patients (Supplementary Table 2).
However, the relatively low tolerability of SU may be attributed to the fixed dose and schedule regimen. Several recent studies have shown improved clinical results of tolerability in patients receiving a modified SU schedule and dose.16171819202122 The RESTORE trial showed better SU tolerability in patients using a new 2/1 schedule compared to those using the 4/2 schedule.18 The study was conducted on 74 Korean patients and did not find any significant differences in ORR and PFS between the 4/2 and 2/1 schedules. A Chinese study of 108 patients with mRCC and three different SU treatment schedules reported a longer PFS and tolerability in the group receiving the 2/1 schedule compared to that in the other groups.17 Furthermore, Lalani et al.16 reported similar results in patients with mRCC treated with an individualized SU dose and schedule compared to those treated with the standard dose. Because our study included patients treated with the standard SU treatment, future studies are necessary to compare patients treated with a modified SU treatment such as the 2/1 schedule and those treated with PZ. In clinical practice, schedule and dose optimization of drugs are important to maximize the therapeutic efficacy and safety.
Albiges et al.23 reported that patients with BMI of ≥ 25 kg/m2 had longer OS than those with BMI of < 25 kg/m2 (HR, 0.83; 95% CI, 0.73–0.95). They showed that the expression of fatty acid metabolism-related genes was relatively low in patients with high BMI, and these patients showed a higher survival rate than patients with normal BMI. In our study, high BMI was one of the prognostic factors that positively affected the OS (HR, 0.88; 95% CI, 0.6–0.9; P = 0.001). Most of the patients in both groups had BMI < 25 kg/m2, but the trend of BMI for OS was consistent with that in previous studies.
In addition, our results showed that bone and liver metastases were negative prognostic factors for OS in patients with mRCC. These prognostic factors are consistent with those reported in previous studies2425; however, the rationale for the poor clinical outcome of patients with bone or liver metastasis is unclear.2627
The strengths of the present study include the clinical outcomes among Asian patients in the latest TKI treatment era. A retrospective study of the Surveillance, Epidemiology, and End Results-Medicare database found that patients treated in the late targeted therapy era (2010–2012) had a longer OS than those treated in the early targeted therapy era (2006–2009).10 The authors suggested that the increased physician facility for TKI therapy affected the outcome. Their results support the advantages of our study, including patient care by clinicians with TKI treatment experience.
With its retrospective research design, the present study has several limitations. As previously stated, the choice of the TKI treatment was at the discretion of the treating clinician. Also, our study included only patients treated with the standard treatment schedule of SU, which could have affected tolerability in the SU group. We did not undertake a detailed analysis of adverse events but provided the frequency of moderate-grade toxicity that affected the sequence of treatment. The inherent limitations of multicenter studies include inconsistencies in clinical practice and examination. However, these variations reflect the real-world clinical experiences of physicians and patients.
In summary, our results demonstrated that although patients with mRCC treated with SU showed more frequent dose reduction than those treated with PZ, the efficacy of the two drugs was similar. Poor OS was associated with lower BMI, poor PS, poor Heng risk criteria, liver metastasis, and bone metastasis. Further research is needed to identify factors for individualized drug selection to optimize treatment efficacy and safety.

Notes

Funding: This study was supported by a grant (grant No. HCRI 18 003-1) from Chonnam National University Hwasun Hospital, Institute for Biomedical Science.

Disclosure: The authors have no potential conflicts of interest to disclose.

Author Contributions:

  • Conceptualization: Hwang EC, Hwang JE.

  • Data curation: Hwang EC, Hwang JE.

  • Formal analysis: Hwang EC, Hwang JE.

  • Funding acquisition: Kim MS.

  • Methodology: Hwang EC, Hwang JE.

  • Writing - original draft: Kim MS, Chung HS.

  • Writing - review & editing: Hwang EC, Jung SI, Kwon DD, Hwang JE, Bae WK, Park JY, Jeong CW, Kwak C, Song C, Seo SI, Byun SS, Hong SH, Chung J.

References

1. Leibovich BC, Lohse CM, Crispen PL, Boorjian SA, Thompson RH, Blute ML, et al. Histological subtype is an independent predictor of outcome for patients with renal cell carcinoma. J Urol. 2010; 183(4):1309–1315. PMID: 20171681.
crossref
2. Moch H, Gasser T, Amin MB, Torhorst J, Sauter G, Mihatsch MJ. Prognostic utility of the recently recommended histologic classification and revised TNM staging system of renal cell carcinoma: a Swiss experience with 588 tumors. Cancer. 2000; 89(3):604–614. PMID: 10931460.
3. Janzen NK, Kim HL, Figlin RA, Belldegrun AS. Surveillance after radical or partial nephrectomy for localized renal cell carcinoma and management of recurrent disease. Urol Clin North Am. 2003; 30(4):843–852. PMID: 14680319.
crossref
4. Hollingsworth JM, Miller DC, Daignault S, Hollenbeck BK. Rising incidence of small renal masses: a need to reassess treatment effect. J Natl Cancer Inst. 2006; 98(18):1331–1334. PMID: 16985252.
crossref
5. Randall JM, Millard F, Kurzrock R. Molecular aberrations, targeted therapy, and renal cell carcinoma: current state-of-the-art. Cancer Metastasis Rev. 2014; 33(4):1109–1124. PMID: 25365943.
crossref
6. Motzer RJ, Jonasch E, Agarwal N, Bhayani S, Bro WP, Chang SS, et al. Kidney cancer, version 2.2017, NCCN clinical practice guidelines in oncology. J Natl Compr Canc Netw. 2017; 15(6):804–834. PMID: 28596261.
crossref
7. Ljungberg B, Albiges L, Bensalah K, Bex A, Giles RH, Hora M, et al. EAU guidelines on renal cell carcinoma. Updated 2017. Accessed May 10, 2017. http://uroweb.org/guideline/renal-cell-carcinoma.
8. Motzer RJ, Hutson TE, Cella D, Reeves J, Hawkins R, Guo J, et al. Pazopanib versus sunitinib in metastatic renal-cell carcinoma. N Engl J Med. 2013; 369(8):722–731. PMID: 23964934.
crossref
9. Motzer RJ, Hutson TE, McCann L, Deen K, Choueiri TK. Overall survival in renal-cell carcinoma with pazopanib versus sunitinib. N Engl J Med. 2014; 370(18):1769–1770. PMID: 24785224.
crossref
10. Pal SK, Ghate SR, Li N, Swallow E, Peeples M, Zichlin ML, et al. Real-world survival outcomes and prognostic factors among patients receiving first targeted therapy for advanced renal cell carcinoma: a SEER-medicare database analysis. Clin Genitourin Cancer. 2017; 15(4):e573–82. PMID: 28139444.
crossref
11. Escudier B, Porta C, Bono P, Powles T, Eisen T, Sternberg CN, et al. Randomized, controlled, double-blind, cross-over trial assessing treatment preference for pazopanib versus sunitinib in patients with metastatic renal cell carcinoma: PISCES study. J Clin Oncol. 2014; 32(14):1412–1418. PMID: 24687826.
crossref
12. Ruiz-Morales JM, Swierkowski M, Wells JC, Fraccon AP, Pasini F, Donskov F, et al. First-line sunitinib versus pazopanib in metastatic renal cell carcinoma: results from the International Metastatic Renal Cell Carcinoma Database Consortium. Eur J Cancer. 2016; 65:102–108. PMID: 27487293.
crossref
13. Motzer RJ, Escudier B, Bukowski R, Rini BI, Hutson TE, Barrios CH, et al. Prognostic factors for survival in 1059 patients treated with sunitinib for metastatic renal cell carcinoma. Br J Cancer. 2013; 108(12):2470–2477. PMID: 23695024.
crossref
14. Kim HS, Hong MH, Kim K, Shin SJ, Ahn JB, Jeung HC, et al. Sunitinib for Asian patients with advanced renal cell carcinoma: a comparable efficacy with different toxicity profiles. Oncology. 2011; 80(5-6):395–405. PMID: 21829041.
crossref
15. Houk BE, Bello CL, Kang D, Amantea M. A population pharmacokinetic meta-analysis of sunitinib malate (SU11248) and its primary metabolite (SU12662) in healthy volunteers and oncology patients. Clin Cancer Res. 2009; 15(7):2497–2506. PMID: 19258444.
crossref
16. Lalani AA, Li H, Heng DY, Wood L, Kalirai A, Bjarnason GA, et al. First-line sunitinib or pazopanib in metastatic renal cell carcinoma: the Canadian experience. Can Urol Assoc J. 2017; 11(3-4):112–117. PMID: 28515811.
crossref
17. Pan X, Huang H, Huang Y, Liu B, Cui X, Gan S, et al. Sunitinib dosing schedule 2/1 improves tolerability, efficacy, and health-related quality of life in Chinese patients with metastatic renal cell carcinoma. Urol Oncol. 2015; 33(6):268.e9–268.e15.
crossref
18. Lee JL, Kim MK, Park I, Ahn JH, Lee DH, Ryoo HM, et al. RandomizEd phase II trial of Sunitinib four weeks on and two weeks off versus Two weeks on and One week off in metastatic clear-cell type REnal cell carcinoma: RESTORE trial. Ann Oncol. 2015; 26(11):2300–2305. PMID: 26347107.
crossref
19. Iacovelli R, Cossu Rocca M, Galli L, De Giorgi U, Sabbatini R, Santoni M, et al. Clinical outcome of patients who reduced sunitinib or pazopanib during first-line treatment for advanced kidney cancer. Urol Oncol. 2017; 35(9):541.e7–541.e13.
crossref
20. Atkinson BJ, Kalra S, Wang X, Bathala T, Corn P, Tannir NM, et al. Clinical outcomes for patients with metastatic renal cell carcinoma treated with alternative sunitinib schedules. J Urol. 2014; 191(3):611–618. PMID: 24018239.
crossref
21. Buti S, Donini M, Bersanelli M, Gattara A, Leonardi F, Passalacqua R. Feasibility, safety, and efficacy of an alternative schedule of sunitinib for the treatment of patients with metastatic renal cell carcinoma: a retrospective study. Drugs R D. 2017; 17(4):585–596. PMID: 28895069.
crossref
22. Mittal K, Derosa L, Albiges L, Wood L, Elson P, Gilligan T, et al. Drug holiday in metastatic renal-cell carcinoma patients treated with vascular endothelial growth factor receptor inhibitors. Clin Genitourin Cancer. 2018; 16(3):e663–7. PMID: 29428404.
crossref
23. Albiges L, Hakimi AA, Xie W, McKay RR, Simantov R, Lin X, et al. Body mass index and metastatic renal cell carcinoma: clinical and biological correlations. J Clin Oncol. 2016; 34(30):3655–3663. PMID: 27601543.
crossref
24. McKay RR, Kroeger N, Xie W, Lee JL, Knox JJ, Bjarnason GA, et al. Impact of bone and liver metastases on patients with renal cell carcinoma treated with targeted therapy. Eur Urol. 2014; 65(3):577–584. PMID: 23962746.
crossref
25. Kalra S, Verma J, Atkinson BJ, Matin SF, Wood CG, Karam JA, et al. Outcomes of patients with metastatic renal cell carcinoma and bone metastases in the targeted therapy era. Clin Genitourin Cancer. 2017; 15(3):363–370. PMID: 28216278.
crossref
26. Mundy GR. Metastasis to bone: causes, consequences and therapeutic opportunities. Nat Rev Cancer. 2002; 2(8):584–593. PMID: 12154351.
crossref
27. Gerlinger M, Rowan AJ, Horswell S, Math M, Larkin J, Endesfelder D, et al. Intratumor heterogeneity and branched evolution revealed by multiregion sequencing. N Engl J Med. 2012; 366(10):883–892. PMID: 22397650.
crossref

SUPPLEMENTARY MATERIALS

Supplementary Table 1

Comparison of complete and PR patients vs. stable and progressive disease patients
jkms-33-e325-s001.xls

Supplementary Table 2

Adverse events difference according to the age and the sex, regardless of treatment
jkms-33-e325-s002.xls

Supplementary Fig. 1

(A) OS difference between SU and PZ groups who received second line therapy. SU: median 30.0 months 95% CI (22.6–37.4) vs. PZ: median 32.9 months 95% CI (27.0–37.0), log-rank P value = 0.289. (B) OS difference between SU and PZ groups with dose reduction. SU: median 42.3 months 95% CI (34.6–50.1) vs. PZ; median 43.3 months 95% CI (not estimated), log-rank P value = 0.971. (C) OS difference between SU and PZ groups without dose reduction. SU: median 29.2 months 95% CI (24.0–34.4) vs. PZ: median 35.6 months 95% CI (21.0–50.3), log-rank P value = 0.909. (D) OS difference in SU group with or without dose reduction. Without dose reduction: median 29.2 months 95% CI (24.0–34.4) vs. dose reduction: median 42.3 months 95% CI (34.6–50.1), log-rank P value = 0.162. (E) OS difference in PZ group with or without dose reduction. Without dose reduction median 35.6 months 95% CI (21.0–50.3) vs. dose reduction median 43.3 months 95% CI (not estimated), log-rank P value = 0.259.
jkms-33-e325-s003.ppt
TOOLS
ORCID iDs

Myung Soo Kim
https://orcid.org/0000-0003-1456-2154

Ho Seok Chung
https://orcid.org/0000-0001-9883-1539

Eu Chang Hwang
https://orcid.org/0000-0002-2031-124X

Seung Il Jung
https://orcid.org/0000-0003-4864-8175

Dong Deuk Kwon
https://orcid.org/0000-0002-4544-5420

Jun Eul Hwang
https://orcid.org/0000-0002-3768-4149

Woo Kyun Bae
https://orcid.org/0000-0003-0267-1943

Jae Young Park
https://orcid.org/0000-0002-6664-6846

Chang Wook Jeong
https://orcid.org/0000-0002-2200-5019

Cheol Kwak
https://orcid.org/0000-0002-1987-2111

Cheryn Song
https://orcid.org/0000-0002-1823-4281

Seong Il Seo
https://orcid.org/0000-0002-9792-7798

Seok-Soo Byun
https://orcid.org/0000-0001-9356-9500

Sung-Hoo Hong
https://orcid.org/0000-0002-1952-4010

Jinsoo Chung
https://orcid.org/0000-0003-2251-5331

Similar articles