

 PDF
PDF ePub
ePub Citation
 Print
Print


INTRODUCTION
Mitochondria are organelles in cells that perform a variety of cellular metabolic functions, including the generation of most cellular energy in the form of adenosine triphosphate.1 Mitochondrial disease is a clinically heterogeneous group of diseases, in which mitochondrial dysfunction is caused by several mutations of mitochondrial or nuclear DNA.2
The disease mitochondrial encephalomyopathy, lactic acidosis and stroke-like episodes (MELAS) is characterized by early onset of stroke-like episodes. MELAS syndrome is the most dominant subtype of mitochondrial disease.34 It is one of the most frequent maternally inherited mitochondrial disorders and has been shown to be associated with an A>G transition at position 3243 of the tRNALeU(UUR) gene.56
The diagnosis of MELAS is based on a combination of clinical findings, biochemical testing, muscle pathology, and molecular genetic testing. Typically, a blood sample is initially tested as part of the diagnostic evaluation in patients clinically suspected with MELAS.7 Meanwhile, the usefulness of muscle biopsy in terms of initial diagnostic evaluation remains unknown. This study aimed to study the usefulness of muscle biopsy in MELAS patients with mitochondrial DNA (mtDNA) 3243A>G mutation as an initial diagnostic tool.
Go to : 
MATERIALS AND METHODS
Patients
The medical records of patients who were diagnosed with MELAS based on the diagnostic criteria of Yatsuga, et al.2 at the Department of Pediatrics of Gangnam Severance Hospital between January 2006 and January 2017 were reviewed. Patients without mtDNA mutation were excluded from the analysis. The Institutional Review Board of Gangnam Severance Hospital in Seoul, Korea approved all procedures (3-2015-0156). Informed consent was obtained, and all methods were performed in accordance with the relevant guidelines and ethics board regulations.
Study design
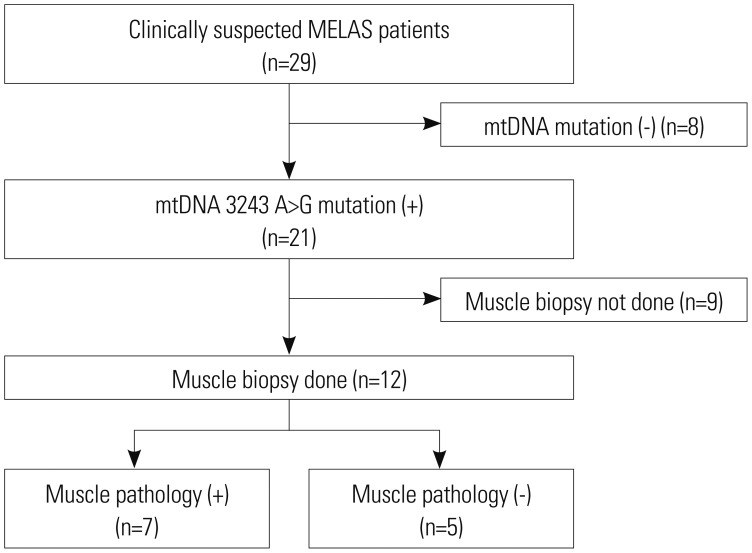
The study population was divided into two subgroups according to whether the results of muscle pathology were in accordance with mitochondrial diseases or not (n=7 vs. n=5, respectively). Clinical variables, diagnostic evaluations, and clinical outcomes were compared between the two groups (Fig. 1).
Clinical characteristics, diagnostic investigations, and clinical outcomes for MELAS
Clinical data on age at onset of the first symptom, nature of the first symptom, age at diagnosis, period from the first symptoms to the last visit, and organ involvement were collected. Laboratory test results were also obtained, including serum lactic acid levels. The degree of serum lactic acidosis was defined as mild, moderate, or severe if the increase was more than the normal reference values at less than two-, three-, or more than three-fold, respectively. All patients were tested for genetic mutations involved in MELAS, including mtDNA 3243A>G mutation. Muscle biopsies from the quadriceps muscle, with which histologic, light microscopic, and electron microscopic examinations were performed. Specific findings for mitochondrial diseases under a light microscope were defined as the presence of ragged red fibers (RRF) or abnormal staining. Abnormal mitochondrial morphology was defined under the electron microscope as pleoconia and megaconia. Biochemical enzyme assay in the muscle was also performed to evaluate mitochondrial respiratory chain (MRC) enzyme activity. MRC complex defect was defined as a residual enzyme activity <10% of the reference value. Data from magnetic resonance imaging and magnetic resonance spectroscopy study were also collected.
The clinical severity of patients was defined as follows: normal, ambulatory, and independent for daily activities; mild, ambulatory, or independent for daily activities; moderate, wheelchair-bound, or partially dependent for daily activities; and severe, bedridden, totally dependent for daily activities, or expired.
Statistical analysis
All analyses were performed using SPSS version 20.0 (IBM Corp., Armonk, NY, USA). Descriptive statistics were used including the median and range. Differences between subgroups were evaluated using the Mann-Whitney U test (Wilcoxon rank sum test) and Fisher's exacts test. p values <0.05 were considered statistically significant.
Go to :
RESULTS
Patient characteristics and clinical features at the last visit
A total of 21 patients was recruited in this study. Among them, 12 were male and nine were female (Table 1). The initial presenting symptoms varied, with seizures (9 of 21, 42.9%) being the most common, followed by mental change (4 patients, 19%), weakness (4 patients, 19%), visual disturbance, and ataxia. The mean age of the first symptom onset was 14.9±9.7 years. Central nervous system involvement was found in all patients, and various organs were affected as shown in Table 1. Besides central nervous system involvement, the ear was the most commonly involved organ in 16 (76.2%) patients. The majority of patients had multiple organ involvement including the gastrointestinal tract, endocrine system, eyes, and heart (71.4, 71.4, 66.7, and 57.1%, respectively).
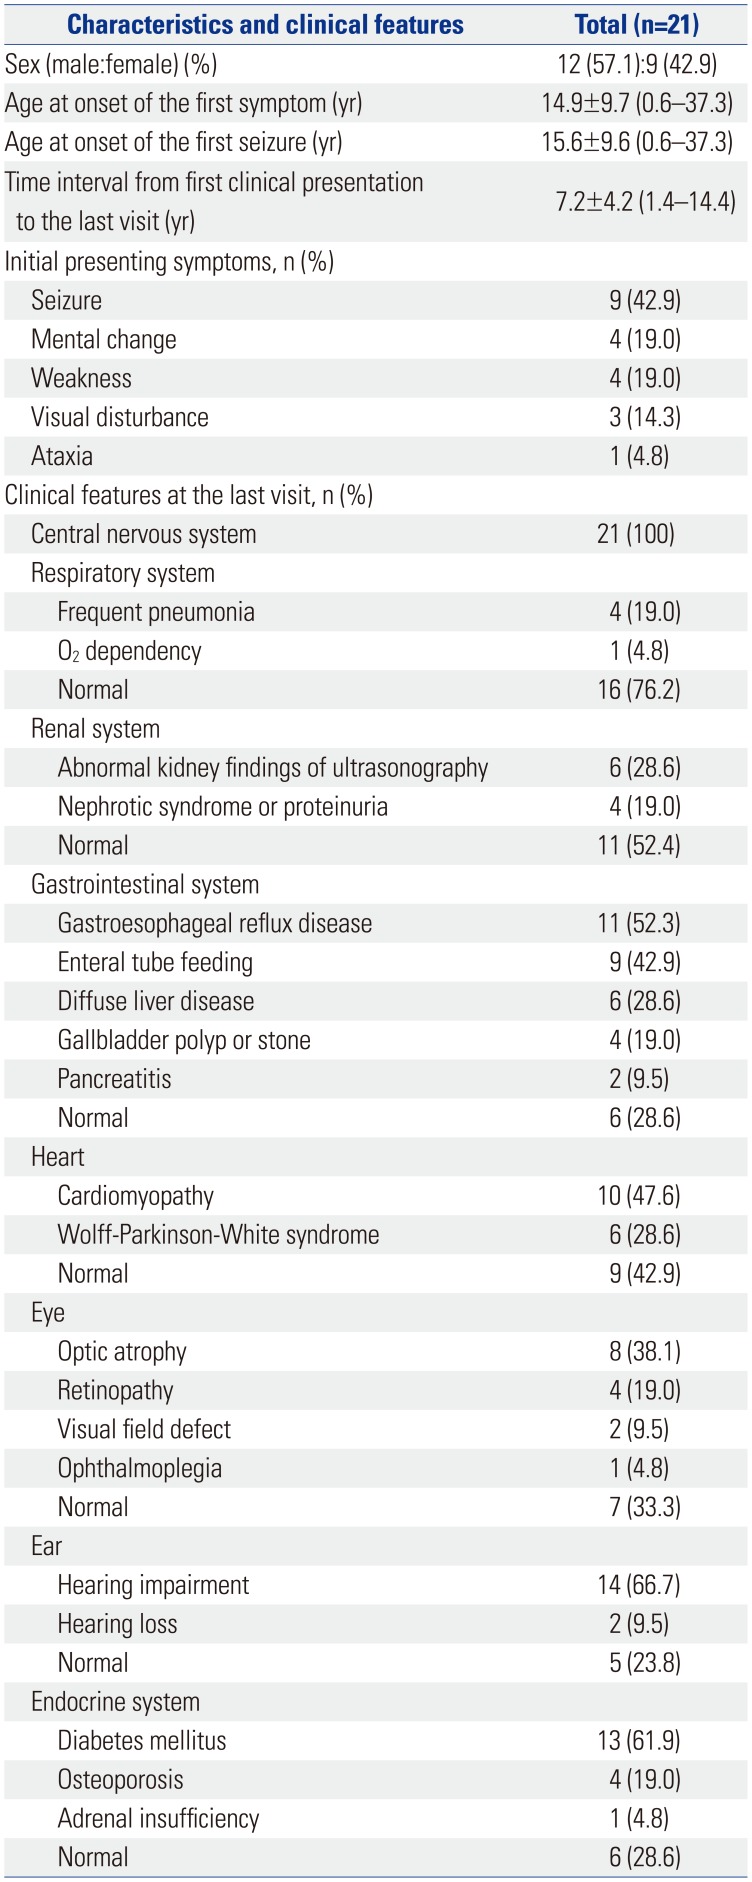
Table 1
Characteristics and Clinical Features at the Last Visit
![]()
Diagnostic evaluations
All patients were diagnosed with MELAS, which was confirmed by genetic testing, and they were all positive for mtDNA 3243A>G mutation. Increased serum lactic acid levels were observed in all patients. Magnetic resonance images of the brain revealed a variety of abnormal findings, including atrophy or abnormal signal intensities in different areas, and almost all patients (20 of 21 patients) had evidence of infarction at the time of the study. Magnetic resonance spectroscopy study data were obtained in 19 patients. The presence of lactate peak was observed in 16 patients (84.2%). Muscle biopsy was performed in 12 patients (57.1%). Table 2 shows the abnormal findings seen under light microscopy and electron microscopy, as well as MRC enzyme activity: abnormal changes specific to mitochondrial diseases under a light microscope were seen in seven of the 12 patients (58.3%); electron microscopic changes with pleoconia or megaconia were noted in four of the 12 patients (33.3%). Biochemical enzyme assay in the muscle tissue revealed deficiency of MRC complex I in nine of 10 patients (90%) (Table 2).
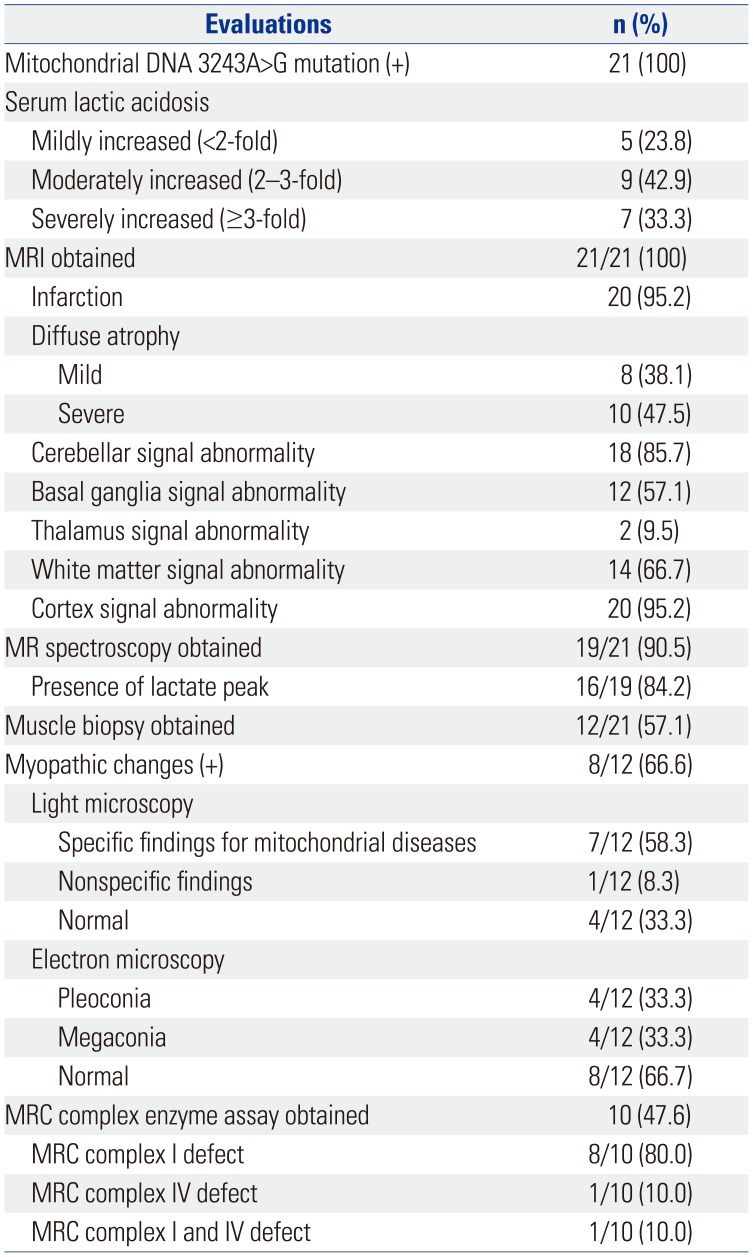
Table 2
Diagnostic Evaluations of MELAS (n=21)
![]()
Clinical outcomes
The mean time interval from the first clinical presentation to the last visit at our institute was 7.2±4.2 years, and the number of stroke like episodes averaged during the study duration was 3.5±2.9 (range 0 to 10). Of the 21 patients, 16 patients (76.2%) exhibited delayed development or mental retardation, and 12 patients (57.1%) had moderate to severe impairment in daily living functions. Our data showed that clinical severities were quite variable (Table 3).
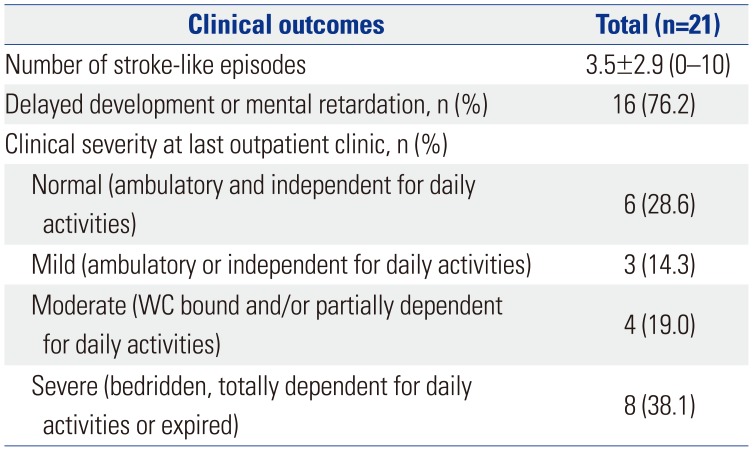
Table 3
Clinical Outcomes at Last Visit
![]()
Analysis of general characteristics, clinical features, diagnostic evaluations, and clinical outcomes by subgroup
Patients with weakness as the initial symptom demonstrated positive muscle pathology, although the difference was statistically insignificant (p=0.071). No significant trends were observed concerning general characteristics or clinical features according to muscle pathology, nor were there any significant differences in the severity of serum lactic acidosis or neuroimaging studies and organ involvement (Tables 4 and 5). Dividing the patients into subgroups according to muscle pathology, we found that differences in light microscopic changes were statistically significant, while electron microscopic changes were similar (p<0.001, p=0.071, respectively). No meaningful differences were found in terms of the parameters of the number, development, and clinical severity of stroke-like episodes (Table 6).
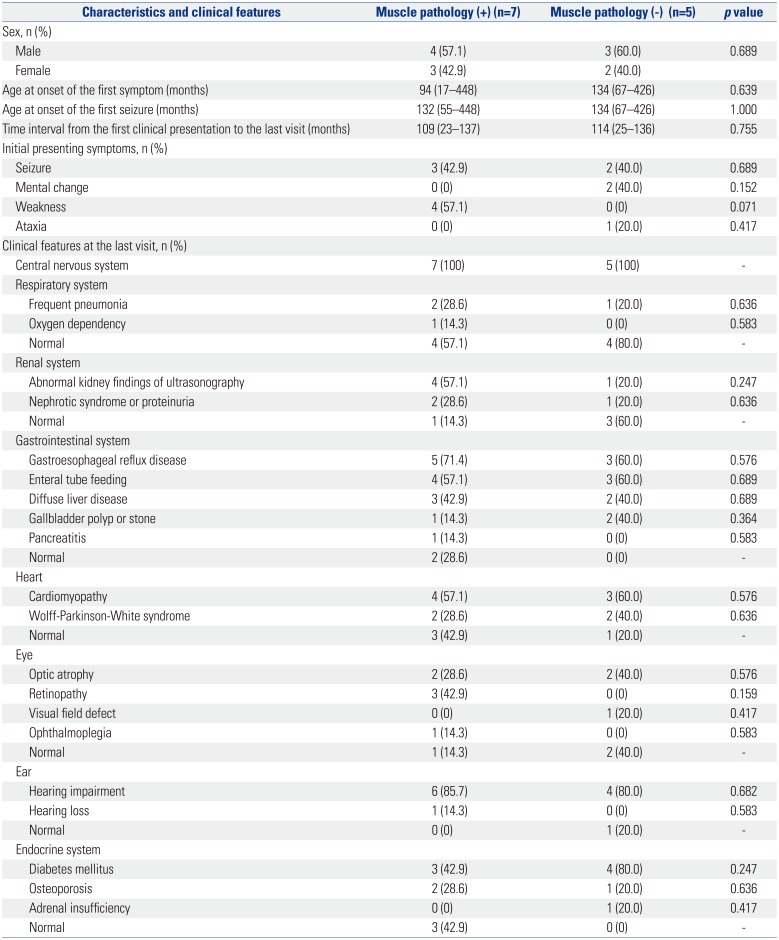
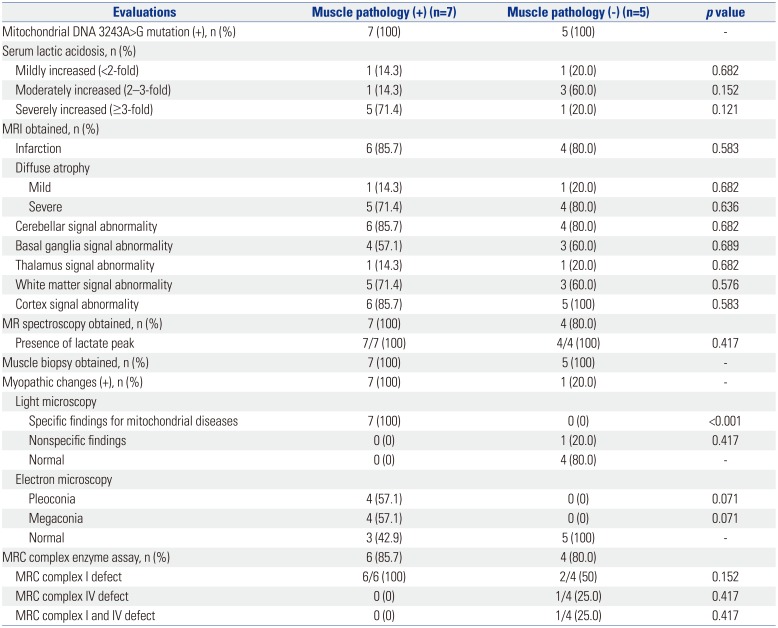
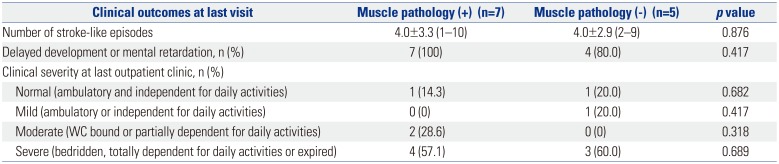
Table 4
Comparison of General Characteristics and Clinical Features between Subgroups
![]()
Table 5
Comparison of Diagnostic Evaluations between Subgroups
![]()
Table 6
Comparison of Clinical Outcomes between Subgroups
![]()
Go to :
DISCUSSION
Most of the current diagnostic criteria on mitochondrial disease were developed prior to the recent expansion of molecular genetic knowledge.89 These criteria are based on combinations of clinical, laboratory, pathologic, biochemical, and genetic findings.10 Given the complexity of mitochondrial diseases, their clinical manifestations are extremely heterogeneous, and the various combinations of organ involvement have led to defining mitochondrial syndromes according to the presentations thereof: some are well known for their acronyms, such as MELAS and myoclonic epilepsy with RRF.1 However, with outstanding accuracy, molecular diagnosis is gaining popularity, and with further development in diagnostic technology, muscle biopsy has generally come to be considered less useful in MELAS patients confirmed by genetic testing. Our study is unique and meaningful because few studies have sought to assess the usefulness of muscle biopsy in mitochondrial diseases, such as MELAS.
MELAS syndrome was first described in 1984 by Pavlakis, et al.4 Later, Hirano, et al.11 defined the three almost invariant criteria of MELAS: 1) stroke-like episode before the age of 40 years; 2) encephalopathy characterized by seizures, dementia, or both; and 3) lactic acidosis, presence of RRFs, or both. The diagnosis is confirmed if at least two of the following criteria were also present: 1) normal early development, 2) recurrent headaches, and 3) recurrent vomiting episodes. Recently, the MELAS study committee in Japan published other diagnostic criteria by which the diagnosis is considered definitive with at least two category A criteria (headaches with vomiting, seizures, hemiplegia, cortical blindness, and acute focal lesions in neuroimaging) and two category B criteria (high plasma or cerebrospinal fluid lactate, mitochondrial abnormalities in muscle biopsy, and a MELAS-related gene mutation).6 Molecular genetic testing is also important in the diagnosis of MELAS. The mtDNA 3243A>G mutation in the MT-TL1 gene encoding tRNALeu(UUR) is found in 80% of MELAS patients.512 Additional mtDNA mutations have been shown to be associated with MELAS, such as the MT-TL1 pathogenic variants (mitochondrial DNA 3271 T>C and mitochondrial DNA 3252 A>G mutations).13 Currently, over 30 mtDNA gene mutations have been found to be associated with this syndrome (http://www.ncbi.nlm.nih.gov/omim/540000). Our data were consistent with previous studies in terms of prevalence of the mtDNA 3243A>G mutation.2 Molecular genetic testing was performed in all patients, and they were all (100%) positive for mtDNA 3243A>G mutation. No other mutations were noted. The results of the present study correspond with an earlier study that reported that the primary considerable and common gene is mtDNA 3243A>G mutation. The mtDNA 3243A>G mutation in the MT-TL1 gene has a wide phenotypic spectrum, including MELAS, chronic progressive external ophthalmoplegia, maternally inherited deafness and diabetes, and Leigh syndrome. Other reported features include isolated myopathy, cardiomyopathy, seizures, migraine, ataxia, cognitive impairment, bowel dysmotility, and short stature.1415 The extreme variability in the clinical phenotype is due to the proportion of mutated mtDNA or the number of wild-type mtDNA within tissues.1617 Detection of mtDNA point mutation without quantification alone has been generally accepted to be insufficient in the diagnosis of MELAS because of mtDNA heteroplasmy. The heteroplasmy of mtDNA makes the detection of mtDNA point mutation alone and without quantification insufficient to diagnose MELAS.
Before the development of newer molecular genetic testing, muscle biopsy was thought to be the best method to obtain accurate diagnosis of mitochondrial diseases, MELAS in particular. The diagnosis of MELAS is often confirmed by the presence of RRF on succinate dehydrogenase histochemical stain, as a result of diseased mitochondrial aggregates in the subsarcolemmal areas of muscle fibers.101819 Muscle biopsy also provides muscle tissue samples for morphological, biochemical, and molecular studies. In the current study, no statistically significant difference was observed between MELAS patient harboring 3243A>G point mutation who were positive for muscle pathology and those who were negative for muscle pathology. On the basis of this finding, we deemed the usefulness of muscle biopsy to be limited at initial confirmative diagnosis of MELAS. Additionally, the patients with weakness as the initial symptom of MELAS were all positive for muscle pathology. While it is assumed that muscle pathology can provide some information to MELAS patients with weakness, no statistically significant relationship was found between the groups that were positive for muscle pathology and negative for muscle pathology (p=0.071). Nevertheless, these findings may reflect the difficulty of obtaining a statistical correlation because of the limited number of patients in each subgroup. Moreover, myopathy has long been recognized and well described in MELAS and several other mitochondrial diseases.18 In a prospective cohort of MELAS patients in Japan, of 96 patients, 36 (37.5%) patients had muscle weakness at onset, and 40 (41.7%) experienced muscle weakness over the entire course.2 The importance of muscle pathology in a patient suspected with MELAS syndrome should not be overlooked, particularly in a patient whose predominant clinical symptoms include muscle weakness.3
MELAS patients harboring point mutation involve a high frequency of RRF.20 However, no studies investigating the usefulness of muscle biopsy in MELAS patients diagnosed by molecular analysis have been conducted. Previous studies have reported that the accumulation of mitochondria in muscle fibers, which were composed of typical RRF, is found in up to 97% of MELAS patients.2021 Nevertheless, several points should be considered in regards to the limitations of muscle biopsy. The procedure is invasive and requires sedation when dealing with children. On occasion, the pathologist is only able to conclude that the specimen provides findings consistent with an unspecified myopathy. This result may occur for a variety of reasons, including cases where the obtained tissue may not have been taken from a disease-fulminant region or the volume of muscle tissue is not enough.22 Moreover, a normal reference value of muscle tissue based on age still remains unknown.1019 Notwithstanding, muscle biopsy has been performed in the routine analysis for mitochondrial disease when the diagnosis cannot be confirmed with genetic testing.10
This study was retrospective in nature, and it has some limitations. Because of disease rarity, the size of the study population was small, which may imply that the results are not sufficient for making generalized interpretations. From the results, the usefulness of muscle biopsy was shown to be limited in making the initial confirmative diagnosis of MELAS. Muscle biopsy was not able to provide additional information on MELAS patients when already diagnosed through genetic testing. However, muscle biopsy could provide some information if genetic testing cannot confirm a diagnosis in clinically suspected MELAS patients with weakness, which may be a symptom of myopathy. In short, though a genetic test should be the first choice to diagnose MELAS, muscle biopsy should be considered as an additional choice in clinically suspected MELAS patient with weakness not confirmed by genetic testing. In order to provide a more generalized guideline, studies on larger numbers of patients are needed to better delineate the usefulness of muscle biopsy in MELAS. Mitochondrial disease is heterogeneous in general, and each of the mitochondrial syndromes tend to display their own specific clinical manifestations. These characteristics warrant continuous study, and whether previous diagnostic tools are in fact the best methods for each specific type of syndrome needs to be verified.
Go to :
 XML Download