MATERIALS AND METHODS
Patients
Patients were selected from 53 patients who met the inclusion criteria of the study and agreed to be enrolled in the study. This study was performed according to the protocol approved by the Local Ethics Committee (4-2018-0931) and informed consent was waived due to retrospective nature.
A flow chart of the enrolled patients in our study is presented in
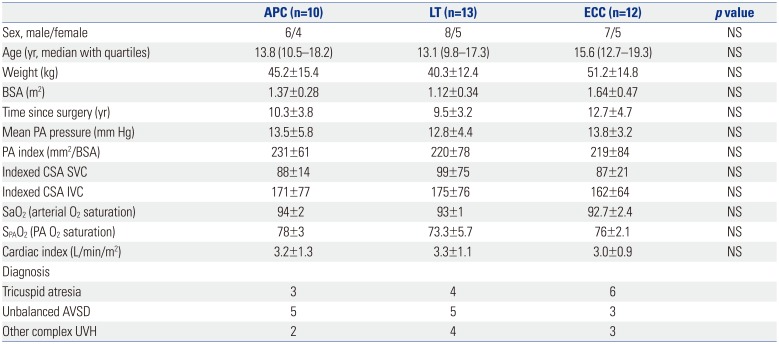
Fig. 1. We studied 35 post-Fontan patients (median age 14.6 years, 10.7 years after Fontan operation, males:female=21:14). Ten patients underwent APC, 13 patients had LT Fontan operation, and the remaining 12 patients underwent ECC Fontan operation (
Table 1). LT Fontan and ECC Fontan were defined as TCPC Fontan circuit. They underwent intravascular Doppler ultrasonography between January 2001 and December 2010 at Severance Cardiovascular Hospital, Yonsei University Health System.
 | Fig. 1Flow chart of the enrolled patients. IDE, intravenous Doppler echocardiography; APC, atriopulmonary connection; LT, lateral tunnel; ECC, extracardiac conduit.
|
Table 1
Demographic and Clinical Characteristics of Different Types of Fontan Patients
|
APC (n=10) |
LT (n=13) |
ECC (n=12) |
p value |
|
Sex, male/female |
6/4 |
8/5 |
7/5 |
NS |
|
Age (yr, median with quartiles) |
13.8 (10.5–18.2) |
13.1 (9.8–17.3) |
15.6 (12.7–19.3) |
NS |
|
Weight (kg) |
45.2±15.4 |
40.3±12.4 |
51.2±14.8 |
NS |
|
BSA (m2) |
1.37±0.28 |
1.12±0.34 |
1.64±0.47 |
NS |
|
Time since surgery (yr) |
10.3±3.8 |
9.5±3.2 |
12.7±4.7 |
NS |
|
Mean PA pressure (mm Hg) |
13.5±5.8 |
12.8±4.4 |
13.8±3.2 |
NS |
|
PA index (mm2/BSA) |
231±61 |
220±78 |
219±84 |
NS |
|
Indexed CSA SVC |
88±14 |
99±75 |
87±21 |
NS |
|
Indexed CSA IVC |
171±77 |
175±76 |
162±64 |
NS |
|
SaO2 (arterial O2 saturation) |
94±2 |
93±1 |
92.7±2.4 |
NS |
|
SPAO2 (PA O2 saturation) |
78±3 |
73.3±5.7 |
76±2.1 |
NS |
|
Cardiac index (L/min/m2) |
3.2±1.3 |
3.3±1.1 |
3.0±0.9 |
NS |
|
Diagnosis |
|
|
|
|
|
Tricuspid atresia |
3 |
4 |
6 |
|
|
Unbalanced AVSD |
5 |
5 |
3 |
|
|
Other complex UVH |
2 |
4 |
3 |
|

The patients were considered to be included in the study when they had good post-Fontan status to represent hemodynamic characteristics of each Fontan circuit. The patients were excluded from this study when they had severe arrhythmia, abnormal systemic ventricular function, and any significant residual hemodynamic abnormalities, such as Fontan circuit stenosis, valve regurgitation, intracardiac shunt, and abnormally-high Fontan circuit pressure (mean pressure ≥20 mm Hg) evidenced by electrocardiography, echocardiography, and catheterization.
Measurements
Intravenous Doppler echocardiography (IDE) study was performed in all patients after routine cardiac catheterization, including pressure recording and oxygen saturation measurements. Intravenous heparin of 5000 IU was administered under the monitoring of respiratory and cardiac cycles, and a piezoelectric ultrasound transducer of 12 MHz was inserted in an 8-French guiding catheter. The systems of fast Fourier transformation and computer display (FloMap™, Cardiometrics, Mountain View, CA, USA) processed the signals of flow velocity and spectral format. Each flow velocity was measured continuously in the superior vena cava (SVC), inferior vena cava (IVC), HV, baffle of LT, conduit of ECC, left pulmonary artery (LPA), and right pulmonary artery (RPA) based on the respiratory cycle and cardiac cycle. The tip of the Doppler transducer was placed in a free lumen along the longitudinal axis of the vessels to avoid bending. The pressure and saturation were measured simultaneously using an aortic system to monitor the vital signs.
The values were measured three times in each vessel, recorded on video tapes, and analyzed by an offline interrogation. The sites of Doppler interrogation were as follows: SVC, between the innominate vein and PA; IVC, 2–3 cm inferior to the junction of the IVC and RA; HV, 2–3 cm laterally to the junction of the HV and IVC; RPA, 1 cm medially to the hilum of the lung; LPA, 1 cm medially to the hilum of the lung; and baffle and conduit, middle portion to avoid deviating the upper or lower portion. Measured values were obtained at the SVC, IVC, HV, baffle of LT, conduit of ECC, LPA, and RPA in three Fontan groups. Systolic (S), diastolic (D), and reverse (R) waves from the echocardiographic Doppler examination were determined as previously described.
5 The S and D flows were included, and the R flow was excluded to calculate the parameters of pulsatility index (PIx) and respiratory variability index (RVI).
We measured the forward velocity time integral (VTI) and average velocity (AV), reverse VTI and AV, and calculated PI, RVI, net antegrade flow integral (NAFI), mean flow rate (MFR, Q), and IQ/EQ (inspiratory Q/expiratory Q) using the following Eqs. from (3) to (7).
The IQ/EQ was defined as the approximate value under the premise that a difference in the vessel area between inspiration and expiration is small enough to ignore. Therefore, AV, VTI, and Q reflect flow characteristics. NAFI reflects flow efficiency and PIx reflects influence of cardiac cycle. RVI and IQ/EQ reflect respiratory influence on blood flow characteristics. The mean of the measured values was calculated at each vessel, and the mean values were used to calculate the parameters of VTI, AV, PIx, RVI, NAFI, Q, and IQ/EQ. We compared delicate differences of these parameters between APC and TCPC Fontan and among APC, LT, and ECC according to pulsatile variation and respiratory variation. Chronological steps of analyzing the echocardiographic and equational parameters are presented in
Fig. 2.
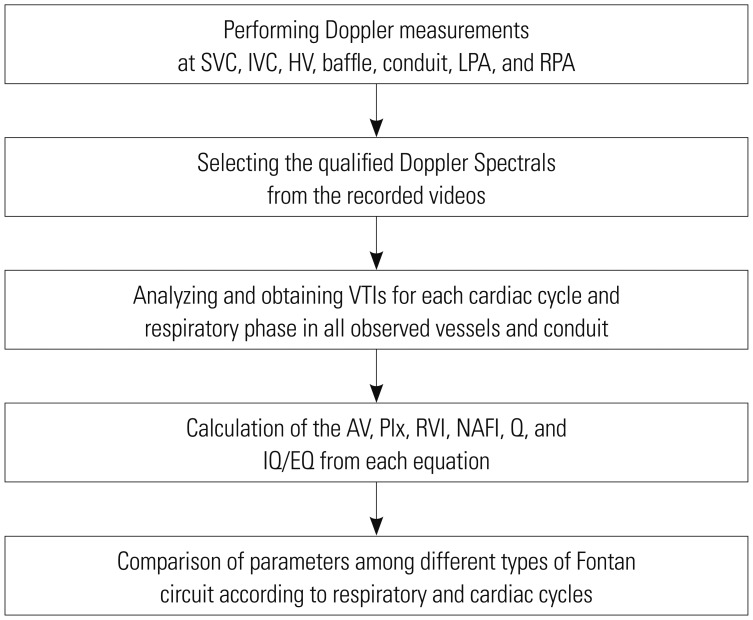 | Fig. 2Chronological steps of analyzing the echocardiographic and equational parameters. SVC, superior vena cava; IVC, inferior vena cava; HV, hepatic vein; LPA, left pulmonary artery; RPA, right pulmonary artery; VTI, velocity time integral; AV, average velocity; PIx, pulsatility index; RVI, respiratory variability index; NAFI, net antegrade flow integral; MFR, mean flow rate (Q); IQ/EQ, inspiratory Q/expiratory Q.
|
Statistical analysis
Parameters were compared among the Fontan types based on the respiratory cycles and cardiac cycles using a nonparametric test (Mann-Whitney U test). p values of <0.05 were considered statistically significant, and SPSS version 12 (SPSS Inc., Chicago, IL, USA) was used.
Go to :

RESULTS
The demographic and clinical characteristics of the patients showed no statistically significant differences in age, sex, weight, PA pressure, or PA indices among Fontan operations. The most common diagnosis for both APC and LT was unbalanced atrioventricular septal defect; in ECC, the most common diagnosis was tricuspid atresia (
Table 1).
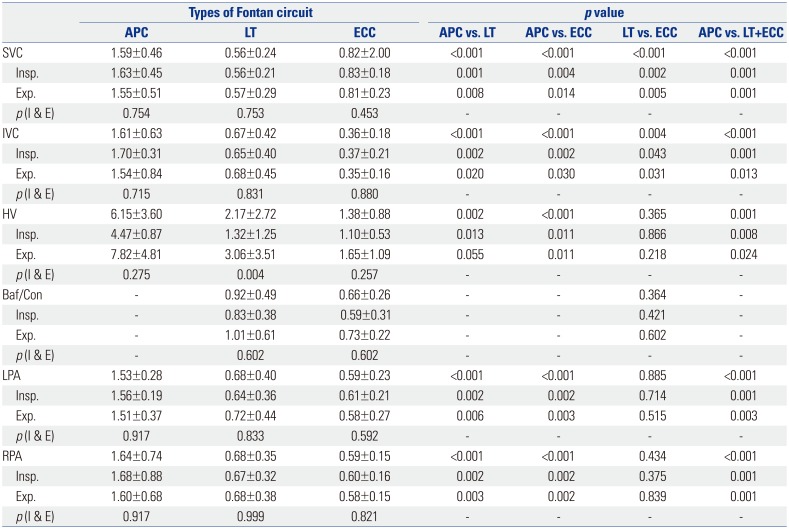
The values of PIx in APC were greater than those in TCPC in all vessels. The PIx in APC significantly increased, compared with the PIx in TCPC, at all vessels (
p<0.05) regardless of respiratory cycle. The PIx between APC and LT and between APC and ECC showed significant differences at all interrogation points (
p<0.05). The PIx between LT and ECC showed significant differences only at the SVC and IVC (
p<0.05). The PIx between expiration and inspiration did not show significant differences in most interrogation points, and only the PIx in the HV of LT showed significant differences between inspiration and expiration (
p=0.004) (
Table 2).
Table 2
Comparison of PIx between Inspiration and Expiration among the APC, LT, and ECC at the SVC, IVC, HV, Baffle, Conduit, LPA, and RPA
|
Types of Fontan circuit |
p value |
|
APC |
LT |
ECC |
APC vs. LT |
APC vs. ECC |
LT vs. ECC |
APC vs. LT+ECC |
|
SVC |
1.59±0.46 |
0.56±0.24 |
0.82±2.00 |
<0.001 |
<0.001 |
<0.001 |
<0.001 |
|
Insp. |
1.63±0.45 |
0.56±0.21 |
0.83±0.18 |
0.001 |
0.004 |
0.002 |
0.001 |
|
Exp. |
1.55±0.51 |
0.57±0.29 |
0.81±0.23 |
0.008 |
0.014 |
0.005 |
0.001 |
|
p(I & E) |
0.754 |
0.753 |
0.453 |
- |
- |
- |
- |
|
IVC |
1.61±0.63 |
0.67±0.42 |
0.36±0.18 |
<0.001 |
<0.001 |
0.004 |
<0.001 |
|
Insp. |
1.70±0.31 |
0.65±0.40 |
0.37±0.21 |
0.002 |
0.002 |
0.043 |
0.001 |
|
Exp. |
1.54±0.84 |
0.68±0.45 |
0.35±0.16 |
0.020 |
0.030 |
0.031 |
0.013 |
|
p(I & E) |
0.715 |
0.831 |
0.880 |
- |
- |
- |
- |
|
HV |
6.15±3.60 |
2.17±2.72 |
1.38±0.88 |
0.002 |
<0.001 |
0.365 |
0.001 |
|
Insp. |
4.47±0.87 |
1.32±1.25 |
1.10±0.53 |
0.013 |
0.011 |
0.866 |
0.008 |
|
Exp. |
7.82±4.81 |
3.06±3.51 |
1.65±1.09 |
0.055 |
0.011 |
0.218 |
0.024 |
|
p(I & E) |
0.275 |
0.004 |
0.257 |
- |
- |
- |
- |
|
Baf/Con |
- |
0.92±0.49 |
0.66±0.26 |
- |
- |
0.364 |
- |
|
Insp. |
- |
0.83±0.38 |
0.59±0.31 |
- |
- |
0.421 |
- |
|
Exp. |
- |
1.01±0.61 |
0.73±0.22 |
- |
- |
0.602 |
- |
|
p(I & E) |
- |
0.602 |
0.602 |
- |
- |
- |
- |
|
LPA |
1.53±0.28 |
0.68±0.40 |
0.59±0.23 |
<0.001 |
<0.001 |
0.885 |
<0.001 |
|
Insp. |
1.56±0.19 |
0.64±0.36 |
0.61±0.21 |
0.002 |
0.002 |
0.714 |
0.001 |
|
Exp. |
1.51±0.37 |
0.72±0.44 |
0.58±0.27 |
0.006 |
0.003 |
0.515 |
0.003 |
|
p(I & E) |
0.917 |
0.833 |
0.592 |
- |
- |
- |
- |
|
RPA |
1.64±0.74 |
0.68±0.35 |
0.59±0.15 |
<0.001 |
<0.001 |
0.434 |
<0.001 |
|
Insp. |
1.68±0.88 |
0.67±0.32 |
0.60±0.16 |
0.002 |
0.002 |
0.375 |
0.001 |
|
Exp. |
1.60±0.68 |
0.68±0.38 |
0.58±0.15 |
0.003 |
0.002 |
0.839 |
0.001 |
|
p(I & E) |
0.917 |
0.999 |
0.821 |
- |
- |
- |
- |
The PIx in the HV was the highest among the measured vessels. The PIx of the IVC in APC was significantly greater than that in LT and ECC Fontan during the entire respiration cycle (all
p≤0.001). The PIx of the HV in APC significantly increased, compared with that in LT and ECC, during the sum of inspiration and expiration (
p=0.002 and
p<0.001, respectively) (
Table 2).
Further, the PIxs of the HV and IVC in APC were compared with those of the SVC, LPA, and RPA. The PIx of the HV was significantly greater than the PIxs of all other interrogation points (all
p=0.001), and the PIx of the IVC did not show significant differences, compared with those of the other interrogation points, except for the PIx of the HV (
p<0.001) (
Fig. 3).
 | Fig. 3Comparison of PIx among the vessels in APC. PIx, pulsatility index; APC, atriopulmonary connection; SVC, superior vena cava; IVC, inferior vena cava; LPA, left pulmonary artery; RPA, right pulmonary artery.
|
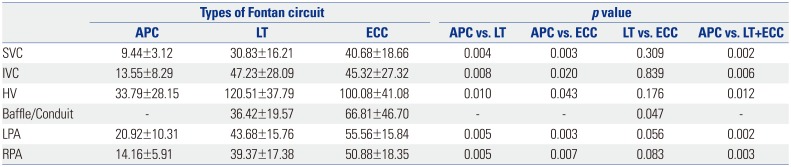
The values of RVI in APC were lower than those in TCPC in all vessels. The RVI in APC significantly decreased, compared with the RVIs in TCPC, at all interrogation points (
p<0.05). The RVI between APC and LT and between APC and ECC showed significant differences at all interrogation points (
p<0.05). The RVI between LT and ECC in most interrogation points did not show significant differences, except for the RVI between baffle and conduit (
p=0.047) (
Table 3).
Table 3
Comparison of RVI (%) among APC, LT, and ECC at the SVC, IVC, HV, Baffle, Conduit, LPA, and RPA
|
Types of Fontan circuit |
p value |
|
APC |
LT |
ECC |
APC vs. LT |
APC vs. ECC |
LT vs. ECC |
APC vs. LT+ECC |
|
SVC |
9.44±3.12 |
30.83±16.21 |
40.68±18.66 |
0.004 |
0.003 |
0.309 |
0.002 |
|
IVC |
13.55±8.29 |
47.23±28.09 |
45.32±27.32 |
0.008 |
0.020 |
0.839 |
0.006 |
|
HV |
33.79±28.15 |
120.51±37.79 |
100.08±41.08 |
0.010 |
0.043 |
0.176 |
0.012 |
|
Baffle/Conduit |
- |
36.42±19.57 |
66.81±46.70 |
- |
- |
0.047 |
- |
|
LPA |
20.92±10.31 |
43.68±15.76 |
55.56±15.84 |
0.005 |
0.003 |
0.056 |
0.002 |
|
RPA |
14.16±5.91 |
39.37±17.38 |
50.88±18.35 |
0.005 |
0.007 |
0.083 |
0.003 |
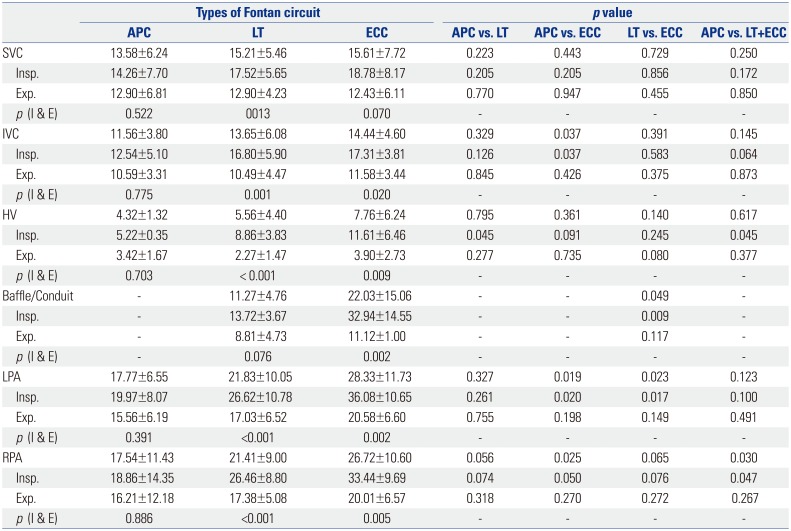
The values of NAFI in APC were the lowest, those in LT were in between, and those in ECC were the highest in all vessels. The NAFI in APC significantly decreased, compared with the NAFI in TCPC in several interrogation points (inspiratory HV, LPA, and RPA), regardless of the respiratory cycles. The NAFI between APC and LT showed significant differences only at the inspiratory HV (
p=0.045). The NAFI between APC and ECC showed significant differences at the IVC, LPA, and RPA (
p<0.05). The NAFI between LT and ECC showed significant differences at the baffle/conduit and LPA (
p=0.049 and 0.023, respectively). The NAFIs between inspiration and expiration in APC did not show significant differences in all interrogation points; however, those in LT and ECC showed significant differences (both
p<0.05), except for that of the SVC in ECC (
p=0.07) (
Table 4).
Table 4
Comparison of NAFI (cm) between Inspiration and Expiration among APC, LT, and ECC at the SVC, IVC, HV, Baffle, Conduit, LPA, and RPA
|
Types of Fontan circuit |
pvalue |
|
APC |
LT |
ECC |
APC vs. LT |
APC vs. ECC |
LT vs. ECC |
APC vs. LT+ECC |
|
SVC |
13.58±6.24 |
15.21±5.46 |
15.61±7.72 |
0.223 |
0.443 |
0.729 |
0.250 |
|
Insp. |
14.26±7.70 |
17.52±5.65 |
18.78±8.17 |
0.205 |
0.205 |
0.856 |
0.172 |
|
Exp. |
12.90±6.81 |
12.90±4.23 |
12.43±6.11 |
0.770 |
0.947 |
0.455 |
0.850 |
|
p(I & E) |
0.522 |
13 |
0.070 |
- |
- |
- |
- |
|
IVC |
11.56±3.80 |
13.65±6.08 |
14.44±4.60 |
0.329 |
0.037 |
0.391 |
0.145 |
|
Insp. |
12.54±5.10 |
16.80±5.90 |
17.31±3.81 |
0.126 |
0.037 |
0.583 |
0.064 |
|
Exp. |
10.59±3.31 |
10.49±4.47 |
11.58±3.44 |
0.845 |
0.426 |
0.375 |
0.873 |
|
p(I & E) |
0.775 |
0.001 |
0.020 |
- |
- |
- |
- |
|
HV |
4.32±1.32 |
5.56±4.40 |
7.76±6.24 |
0.795 |
0.361 |
0.140 |
0.617 |
|
Insp. |
5.22±0.35 |
8.86±3.83 |
11.61±6.46 |
0.045 |
0.091 |
0.245 |
0.045 |
|
Exp. |
3.42±1.67 |
2.27±1.47 |
3.90±2.73 |
0.277 |
0.735 |
0.080 |
0.377 |
|
p(I & E) |
0.703 |
< 0.001 |
0.009 |
- |
- |
- |
- |
|
Baffle/Conduit |
- |
11.27±4.76 |
22.03±15.06 |
- |
- |
0.049 |
- |
|
Insp. |
- |
13.72±3.67 |
32.94±14.55 |
- |
- |
0.009 |
- |
|
Exp. |
- |
8.81±4.73 |
11.12±1.00 |
- |
- |
0.117 |
- |
|
p(I & E) |
- |
0.076 |
0.002 |
- |
- |
- |
- |
|
LPA |
17.77±6.55 |
21.83±10.05 |
28.33±11.73 |
0.327 |
0.019 |
0.023 |
0.123 |
|
Insp. |
19.97±8.07 |
26.62±10.78 |
36.08±10.65 |
0.261 |
0.020 |
0.017 |
0.100 |
|
Exp. |
15.56±6.19 |
17.03±6.52 |
20.58±6.60 |
0.755 |
0.198 |
0.149 |
0.491 |
|
p(I & E) |
0.391 |
<0.001 |
0.002 |
- |
- |
- |
- |
|
RPA |
17.54±11.43 |
21.41±9.00 |
26.72±10.60 |
0.056 |
0.025 |
0.065 |
0.030 |
|
Insp. |
18.86±14.35 |
26.46±8.80 |
33.44±9.69 |
0.074 |
0.050 |
0.076 |
0.047 |
|
Exp. |
16.21±12.18 |
17.38±5.08 |
20.01±6.57 |
0.318 |
0.270 |
0.272 |
0.267 |
|
p(I & E) |
0.886 |
<0.001 |
0.005 |
- |
- |
- |
- |
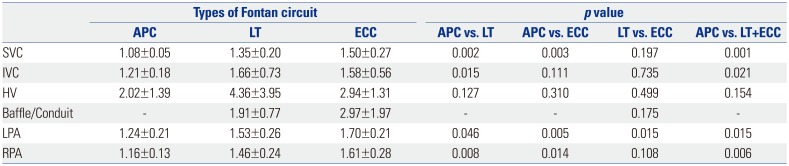
The values of IQ/EQ in APC were lower than those in TCPC in all interrogation points. The IQ/EQ in APC significantly decreased, compared with the IQ/EQ in TCPC, in almost all interrogation points (
p<0.05), except for that in the HV (
p=0.154). The IQ/EQ between APC and LT showed significant differences at the SVC, IVC, LPA, and RPA (
p<0.05). The IQ/EQ between APC and ECC showed significant differences at the SVC, LPA, and RPA (
p<0.05). The IQ/EQ between LT and ECC did not show significant differences in most interrogation points, except for the LPA (
p=0.015) (
Table 5).
Table 5
Comparison of the IQ/EQ among APC, LT, and ECC in the SVC, IVC, HV, Baffle, Conduit, LPA, and RPA
|
Types of Fontan circuit |
p value |
|
APC |
LT |
ECC |
APC vs. LT |
APC vs. ECC |
LT vs. ECC |
APC vs. LT+ECC |
|
SVC |
1.08±0.05 |
1.35±0.20 |
1.50±0.27 |
0.002 |
0.003 |
0.197 |
0.001 |
|
IVC |
1.21±0.18 |
1.66±0.73 |
1.58±0.56 |
0.015 |
0.111 |
0.735 |
0.021 |
|
HV |
2.02±1.39 |
4.36±3.95 |
2.94±1.31 |
0.127 |
0.310 |
0.499 |
0.154 |
|
Baffle/Conduit |
- |
1.91±0.77 |
2.97±1.97 |
- |
- |
0.175 |
- |
|
LPA |
1.24±0.21 |
1.53±0.26 |
1.70±0.21 |
0.046 |
0.005 |
0.015 |
0.015 |
|
RPA |
1.16±0.13 |
1.46±0.24 |
1.61±0.28 |
0.008 |
0.014 |
0.108 |
0.006 |
The value of IQ/EQ in the HV was the highest among the interrogation points in each Fontan circuit. The IQ/EQ of the HV in APC did not show significant differences compared with those of the other vessels; however, the IQ/EQs of the HV in LT and ECC showed significant differences compared with those of all the other interrogation points (both
p<0.05) (
Fig. 4).
 | Fig. 4Comparisons of IQ/EQ of hepatic vein with those of SVC plus IVC and LPA plus RPA in APC, LT, and ECC. IQ/EQ, inspiratory flow rate/expiratory flow rate; SVC, superior vena cava; IVC, inferior vena cava; LPA, left pulmonary artery; RPA, right pulmonary artery; APC, atriopulmonary connection; LT, lateral tunnel; ECC, extracardiac conduit.
|
Go to :
DISCUSSION
The IDE can obtain good quality Doppler spectral images without limitations of waveform distortions caused by poor intercept angle or poor tissue penetration in transthoracic or transesophageal Doppler echocardiography. Also the IDE makes accurate flow analysis possible through direct intravascular Doppler measurement whereas MRI does not permit appropriate flow analysis due to respiratory fluctuation and intrathoracic metal substances. However, IDE has the disadvantage of invasive measurement, although the invasiveness may not be a problem in patients who undergo scheduled cardiac catheterization for other reasons: we have revealed in a previous study that the IDE is an effective modality to investigate flow characteristics in post-Fontan patients.
4
AV and VTI represent average flow velocity and flow size; VTI also reflects flow volume if diameter differences of blood vessels are ignorable.
5 The PIx accounts for the degree of velocity changes according to cardiac cycle.
6 The RVI reflects the influence of respiratory movements on the observed or calculated parameters.
7 We designed NAFI to reflect the sum of forward and backward flows, which determined the size of effective forward flow throughout the cardiac cycles and respiratory phases.
8 Q (MFR) reflected the amount of blood volume according to a given unit of time, and inspiratory/expiratory blood flow ratio (IQ/EQ) represented the change of blood flow according to the respiratory cycle.
9 These parameters were designed so that the AV, VTI, and Q reflect flow characteristics, the NAFI reflects flow efficiency, the PIx reflects influence of cardiac cycle, and the RVI and IQ/EQ reflect respiratory influence on blood flow characteristics. It was reported that the LT and ECC Fontan groups (TCPC) had less pulsations in the pulmonary artery than the pulsatile Fontan group (APC) on echocardiography and magnetic resonance images.
1011 We investigated PIx to estimate the degree of pulsatility, and our results showed that PIx was highest in APC, followed by LT and ECC. In other words, pulsatility was most influential in the APC Fontan patients and the least influential in the ECC Fontan patients. Therefore, among TCPC patients, cardiac pulsatility was less influential in the ECC Fontan, compared to the LT Fontan, and furthermore, APC Fontan was more influenced by cardiac pulsatility than TCPC.
Classic trans-atrial Fontan (APC) is characterized by energy inefficiency due to a seesaw pattern of forward flow and reverse flow.
12 Large hepatic pulsatility and reverse flow caused by atrial contraction in APC Fontan are associated with hepatic complications positively correlated with increased HV pressure.
1314 Protein-losing enteropathy seems to be associated with venous and lymphatic congestions in the splanchnic circulation, and the protein-losing enteropathy is positively correlated with increased IVC pressure.
1516 Changes in HV and IVC flow by atrial contraction in APC Fontan can be classified into two patterns as prominent pulsatility and creation of negative reversal. Our results showed that the PIxs of the HV and IVC in APC were prominent, compared with other types of Fontan circuit and that they showed significant increases in APC, compared with those of the other measurement points. Therefore, more pulsatility of the HV and IVC in APC Fontan circuit may lead to reverse flow and pressure stress, which may potentially expose patients to the development of Fontan complications.
Less pulsatile characteristics of TCPC can increase the pulmonary arterial pressure and vascular resistance, and the pulsatile source of antegrade pulmonary blood flow has a potential benefit of PA growth.
17 Our results showed that the PIx of the LPA and RPA in LT and ECC Fontan circuits showed significantly less pulsatilities than the PIx in APC. Theoretically, less pulsatility of the LPA and RPA in TCPC may potentially be associated with endothelial dysfunction
18 and this may cause a resultant increase of pulmonary vascular resistance in the long-term. Systemic and hepatic venous flow in TCPC Fontan were markedly dependent on the respiratory cycle, whereas those in APC Fontan were dependent on the cardiac cycle.
19 TCPC Fontan circuit might be superior to APC Fontan in terms of pulmonary hemodynamics because the inspiratory drive permits blood to be sucked into the lungs.
20 We investigated RVI to estimate the dependence of respiration. Our results, which followed similar patterns to those of previous studies, showed that RVI in TCPC significantly increased, compared with those in APC, in all vessels.
1920 Moreover, the RVI between LT and ECC did not show statistically significant differences in all interrogation points. Therefore, our study has reestablished the fact that TCPC Fontan influenced by the respiratory cycle (particularly inspiratory drive) can supply more efficient forward circulations into the lungs than APC Fontan. On the other hand, TCPC Fontan circuit can more easily be compromised in the clinical setting of respiratory depression because pulmonary circulation in TCPC Fontan circuit is more dependent on respiratory drive.
It is known that flow velocities in TCPC Fontan are significantly higher, less variable, and unidirectional than those in APC Fontan. The percentage uni-directionality of flow (PUF) has been represented as follows:
21
In the present study, NAFI was represented as follows:
The PUF in the previous study may have similarities to NAFI in our study in terms of estimating the degree of forward flow, although mathematical measurements were different. Our results showed that NAFI in TCPC and ECC were prominently increased, compared with those in APC and in LT Fontan respectively, and that NAFI during inspiration is prominent, compared with that during expiration in all Fontan groups. Therefore, inspiratory drive in TCPC Fontan circuits may provide efficient forward force in Fontan circulation.
Inspiration has important influences on infra-diaphragmatic venous return in TCPC Fontan, and the resting flow of the IVC in TCPC has been found to be greater during inspiration than during expiration.
2223 We investigated the ratio of inspiratory and expiratory blood flows (IQ/EQ) as a parameter of the inspiratory effect. Our investigation showed similar patterns to those of previous studies. The IQ/EQ in TCPC showed significant increases, compared with the IQ/EQ in APC, in most vessels. Therefore, our results confirm that TCPC Fontan is more influenced by respiration than APC Fontan and that the inspiratory forward flow makes TCPC circulation more efficient than APC Fontan.
ECC Fontan has several advantages over LT Fontan, particularly in terms of energy efficiency.
1224 The definite difference between LT and ECC Fontan tract is the method of anastomosing the IVC to the PA: baffle in LT and conduit in ECC. We compared the values between the baffle of LT and conduit of ECC in terms of the PIx, RVI, NAFI, and IQ/EQ. Our results showed that the RVI and total and inspiratory NAFIs in the conduit of ECC significantly increased, and the expiratory NAFI and IQ/EQ insignificantly increased, compared with those in the baffle of LT. Further, the PIxs in the conduit of ECC regardless of the respiratory cycles decreased compared with the PIxs in the baffle of LT despite the statistically insignificant differences. Therefore, the conduit of ECC Fontan is less influenced by pulsatility and more influenced by respiration and has a more efficient forward tract than the baffle of LT Fontan. Although a simple comparison of the conduit of ECC with the baffle of LT would not be a representative comparison of ECC Fontan and LT Fontan, it can partially explain the Fontan hemodynamics.
This study has several limitations. Determination of blood flow characteristics using intravascular Doppler ultrasonography may have inherent problems of echocardiography including potential intra- and inter-observer variability. Also, geometrical variations in shape and spatial relationship of the actual vessels and conduits, which may introduce hemodynamic biases, were not considered in application to mathematical equations for data collection. However, we tried to maximize the accuracy of data for each parameter by obtaining Doppler spectrals with optimal Doppler intercept angles and positioning at all measurement points. Also, we obtained multiple (at least 5) Doppler spectrals in observed vessels and/or conduits, discarded minimal and maximal values, and averaged the rest of the values.
Our study revealed that cardiac pulsatility is less influential in TCPC than the APC Fontan and the least influential in the ECC Fontan in TCPC. More pulsatility of the HV in APC group according to the atrial contraction may lead to resultant reverse flow and pressure stress, which may potentially expose the patients prone to development of Fontan complications, such as Fontan hepatopathy. On the other hand, theoretically, less pulsatility of the LPA and RPA in TCPC may potentially be associated with endothelial dysfunction with resultant increases in pulmonary vascular resistance in the long term. Also, pulmonary circulation in patients after TCPC type palliation with higher respiratory dependency may more easily be compromised in the clinical setting of depressed respiratory efforts, such as positive pressure ventilation. In terms of flow efficiency, TCPC type Fontan circuits are more efficient than APC Fontan circuit.
There have been a few studies on differential flow characteristics in different types of Fontan circulation including our study.
4 Previous studies have found that flow patterns vary according to the types of Fontan circuit, which may have clinical impact on management after Fontan-type operation. However even though the difference in flow patterns could be compared between groups of different Fontan circuit, there has been no clinically useful quantitative parameter(s) to characterize the flow pattern in a given patient and it might frequently have been difficult to translate the study findings in individual patient, as substantial proportion of patients have mixed features of typical flow patterns in different Fontan circuit. We conducted this study to evaluate the flow characteristics of different Fontan circuits as well as to develop and verify parameters to characterize flow patterns that can be used for strategic management and establishing clinical decision in real practice. This study differs in many aspects from our previous preliminary study already published. First of all, the subject and study period are different. We performed this study with a new dataset, excluding data from patients with exaggerated or depressed respiratory influence on flow patterns, and collected further data from patients with appropriate respiratory effort during IDE study with refined techniques, overcoming the initial learning period in IDE measurements. As a result, the majority of subjects (22/35) in this study are different from the population studied in our previous study. This study is also unique in terms of measurement and analysis tools. We used novel parameters that were designed to reflect the influences of cardiac/respiratory cycles and flow efficiency, such as PIx, RVI, NAFI, MFR and IQ/EQ, instead of simple primary values from Doppler measurements in our preliminary study (e.g., AV and VTI), Moreover, this study suggests the quantitative parameters by means of NAFI and Q (MFR) to explain flow efficiencies of Fontan circuits, whereas our previous study only used the reverse flows of AV and VTI to explain them. Lastly, the analysis methods of raw data are also different. Our previous study analyzed mean values of several consecutive cardiac waves during total inspiratory phase or total expiratory phase. However, the current study focuses on isolated values of maximal and minimal value during total respiratory phase particularly in PIx and RVI.
In conclusion, patients with different types of Fontan circulation show different hemodynamic characteristics in various territories of the Fontan circuit, which may lead to different risks for long-term complications. We believe that the novel parameters developed in this study may be used to determine flow characteristics and serve as a clinical basis of management in patients after Fontan operations.
Go to :


 PDF
PDF ePub
ePub Citation
 Print
Print


 XML Download