Journal List > Yonsei Med J > v.60(1) > 1109196

Uhm, Oh, Cho, Park, Kim, Jin, Bae, Yu, Kim, Pak, Lee, Joung, and Kang: Left Ventricular End-Systolic Volume Can Predict 1-Year Hierarchical Clinical Composite End Point in Patients with Cardiac Resynchronization Therapy

Abstract

Purpose

This study aimed to elucidate which echocardiographic criteria at three time points, for cardiac resynchronization therapy (CRT) response, are accurate in discriminating the hierarchical clinical composite end point (HCCEP).

Materials and Methods

We included 120 patients (age, 66.1±12.6 years; men, 54.2%) who underwent CRT implantation for heart failure (HF). Echocardiography was performed before and at 3, 6, and 12 months after CRT implantation. The 1-year HCCEP included all-cause mortality, hospitalization for HF, and New York Heart Association functional class for 12 months. CRT response criteria were decrease in left ventricular (LV) end-systolic volume (LVESV) >15%, decrease in LV end-diastolic volume >15%, absolute increase in LV ejection fraction (LVEF) ≥5%, relative increase in LVEF ≥15%, and decrease in mitral regurgitation ≥1 grade. Temporal changes in CRT response rates, accuracy of CRT response criteria at each time and cutoff value for the discrimination of improvement in HCCEP, and agreements with improvement in HCCEP were analyzed.

Results

HCCEP improvement rates were 65.8% in total group. In nonischemic group, CRT response rates according to all echocardiographic criteria significantly increased with time. In ischemic group, CRT response rate did not significantly change with time. In total group, ΔLVESV at 6 months (ΔLVESV6) had the most significant accuracy for the discrimination of HCCEP (area under the curve=0.781). The optimal cutoff value of ΔLVESV6 was 13.5% (sensitivity=0.719, specificity=0.719). ΔLVESV6 had fair agreement with HCCEP (κ=0.391, p<0.001).

Conclusion

ΔLVESV6 is the most useful echocardiographic CRT response criterion for the prediction of 1-year HCCEP.

INTRODUCTION

Cardiac resynchronization therapy (CRT) is an important therapeutic option for patients with heart failure (HF) and left ventricular (LV) dyssynchrony.12 However, approximately onethird of patients do not respond to CRT. The definition of CRT response is challenging. Although several clinical, echocardiographic, and hemodynamic criteria have been suggested, how and when to define CRT response remains controversial. Recently, many researchers have used changes in LV end-systolic volume (LVESV) at 6 or 12 months as CRT response criteria. However, there is a lack of evidence confirming that change in LVESV is a clinically useful criterion for the determination of CRT response. The ultimate goals of HF treatment are to relieve symptoms, maintain clinical stability, and prevent cardiovascular mortality. Therefore, clinical outcomes are important end points for the evaluation of HF treatment. However, it is difficult to apply event-driven clinical criteria, including hard end points, to an individual patient in daily clinical practice. Echocardiography is widely used to assess cardiac function in HF clinic. Therefore, it is important to elucidate which echocardiographic CRT response criteria have significant accuracy to enable discrimination of symptoms and clinical outcomes. The echocardiographic criteria that provide significant accuracy for the discrimination of clinical outcomes might be predictors of long-term prognosis in patients receiving CRT. The hierarchical clinical composite end point (HCCEP) was designed for the assessment of clinical course of HF by combining symptoms, clinical stability, and mortality3 and is recognized to be suitable for the evaluation of new drugs, devices, and procedures for HF management. The present study aimed to elucidate which echocardiographic CRT response criteria at three time points are significantly accurate in discriminating improvement in 1-year HCCEP and have significant agreement with improvement in 1-year HCCEP, as well as to determine the optimal cutoff value for improvement in 1-year HCCEP.

MATERIALS AND METHODS

Study population and HCCEP

The study design was approved by the Institutional Review Board (IRB no. 1-2013-0061), and the current study was performed in compliance with the ethical principles outlined in Declaration of Helsinki. We included 120 consecutive patients (mean age, 66.1±12.6 years; men, 54.2%) in Severance CRT registry who underwent CRT implantation for HF from January 2010 to June 2017. CRT implantation was performed in accordance with the guidelines for HF management: LV ejection fraction (LVEF) ≤35%, QRS duration ≥130 ms, and New York Heart Association (NYHA) functional class II, III, or ambulatory IV despite optimal medical therapy for ≥3 months.12 Patients lost to follow-up within 12 months after CRT implantation or in whom CRT device was removed within 12 months were excluded. At implantation, CRT was optimized based on the intracardiac electrogram from CRT leads. After CRT implantation, patients were followed up at the outpatient clinic every 3 months, and optimal medical therapy for HF was maintained. At every visit, patients' symptoms and NYHA functional class were assessed, and CRT interrogation and optimization based on the intracardiac electrogram were performed. The 1-year HCCEP included all-cause mortality, hospitalization for HF, and change in NYHA functional class for 12 months since CRT implantation. Patients were classified into improved, unchanged, and worsened, based on the 1-year HCCEP.3 Patients were considered to have improved if they experienced improvement in NYHA functional class and did not experience mortality and hospitalization for HF. Moreover, patients were considered to have worsened if they experienced mortality due to any cause, hospitalization for HF, or worsening in NYHA functional class. Finally, patients were considered to have remained unchanged if they did not either improve or worsen (i.e., had no change in their symptoms and did not experience mortality and hospitalization for HF).

Echocardiography

Transthoracic echocardiography was performed before and at 3 (range: 2–4), 6 (range: 5–7), and 12 (range: 10–14) months after CRT implantation. LV end-diastolic volume (LVEDV) and LVESV were measured using biplane disc method from apical 4- and 2-chamber views. LVEF was calculated as (LVEDV−LVESV)×100/LVEDV. Mitral regurgitation (MR) was graded as mild, moderate, and severe based on Doppler echocardiography using the standard criteria provided by American Society of Echocardiography.4 The symbol Δ at t months was defined as difference between values at t months after CRT implantation and before CRT implantation. Absolute ΔLVEF at t months was defined as (LVEF at t months)−(LVEF before CRT implantation). Relative ΔLVEF at t month was defined as [(LVEF at t month)−(LVEF before CRT implantation)]×100/(LVEF before CRT implantation). ΔLVESV, ΔLVEDV, absolute ΔLVEF, relative ΔLVEF, and ΔMR at 3, 6, and 12 months were measured and calculated. The echocardiographic CRT response criteria were follows: decrease in LVESV >15%,567 decrease in LVEDV >15%,5 absolute increase in LVEF ≥5%,58 relative increase in LVEF ≥15%,910 and decrease in MR ≥1 grade.1112

Statistical analyses of data

Results are expressed as median (interquartile range) for continuous data and number and percentage for categorical data. Patients were divided into two groups according to the cause of HF: nonischemic and ischemic groups. We compared the clinical parameters between both groups using Fisher's exact test for categorical data, and Mann-Whitney U test for continuous data. Temporal trends in CRT response rates according to echocardiographic criteria were analyzed in total, nonischemic, and ischemic groups. The generalized linear model for repeated measures was used for the analyses of temporal changes in CRT response rates. Bonferroni correction was used for post-hoc analyses. The area under the curve (AUC) in receiver operating characteristics (ROC) curve was used to analyze the accuracy of echocardiographic CRT response criteria at 3, 6, and 12 months for discrimination of improvement from no improvement (no change and worsening) in HCCEP. AUC was expressed as area [95% confidence interval (CI)]. An AUC >0.75 was considered clinically significant. The optimal cutoff value of echocardiographic CRT response criteria was estimated based on the probability that the combination of sensitivity and specificity was maximized in the model. The echocardiographic CRT response criteria were analyzed for agreement with improvement in HCCEP using Cohen's κ coefficient. A κ statistic ≤0 was considered poor agreement; 0<κ≤0.2, slight agreement, 0.2<κ≤0.4, fair agreement; 0.4<κ≤0.6, moderate agreement; 0.6<κ≤0.8, substantial agreement; 0.8<κ<1.0, almost perfect agreement; and 1, perfect agreement.13 A p value <0.05 was considered significant. Data were analyzed using Statistical Package for the Social Sciences, version 23.0 (IBM Corp., Armonk, NY, USA).

RESULTS

Study population

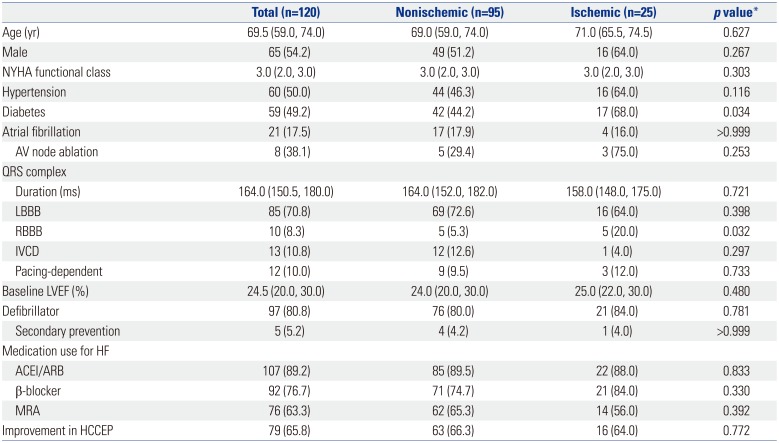
Table 1 shows baseline characteristics and HCCEP of patients in total, nonischemic, and ischemic groups. Nonischemic and ischemic groups comprised 95 (79.2%) and 25 (20.8%) patients, respectively. The prevalence of diabetes and right bundle branch block was significantly higher in ischemic group than in nonischemic group. No significant differences in other baseline characteristics were observed between nonischemic and ischemic groups. Follow-up echocardiography was performed at 3, 6, and 12 months in 110, 97, and 94 patients, respectively. In total group, improvement, no change, and worsening rates of HCCEP after CRT implantation were 65.8, 3.3, and 30.8%, respectively. Furthermore, 6.7, 13.3, and 25.8% of patients experienced all-cause mortality, hospitalization for HF, and aggravation in the NYHA functional class for 12 months. No patient underwent heart transplantation within 12 months after CRT implantation. There were no significant differences in the rate of improvement in HCCEP between nonischemic and ischemic groups.

Temporal changes in CRT response

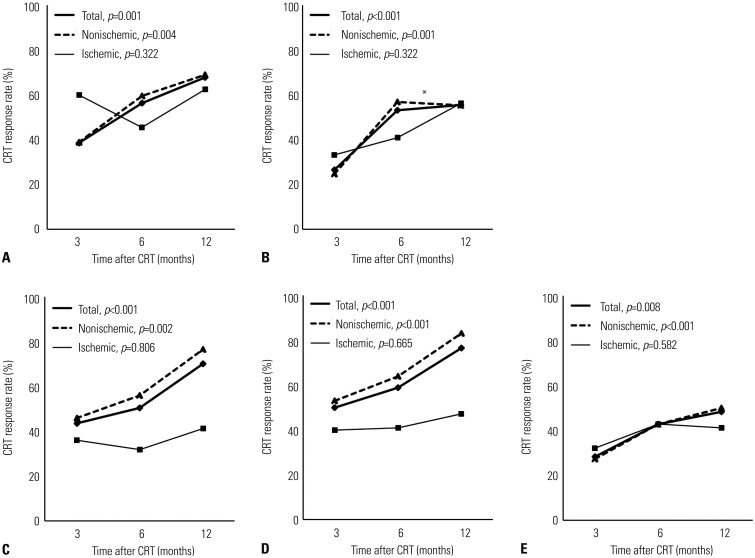
Fig. 1 shows the temporal changes in CRT response rates according to echocardiographic criteria at 3, 6, and 12 months in total, nonischemic, and ischemic groups. In total group, CRT response rates according to all echocardiographic criteria significantly increased with time up to 12 months after CRT implantation. CRT response rates at 12 months were 67.8, 55.6, 70.2, 76.6, and 48.4% according to ΔLVESV, ΔLVEDV, absolute ΔLVEF, relative ΔLVEF, and ΔMR, respectively. In nonischemic group, CRT response rates according to all echocardiographic criteria significantly increased with time up to 12 months, except for the CRT response rate according to ΔLVEDV from 6 to 12 months. CRT response rates at 12 months were 68.9, 55.4, 76.6, 83.1, and 50.0%, according to ΔLVESV, ΔLVEDV, absolute ΔLVEF, relative ΔLVEF, and ΔMR, respectively. In ischemic group, CRT response rates according to any echocardiographic criteria did not significantly change with time up to 12 months. CRT response rates at 12 months were 62.5, 56.3, 41.2, 47.1, and 41.2% according to ΔLVESV, ΔLVEDV, absolute ΔLVEF, relative ΔLVEF, and ΔMR, respectively.

Accuracy and optimal cutoff value of echocardiographic CRT response criteria for the discrimination of 1-year HCCEP

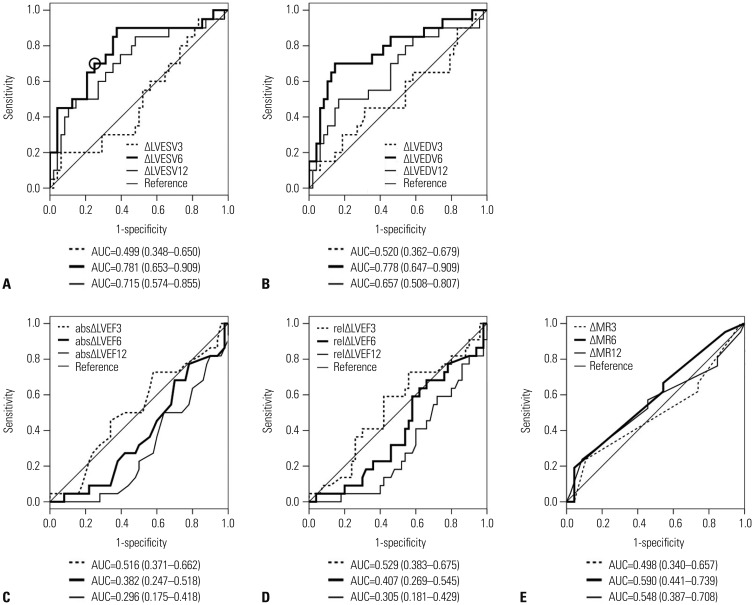
In total group, ΔLVESV and ΔLVEDV at 6 months showed clinically significant accuracy for the discrimination of improvement in 1-year HCCEP [AUC=0.781 (95% CI, 0.653–0.909) and 0.778 (95% CI, 0.647–0.909), respectively] (Fig. 2). In nonischemic group, ΔLVEDV and ΔLVESV at 6 months showed clinically significant accuracy [AUC=0.776 (95% CI, 0.620–0.931) and 0.756 (95% CI, 0.594–0.918), respectively] (Supplementary Table 1, only online). In ischemic group, ΔLVESV at 6 and 12 months showed clinically significant accuracy [AUC=0.875 (95% CI, 0.683–1.000) and 0.792 (95% CI, 0.548–1.000), respectively] (Supplementary Table 1, only online). Other echocardiographic CRT response criteria did not show clinically significant accuracy. Since ΔLVESV at 6 months had the largest AUC among all echocardiographic CRT response criteria in total group, the cutoff value of ΔLVESV at 6 months for the discrimination of improvement in 1-year HCCEP was estimated and determined to be 13.5%, which provided the maximized combination of sensitivity and specificity (0.719 and 0.719, respectively) (Fig. 2A). When the cutoff value of ΔLVESV at 6 months was set as 15%, sensitivity and specificity were 0.687 and 0.719, respectively.

Agreement of echocardiographic CRT response criteria with 1-year HCCEP

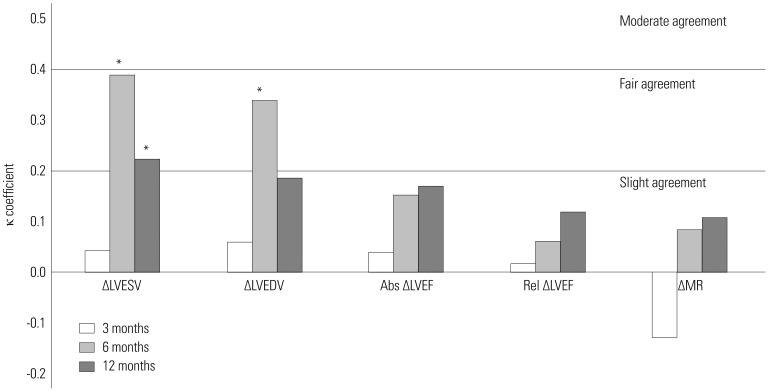
Fig. 3 shows the agreements of echocardiographic CRT response criteria at 3, 6, and 12 months with improvement in 1-year HCCEP in total group. In total group, ΔLVESV and ΔLVEDV at 6 months had significantly fair agreement with improvement in 1-year HCCEP (κ=0.391, p<001 and κ=0.340, p=0.001, respectively). Similarly, ΔLVESV at 12 months had significantly fair agreement (κ=0.223, p=0.034). In nonischemic group, ΔLVESV and ΔLVEDV at 6 months had significantly fair agreement (κ=0.363, p=0.002, and κ=0.376, p=0.001, respectively) (Supplementary Table 2, only online). In ischemic group, ΔLVESV at 3 and 6 months had significantly fair and moderate agreement, respectively (κ=0.373, p=0.039, and κ=0.468, p=0.019, respectively) (Supplementary Table 2, only online). However, absolute ΔLVEF, relative ΔLVEF, and ΔMR at any time did not have any significant agreement with improvement in 1-year HCCEP in total, nonischemic, and ischemic groups.

DISCUSSION

This was a cohort study using real-world CRT registry data. The main findings of the present study are as follows: 1) In nonischemic group, CRT response rates increased with time up to 12 months since CRT implantation. 2) In contrast, in ischemic group, CRT response rates were static with time. 3) In total group, ΔLVESV at 6 months had the most clinically significant accuracy for the discrimination of improvement in 1-year HCCEP. 4) The optimal cutoff value of ΔLVESV at 6 months for the discrimination of improvement in 1-year HCCEP was 13.5%. 5) ΔLVESV at 6 months had fair agreement with improvement in 1-year HCCEP.
According to Frank-Starling law, stroke volume increases in response to an increase in preload. However, if preload is excessively increased beyond the appropriate range, stroke volume decreases. If preload is decreased to the appropriate range, stroke volume can be recovered. CRT can restore intraventricular, interventricular, and atrioventricular synchrony through timely biventricular pacing. Restoration of synchrony can result in improved cardiac performance and output, which, in turn, can lead to a decrease in LVESV and LVEDV or reverse remodeling. Moreover, reverse remodeling can lead to an additional improvement in cardiac performance, since preload decreases to the appropriate range. Delayed CRT response might occur as the interactions between cardiac performance and reverse remodeling can last for several weeks or months. According to the results of the present study, CRT response rates increased with time in patients with nonischemic HF but were static in patients with ischemic HF. In other words, CRT response tended to be delayed and early in patients with nonischemic and ischemic HF, respectively. The reason for these temporal patterns of CRT response is not clear. A previous study reported that greater myocardial scar burden might be related to incidence of delayed CRT response.14 Although myocardial scarring was not measured in this study, a tentative explanation for the temporal changes in CRT response in nonischemic and ischemic HF could be that nonischemically failing heart probably has diffuse myocardial fibrosis, whereas ischemically failing heart probably has regional myocardial fibrosis. Diffuse myocardial fibrosis might be related to delayed CRT response. Contrary to the results of this study, a previous study reported no significant difference in the time course of CRT response between nonischemic and ischemic HF.15 Another study indicated that ischemic HF was a predictor of late LV reverse remodeling.16 Since temporal CRT response patterns and their mechanisms remain controversial, more studies need to be conducted.
Controversy exists as to when to assess CRT response. The present study suggested that the appropriate time to assess CRT response is 6 months after CRT implantation. This may be due to reverse remodeling lasting for several weeks or months. The reason behind the lower accuracy and agreement of ΔLVESV at 12 months with HCCEP than those at 6 months in patients with nonischemic HF, despite an increase in CRT response rate, is unclear. Approximately half of patients with nonischemic HF who became responders between 6 and 12 months had worsening HCCEP owing to hospitalization for HF. The insignificant agreement of ΔLVESV at 12 months in patients with ischemic HF might be attributed to the small number of patients. In summary, it is reasonable that CRT response should be assessed at 6 months after CRT implantation in patients with nonischemic and ischemic HF.
The definitions of CRT response were not consistent across several large clinical trials on CRT. In early clinical trials on CRT, symptomatic and clinical outcome criteria, including hospitalization for HF and mortality, have been studied as CRT outcomes.7171819 In later studies, echocardiographic, hemodynamic, and neurohormonal criteria were also investigated as CRT outcomes.12171920 Several studies have been performed to evaluate agreements among CRT response criteria. PROSPECT study reported that CRT response rate according to clinical composite score was higher than that according to change in LVESV.6 Another study indicated poor agreements among clinical and echocardiographic CRT response criteria.21 When improvement in NYHA functional class and CRT response according to echocardiographic criteria were compared, patients with improved NYHA functional class and no echocardiographic response mainly contributed to the disagreement.5
HCCEP is a composite end point that combines symptoms, clinical stability, and mortality within a certain period in patients with HF.3 HCCEP is not a scoring system that includes arbitrary weights to clinical factors. Patients with HF can be comprehensively classified according to whether they exhibited improvement, no change, and worsening using HCCEP after a certain period of HF treatment. Therefore, HCCEP can be a standard end point for the assessment of CRT response criteria.6
In the present study, ΔLVESV at 6 months was the most clinically useful echocardiographic CRT response criterion, since it had the largest AUC in ROC curve for the discrimination of improvement in 1-year HCCEP and had fair agreement with improvement in 1-year HCCEP. As the optimal cutoff value of ΔLVESV at 6 months was 13.5% in ROC curve, the usage of 13.5% as the cutoff value of ΔLVESV in clinical practice and studies is reasonable. An improvement in LV synchrony and systolic function directly leads to a decrease in LVESV. Reverse remodeling means decreases in LVESV and LVEDV. Therefore, change in LVESV is linked to both LV systolic function and reverse remodeling. This could be the reason why ΔLVESV is significantly associated with clinical outcomes and most relevant echocardiographic CRT response criteria. In contrast, LVEDV is not directly related to LV systolic function. Although ΔLVEDV at 6 months had higher accuracy and agreement than ΔLVESV at 6 months in patients with nonischemic HF, the use of ΔLVESV would be feasible. This is due to the necessity to use the same criteria in nonischemic and ischemic HF.
The reason for poor agreement of absolute and relative ΔLVEF is not clear. The likely explanations are as follows. Measurements of LVEDV and LVESV using biplane disc method are dependent on geometric assumptions. Ignorable differences between geometric assumption and real geometry, and ignorable measurement errors could be included in echocardiographic measurements. Since LVEF was calculated using LVEDV and LVESV, the ignorable differences and errors might have been summated and become unignorable while calculating LVEF. Generally, as HF progresses, LV is dilated. LV dilation results in functional (or secondary) MR. As a result, functional MR severity can be associated with HF severity. However, it is occasionally difficult to discriminate functional MR from organic (or primary) MR that is not caused by LV dilation. Additionally, in patients with no or trivial MR before CRT implantation, the ΔMR criterion cannot differentiate CRT responders from patients with a steady state. In the present study, 33.3% of patients in total group had no MR before CRT implantation. The low CRT response rate according to the ΔMR criterion and the poor accuracy and agreement of ΔMR could be attributed to the inclusion of a considerable number of patients with no or trivial MR or those with organic MR.
The present study has several limitations. This was a cohort study using real-world CRT registry data, rather than a prospective study. The number of patients was not large; in particular, the number of patients with ischemic HF was small. Objective measurements of patients' functional capacity, including the 6-min walking test, cardiopulmonary exercise test, and quality-of-life score, were not included since these were serially performed in only a small number of patients. All patients did not undergo echocardiography three times. QRS morphology (true left bundle branch block or not), LV lead position, and percentage of biventricular pacing were not included in the analyses despite being important factors for the determination of CRT response.
In conclusion, a decrease in LVESV at 6 months >13.5% is the most clinically useful echocardiographic CRT response criterion for the prediction of 1-year HCCEP.

Notes

The authors have no potential conflicts of interest to disclose.

References

1. Ponikowski P, Voors AA, Anker SD, Bueno H, Cleland JGF, Coats AJS, et al. 2016 ESC Guidelines for the diagnosis and treatment of acute and chronic heart failure: The Task Force for the diagnosis and treatment of acute and chronic heart failure of the European Society of Cardiology (ESC) developed with the special contribution of the Heart Failure Association (HFA) of the ESC. Eur Heart J. 2016; 37:2129–2200. PMID: 27206819.
2. Yancy CW, Jessup M, Bozkurt B, Butler J, Casey DE Jr, Colvin MM, et al. 2017 ACC/AHA/HFSA focused update of the 2013 ACCF/AHA Guideline for the management of heart failure: a report of the American College of Cardiology/American Heart Association Task Force on Clinical Practice Guidelines and the Heart Failure Society of America. Circulation. 2017; 136:e137–e161. PMID: 28455343.
crossref
3. Packer M. Development and evolution of a hierarchical clinical composite end point for the evaluation of drugs and devices for acute and chronic heart failure: a 20-year perspective. Circulation. 2016; 134:1664–1678. PMID: 27881506.
4. Zoghbi WA, Enriquez-Sarano M, Foster E, Grayburn PA, Kraft CD, Levine RA, et al. Recommendations for evaluation of the severity of native valvular regurgitation with two-dimensional and Doppler echocardiography. J Am Soc Echocardiogr. 2003; 16:777–802. PMID: 12835667.
crossref
5. Bleeker GB, Bax JJ, Fung JW, van der, Zhang Q, Schalij MJ, et al. Clinical versus echocardiographic parameters to assess response to cardiac resynchronization therapy. Am J Cardiol. 2006; 97:260–263. PMID: 16442375.
crossref
6. Chung ES, Leon AR, Tavazzi L, Sun JP, Nihoyannopoulos P, Merlino J, et al. Results of the predictors of response to CRT (PROSPECT) trial. Circulation. 2008; 117:2608–2616. PMID: 18458170.
crossref
7. Moss AJ, Hall WJ, Cannom DS, Klein H, Brown MW, Daubert JP, et al. Cardiac-resynchronization therapy for the prevention of heart-failure events. N Engl J Med. 2009; 361:1329–1338. PMID: 19723701.
crossref
8. Bax JJ, Marwick TH, Molhoek SG, Bleeker GB, van Erven L, Boersma E, et al. Left ventricular dyssynchrony predicts benefit of cardiac resynchronization therapy in patients with end-stage heart failure before pacemaker implantation. Am J Cardiol. 2003; 92:1238–1240. PMID: 14609610.
crossref
9. Gorcsan J 3rd, Tanabe M, Bleeker GB, Suffoletto MS, Thomas NC, Saba S, et al. Combined longitudinal and radial dyssynchrony predicts ventricular response after resynchronization therapy. J Am Coll Cardiol. 2007; 50:1476–1483. PMID: 17919568.
crossref
10. Suffoletto MS, Dohi K, Cannesson M, Saba S, Gorcsan J 3rd. Novel speckle-tracking radial strain from routine black-and-white echocardiographic images to quantify dyssynchrony and predict response to cardiac resynchronization therapy. Circulation. 2006; 113:960–968. PMID: 16476850.
crossref
11. Achilli A, Peraldo C, Sassara M, Orazi S, Bianchi S, Laurenzi F, et al. Prediction of response to cardiac resynchronization therapy: the selection of candidates for CRT (SCART) study. Pacing Clin Electrophysiol. 2006; 29(Suppl 2):S11–S19. PMID: 17169127.
crossref
12. Abraham WT, Fisher WG, Smith AL, Delurgio DB, Leon AR, Loh E, et al. Cardiac resynchronization in chronic heart failure. N Engl J Med. 2002; 346:1845–1853. PMID: 12063368.
crossref
13. Landis JR, Koch GG. The measurement of observer agreement for categorical data. Biometrics. 1977; 33:159–174. PMID: 843571.
crossref
14. Li K, Qian Z, Hou X, Wang Y, Qiu Y, Sheng Y, et al. The incidence and outcomes of delayed response to cardiac resynchronization therapy. Pacing Clin Electrophysiol. 2018; 41:73–80. PMID: 29222875.
crossref
15. Marsan NA, Bleeker GB, van Bommel RJ, Ypenburg C, Delgado V, Borleffs CJ, et al. Comparison of time course of response to cardiac resynchronization therapy in patients with ischemic versus nonischemic cardiomyopathy. Am J Cardiol. 2009; 103:690–694. PMID: 19231335.
crossref
16. Viveiros Monteiro A, Martins Oliveira M, Silva Cunha P, Nogueira da Silva M, Feliciano J, Branco L, et al. Time to left ventricular reverse remodeling after cardiac resynchronization therapy: Better late than never. Rev Port Cardiol. 2016; 35:161–167. PMID: 26923367.
crossref
17. Higgins SL, Hummel JD, Niazi IK, Giudici MC, Worley SJ, Saxon LA, et al. Cardiac resynchronization therapy for the treatment of heart failure in patients with intraventricular conduction delay and malignant ventricular tachyarrhythmias. J Am Coll Cardiol. 2003; 42:1454–1459. PMID: 14563591.
crossref
18. Bristow MR, Saxon LA, Boehmer J, Krueger S, Kass DA, De Marco T, et al. Cardiac-resynchronization therapy with or without an implantable defibrillator in advanced chronic heart failure. N Engl J Med. 2004; 350:2140–2150. PMID: 15152059.
crossref
19. Cleland JG, Daubert JC, Erdmann E, Freemantle N, Gras D, Kappenberger L, et al. The effect of cardiac resynchronization on morbidity and mortality in heart failure. N Engl J Med. 2005; 352:1539–1549. PMID: 15753115.
crossref
20. Young JB, Abraham WT, Smith AL, Leon AR, Lieberman R, Wilkoff B, et al. Combined cardiac resynchronization and implantable cardioversion defibrillation in advanced chronic heart failure: the MIRACLE ICD Trial. JAMA. 2003; 289:2685–2694. PMID: 12771115.
crossref
21. Fornwalt BK, Sprague WW, BeDell P, Suever JD, Gerritse B, Merlino JD, et al. Agreement is poor among current criteria used to define response to cardiac resynchronization therapy. Circulation. 2010; 121:1985–1991. PMID: 20421518.
crossref

SUPPLEMENTARY MATERIALS

Supplementary Table 1

AUC of the Echocardiographic CRT Response Criteria at Each Time for Discrimination of 1-Year Hierarchical Clinical Composite End Point
ymj-60-48-s001.pdf

Supplementary Table 2

Agreement of Each Echocardiographic CRT Response Criteria at Each Time with 1-Year Hierarchical Clinical Composite End Point
ymj-60-48-s001.pdf
Fig. 1

Temporal changes in CRT response rates according to (A) ΔLVESV, (B) ΔLVEDV, (C) absolute ΔLVEF, (D) relative ΔLVEF, and (E) ΔMR in total, nonischemic, and ischemic groups. p values indicate the statistical significance of temporal changes in CRT response rates according to each echocardiographic CRT response criterion in each group from 3 to 12 months. *The temporal change in CRT response, based on ΔLVEDV from 6 to 12 months, in nonischemic group is insignificant in post-hoc analysis. CRT, cardiac resynchronization therapy; LVEDV, left ventricular end-diastolic volume; LVEF, left ventricular ejection fraction; LVESV, left ventricular end-systolic volume; MR, mitral regurgitation.

ymj-60-48-g001
Fig. 2

Receiver operating characteristic curve and area under the curve of (A) ΔLVESV, (B) ΔLVEDV, (C) absolute ΔLVEF, (D) relative ΔLVEF, and (E) ΔMR for the discrimination of improvement in 1-year hierarchical clinical composite end point in total group. When the optimal cutoff value of ΔLVESV at 6 months is set as 13.5% (circle), sensitivity and specificity are 0.719 and 0.719, respectively. abs, absolute; AUC, area under the curve; LVEDV, left ventricular end-diastolic volume; LVEF, left ventricular ejection fraction; LVESV, left ventricular end-systolic volume; MR, mitral regurgitation; rel, relative.

ymj-60-48-g002
Fig. 3

Agreements of echocardiographic CRT response criteria at each time with improvement in 1-year hierarchical clinical composite end point in total group. *p<05. Abs, absolute; CRT, cardiac resynchronization therapy; LVEDV, left ventricular end-diastolic volume; LVEF, left ventricular ejection fraction; LVESV, left ventricular end-systolic volume; MR, mitral regurgitation; Rel, relative.

ymj-60-48-g003
Table 1

Baseline Characteristics and 1-Year HCCEP of the Study Population
ymj-60-48-i001
Total (n=120) Nonischemic (n=95) Ischemic (n=25) p value*
Age (yr) 69.5 (59.0, 74.0) 69.0 (59.0, 74.0) 71.0 (65.5, 74.5) 0.627
Male 65 (54.2) 49 (51.2) 16 (64.0) 0.267
NYHA functional class 3.0 (2.0, 3.0) 3.0 (2.0, 3.0) 3.0 (2.0, 3.0) 0.303
Hypertension 60 (50.0) 44 (46.3) 16 (64.0) 0.116
Diabetes 59 (49.2) 42 (44.2) 17 (68.0) 0.034
Atrial fibrillation 21 (17.5) 17 (17.9) 4 (16.0) >0.999
 AV node ablation 8 (38.1) 5 (29.4) 3 (75.0) 0.253
QRS complex
 Duration (ms) 164.0 (150.5, 180.0) 164.0 (152.0, 182.0) 158.0 (148.0, 175.0) 0.721
 LBBB 85 (70.8) 69 (72.6) 16 (64.0) 0.398
 RBBB 10 (8.3) 5 (5.3) 5 (20.0) 0.032
 IVCD 13 (10.8) 12 (12.6) 1 (4.0) 0.297
 Pacing-dependent 12 (10.0) 9 (9.5) 3 (12.0) 0.733
Baseline LVEF (%) 24.5 (20.0, 30.0) 24.0 (20.0, 30.0) 25.0 (22.0, 30.0) 0.480
Defibrillator 97 (80.8) 76 (80.0) 21 (84.0) 0.781
 Secondary prevention 5 (5.2) 4 (4.2) 1 (4.0) >0.999
Medication use for HF
 ACEI/ARB 107 (89.2) 85 (89.5) 22 (88.0) 0.833
 β-blocker 92 (76.7) 71 (74.7) 21 (84.0) 0.330
 MRA 76 (63.3) 62 (65.3) 14 (56.0) 0.392
Improvement in HCCEP 79 (65.8) 63 (66.3) 16 (64.0) 0.772

ACEI, angiotensin converting enzyme inhibitor; ARB, angiotensin receptor blocker; AV, atrioventricular; HCCEP, hierarchical clinical composite end point; HF, heart failure; IVCD, intraventricular conduction delay; LBBB, left bundle branch block; LVEF, left ventricular ejection fraction; MRA, mineralocorticoid receptor antagonist; NYHA, New York Heart Association; RBBB, right bundle branch block.

Data are expressed as median (interquartile range) or number (percent).

*Comparison between nonischemic and ischemic groups.

TOOLS
Similar articles