Abstract
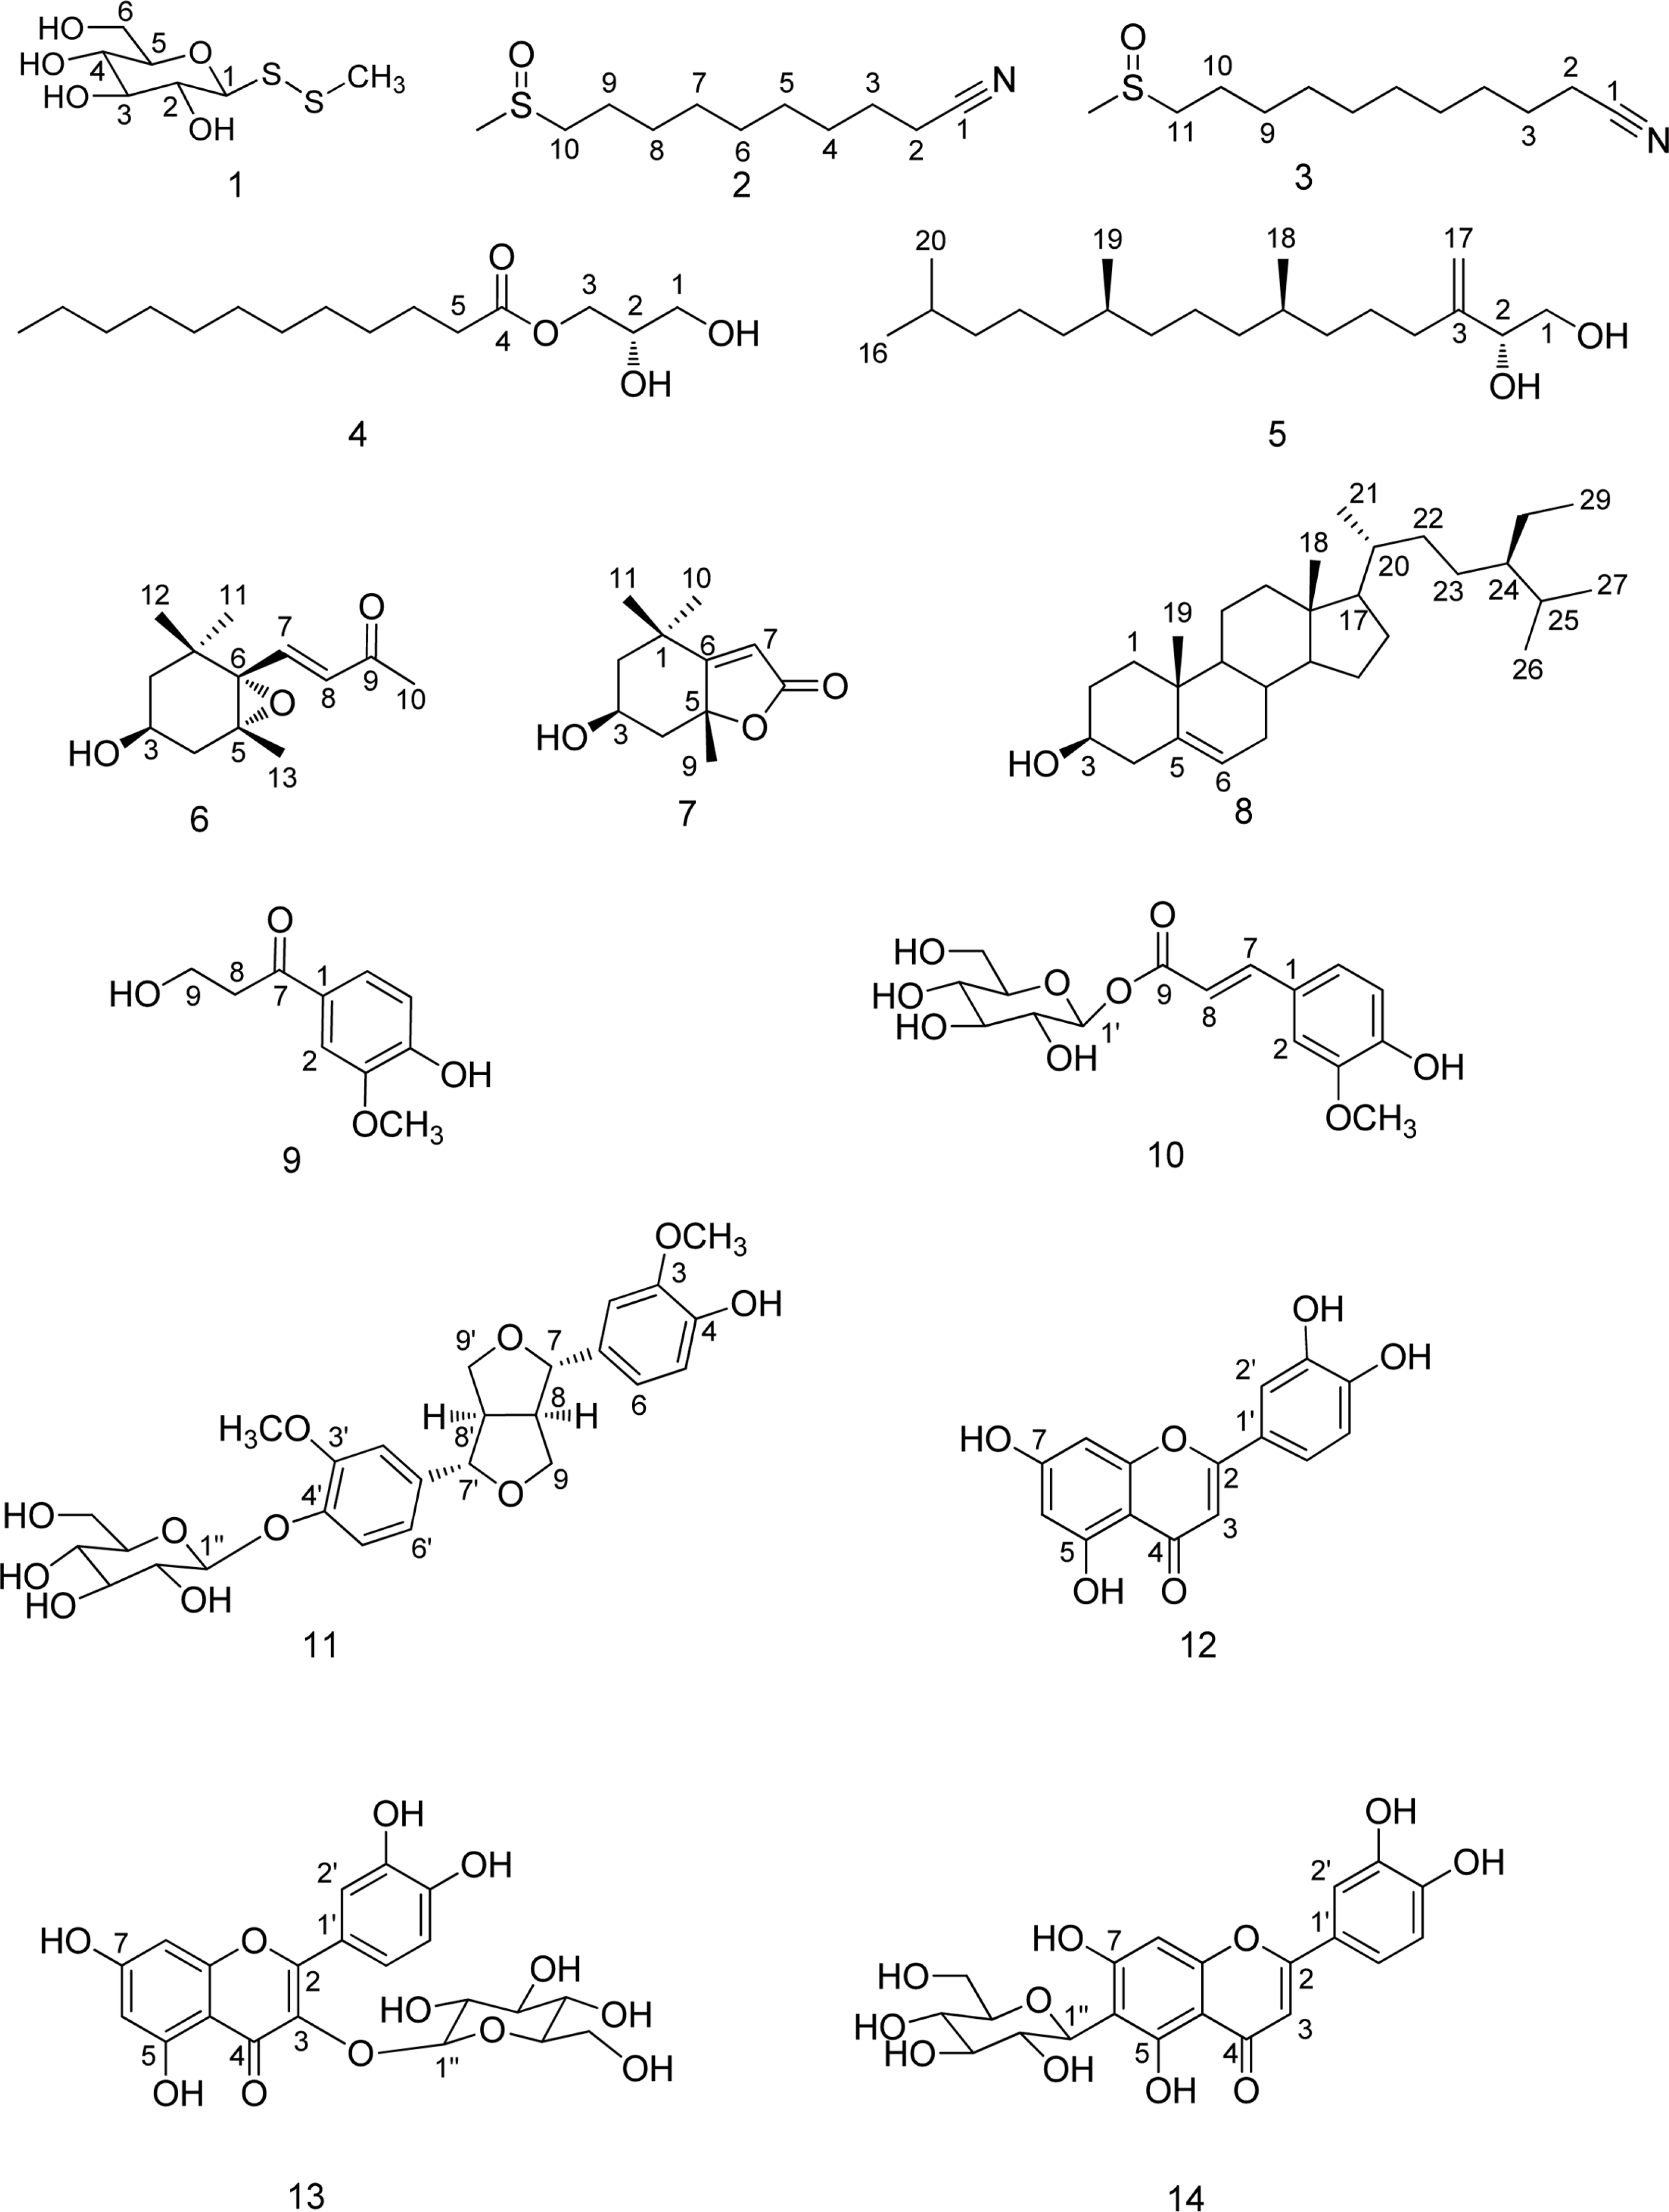
Phytochemical investigation of 80% MeOH extract of the aerial parts of Capsella bursa-pastoris yielded fourteen compounds (1 – 14). The structures of the compounds were elucidated by spectroscopic methods to be methyl-1-thio-β-D-glucopyranosyl disulfide (1), 10-methylsulphinyl-decanenitrile (2), 11-methyl-sulphinyl-undecanenitrile (3), 1-O-(lauroyl)glycerol (4), phytene-1, 2-diol (5), (3S, 5R, 6S, 7E)-5,6-epoxy-3-hydroxy-7-megastigmen-9-one (6), loliolide (7), β-sitosterol (8), 3-hydroxy-1-(4-hydroxy-3-methoxyphenyl)-1-propanone (9), 1-feruloyl-β-D-glucopyranoside (10), pinoresinol-4'-O-β-D-glucopyranoside (11), luteolin (12), quercetin-3-O-β-D-glucopyranoside (13), and luteolin 6-C-β-glucopyranoside (14). Although compound 1 was reported as synthetic compound, 1 was first isolated from natural source. NMR spectral data assignments of 1, 2 and 3 were reported for the first time, and compounds 1 – 14 were for the first time reported from this plant source. The antiinflammatory effects of 1 – 14 were evaluated in lipopolysaccharide (LPS)-stimulated murine microglia BV-2 cells. Compounds 12 exhibited strong inhibitory effects on nitric oxide production in LPS-activated BV-2 cells with IC50 values of 9.70 µM.
Go to : 
References
(1). Lee Y.N.; Flora of Korea; Kyohaksa: Korea,. 1996. ;p. 250.
(2). Song N.., Xu W.., Guan H.., Liu X.., Wang Y.., Nie X.Asian. J. Tradit. Med. 2007. 2:218–222.
(3). Grosso C.., Vinholes J.., Silva L. R.., de Pinho P. G.., Gonçalves R. F.., Valentão P.., Jäger A. K.., Andrade P. B.Braz. J. Pharmacog. 2011. 21:635–644.
(4). Selenu M. B.., Carrus, F.;Bonsignore L.Boll. Chim. Farm. 2005. 144:66–78.
(5). Park C. J.., Park C. B.., Hong S. S.., Lee H. S.., Lee S. Y.., Kim S. C.Plant Mol.Biol. 2000. 44:187–197.

(6). Kuroda K.., Akao M.Jpn. J. Cancer. Res. 1981. 72:777–782.
(7). Kuroda K.., Akao M.Jpn. J. Cancer. Res. 1975. 66:461–462.
(8). Cha J. M.., Suh W. S.., Lee T. H.., Subedi L.., Kim S. Y.., Lee K. R.Molecules. 2017. 22:1023.
(9). Reif D. W.., McCreedy S. A.Arch. Biochem. Biophys. 1995. 320:170–176.
(10). Batovska D. I.., Tsubota S.., Kato Y.., Asano Y.., Ubukata M.Tetrahedron. 2004. 15:3551–3559.
(11). Wong H. F.., Brown G.D. J.Chem. Res. 2002. 5:30–33.
(12). Duan H.., Takaishi Y.., Momota H.., Ohmoto Y.., Taki T.Phytochemistry. 2002. 59:85–90.
(13). Kimura J.., Maki N. J.Nat. Prod. 2002. 65:57–58.
(14). Chang Y. C.., Chang F. R.., Wu Y. C. J.Chin. Chem. Soc. 2000. 47:373–380.
(15). Achenbach H.., Stöcker M.., Constenla M. A.Phytochemistry. 1988. 27:1835–1841.
(16). Kim J. S.., Kwon Y. S.., Sa Y. J.., Kim M. J. J.Agric. Food. Chem. 2011. 59:138–144.
(17). Kim D. K.., Lim J. P.., Kim J. W.., Park H. W.., Eun J. S.Arch. Pharm. Res. 2005. 28:39–43.
(18). Li Y. L.., Li J.., Wang N. L.., Yao X. S.Molecules. 2008. 13:1931–1941.
(19). Kajjout M.., Rolando C.Tetrahedron. 2011. 67:4731–4741.
(20). Rayyan S.., Fossen T.., Nateland H. S.., Andersen Ø. M.Phytochem. Anal. 2005. 16:334–341.
(21). Gamblin D. P.., Garnier P.., van Kasteren S.., Oldham N. J.., Fairbanks A. J.., Davis B. G.Angew. Chem. Int. Ed. 2004. 43:828–833.
(22). Angles d'Ortoli T.., Widmalm G.Tetrahedron. 2016. 72:912–927.
(23). Rep ak M.., Imrich J.., Pihlaja K.., Kal'atová M.Phytochemisty c. 1998. 47:1219–1221.
Go to : 
Table 1.
| Position | 1 | |
|---|---|---|
| δH (J in Hz) | δC | |
| 1 | 4.37 d (9.4) | 92.3 |
| 2 | 3.50m | 72.8 |
| 3 | 3.40t (8.8) | 79.6 |
| 4 | 3.30 m | 71.6 |
| 5 | 3.30 m | 82.61 |
| 6 | 3.64 dd (12.0, 5.5) | 63.2 |
| 3.86 dd (12.0, 1.8) | 63.2 | |
| S-CH3 | 2.50 m | 24.9 |
Table 2.
Table 3.
Effects of compounds 1 – 14 on NO production in LPS-activated BV-2 cells
| Compound | IC50a (mM) | Cell viability b (%) |
|---|---|---|
| 1 | 44.10 | 118.28 ± 6.54 |
| 2 | 75.23 | 136.44 ± 5.13 |
| 3 | 144.64 | 117.91 ± 8.44 |
| 4 | 32.60 | 136.20 ± 11.20 |
| 5 | 153.71 | 152.92 ± 3.50 |
| 6 | 167.24 | 117.44 ± 2.83 |
| 7 | >500 | 114.70 ± 8.48 |
| 8 | 77.12 | 119.36 ± 6.1 |
| 9 | 259.50 | 135.42 ± 10.68 |
| 10 | 63.55 | 112.15 ± 2.94 |
| 11 | 266.61 | 107.41 ± 2.63 |
| 12 | 9.70 | 137.66 ± 3.11 |
| 13 | 77.17 | 119.36 ± 6.13 |
| 14 | 146.69 | 120.36 ± 3.88 |
| cL-NMMA | 17.40 | 110.21 ± 4.56 |
a The IC50 value of each compound was defined as the concentration (μM) that caused 50% inhibition of NO production in LPS-activated BV-2 cells;


 PDF
PDF ePub
ePub Citation
 Print
Print


 XML Download