

 PDF
PDF ePub
ePub Citation
 Print
Print


Abstract
Purpose
The purpose of this study was to compare the difference of body mass index (BMI) to smart phone proficiency in men and women over the age of 60.
Methods
Patients were divided into three groups with high (n=33), average (n=34), and low (n=33) smart phone proficiency. Fitness characteristics related to smart phone usage were evaluated by measuring cardiorespiratory endurance, grip strength, eye-hand coordination. As well, smart phone proficiency was evaluated by a self-reported questionnaire and a smart phone usability task that was composed of two categories: usage of the smartphone device itself and usage of phone applications. The differences in BMI of the subjects was analyzed by analysis of covariance adjusting for independent variables including age, smartphone usage period, eye-hand coordination, education and income.
Results
There was a significant difference in BMI among the three groups after adjustment of age, eye-hand coordination, smartphone usage period, education and income. The results showed that the self-reported questionnaire showed a significant difference in BMI between high proficiency and low proficiency groups (high 24.88±2.46, low 23.37±2.56; p=0.037). Smart phone usability test results also showed a significant difference in BMI among the three groups (high 25.18±2.58, low 23.15±2.6; p=0.000 and high 25.18±2.58, middle 23.57.7±1.69; p=0.010).
Figures and Tables
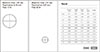 | Fig. 1Eye hand coordination task. This task measures smartphone reaction time, touch error (or touch accuracy) and calculates the average (Avg) value of each value.
|
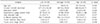
Table 1
General and physical characteristics of the subjects according to proficiency of smartphone usage
![]()
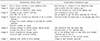
Table 3
The difference of body mass index according to self-reported IT equipment proficiency results

Values are presented as mean±standard deviation. These results account for adjusted age, eye-hand coordination and reaction time, education level, income, and Smartphone usage period.
*p<0.05 for the difference between low and high groups; †p<0.05 for the difference between middle and high groups; ‡Total score shows added scores for Internet, computer, and smartphone usage ability.
![]()


References
1. Noh BS, Ahn SY, Ahn HS, Nam GS, Lee JW. Technology trends and forecasts based on smart content classification. Korea Inst Inf Technol Mag. 2012; 10:97–110.
2. Pew Research Center. Smartphones are more common in Europe, U.S., less so in developing countries [Internet]. Washington (DC): Pew Research Center;2016. cited 2018 Nov 19. Available from: http://www.pewglobal.org/2016/02/22/smartphone-ownership-and-internet-usage-continues-to-climbin-emerging-economies/technology-report-01-02b/.
3. Kakihara M. Mobile apps in APAC: 2016 report [Internet]. Think with Google;2016. cited 2018 Nov 19. Available from: http://apac.thinkwithgoogle.com/articles/mobile-apps-in-apac-2016-report.html.
4. Boulos MN, Wheeler S, Tavares C, Jones R. How smartphones are changing the face of mobile and participatory healthcare: an overview, with example from eCAALYX. Biomed Eng Online. 2011; 10:24.

5. Ahmad RW, Gani A, Hamid SH, Xia F, Shiraz M. A review on mobile application energy profiling: taxonomy, state-ofthe-art, and open research issues. J Netw Comput Appl. 2015; 58:42–59.
6. Pejovic V, Musolesi M. Anticipatory mobile computing: a survey of the state of the art and research challenges. ACM Comput Surv. 2015; 47:1–29.
7. Hwang KH, Yoo YS, Cho OH. Smartphone overuse and upper extremity pain, anxiety, depression, and interpersonal relationships among college students. J Korea Contents Assoc. 2012; 12:365–375.
8. Choi D. Physical activity level, sleep quality, attention control and self-regulated learning along to smartphone addiction among college students. J Korea Acad Ind Coop Soc. 2015; 16:429–437.
9. Paek KS. A convergence study the association between addictive smart phone use, dry eye syndrome, upper extremity pain and depression among college students. J Korea Converg Soc. 2017; 8:61–69.
10. Choi DJ, Jung B. 2011 The report on the digital divide for the elderly [Internet]. Seoul (KR): National Information Society Agency;2012. cited 2018 Nov 19. Available from: https://nia.or.kr/site/nia_kor/ex/bbs/View.do?cbIdx=81623&bcIdx=6724.
11. Namu Wiki. Feature phone [Internet]. Asuncion (PY): Namu Wiki;2018. cited 2018 Oct 3. Available from: https://namu.wiki/w/%ED%94%BC%EC%B2%98%ED%8F%B0.
12. Kim JT, Son CY, GO EH, Ryu SS, Kim BS, Choi JA. 2016 The report on the digital divide [Internet]. Seoul (KR): National Information Society Agency;2017. cited 2018 Nov 19. Available from: http://www.nia.or.kr/site/nia_kor/ex/bbs/View.do?cbIdx=81623&bcIdx=18397&parentSeq=18397.
13. de Rezende LF, Rey-Lopez JP, Matsudo VK, do Carmo Luiz O. Sedentary behavior and health outcomes among older adults: a systematic review. BMC Public Health. 2014; 14:333.
14. de Rezende LF, Rodrigues Lopes M, Rey-Lopez JP, Matsudo VK, Luiz Odo C. Sedentary behavior and health outcomes: an overview of systematic reviews. PLoS One. 2014; 9:e105620.
15. Matthews CE, Chen KY, Freedson PS, et al. Amount of time spent in sedentary behaviors in the United States, 2003-2004. Am J Epidemiol. 2008; 167:875–881.
16. Korea Centers for Disease Control and Prevention. Korea Health Statistics 2015: Korea National Health and Nutrition Examination Survey (KNHANES VI-3). Cheongju: Korea Centers for Disease Control and Prevention;2015.
17. Ministry of Culture, Sports and Tourism. 2014 The report on national leisure activities [Internet]. Sejong (KR): Ministry of Culture, Sports and Tourism;2015. cited 2018 Nov 19. Available from: http://www.mcst.go.kr/web/s_policy/dept/dept-View.jsp?pMenuCD=0406000000&pSeq=1562.
18. Matthews CE, George SM, Moore SC, et al. Amount of time spent in sedentary behaviors and cause-specific mortality in US adults. Am J Clin Nutr. 2012; 95:437–445.
19. Yoon HJ. Television watching and depression symptoms in later life: an interdisciplinary approach to the leisure cultures and lives of older Korean adults. Korea Sci Art Forum. 2015; 21:313–323.
20. Owen N, Sparling PB, Healy GN, Dunstan DW, Matthews CE. Sedentary behavior: emerging evidence for a new health risk. Mayo Clin Proc. 2010; 85:1138–1141.
21. Dunstan DW, Barr EL, Healy GN, et al. Television viewing time and mortality: the Australian Diabetes, Obesity and Lifestyle Study (AusDiab). Circulation. 2010; 121:384–391.
22. Thorp AA, Healy GN, Owen N, et al. Deleterious associations of sitting time and television viewing time with cardiometabolic risk biomarkers: Australian Diabetes, Obesity and Lifestyle (AusDiab) study 2004-2005. Diabetes Care. 2010; 33:327–334.
23. Grontved A, Hu FB. Television viewing and risk of type 2 diabetes, cardiovascular disease, and all-cause mortality: a meta-analysis. JAMA. 2011; 305:2448–2455.
24. Jung YC. KISDI STAT report: possibility of smartphone and TV competition media [Internet]. Jincheon (KR): Korea Information Society Development Institute;2017. cited 2018 Nov 19. Available from: https://www.kisdi.re.kr/kisdi/common/premium?file=1%7C14016.
25. Lepp A, Barkley JE, Sanders GJ, Rebold M, Gates P. The relationship between cell phone use, physical and sedentary activity, and cardiorespiratory fitness in a sample of U.S. college students. Int J Behav Nutr Phys Act. 2013; 10:79.
26. Tremblay MS, Colley RC, Saunders TJ, Healy GN, Owen N. Physiological and health implications of a sedentary lifestyle. Appl Physiol Nutr Metab. 2010; 35:725–740.
27. Hartley AA, Little DM. Age-related differences and similarities in dual-task interference. J Exp Psychol Gen. 1999; 128:416–449.
28. Crossley M, Hiscock M. Age-related differences in concurrent-task performance of normal adults: evidence for a decline in processing resources. Psychol Aging. 1992; 7:499–506.
29. Kim SE, Kim JW, Jee YS. Relationship between smartphone addiction and physical activity in Chinese international students in Korea. J Behav Addict. 2015; 4:200–205.
 XML Download