

 PDF
PDF Citation
 Print
Print


INTRODUCTION
Sarcopenia, defined as loss of skeletal muscle mass, reflects low physical performance and malnutrition.1 It has long been thought that sarcopenia is caused by aging processes or the development of disease,2 and many studies have shown that muscle mass, especially sarcopenia, affects outcomes in chronic diseases and malignancy.34 Because of this, the Centers for Disease Control and Prevention (CDC) and the National Center for Health Statistics (NCHS) have designated a new code for the disease, which is a combination of low muscle mass and weakness.5
Adequate prognostic assessment in patients with liver cirrhosis is difficult because the factors affecting disease progression are diverse e.g., liver function, portal hypertension, cause of the disease, reversibility of the underlying process, and hepatic malignancy.67 In clinical practice, the prognosis has been mainly made using liver function assessed by Child-Pugh (CP) score8 or Model for End-Stage Liver Disease (MELD) score9 and the degree of portal hypertension, represented by the hepatic venous pressure gradient (HVPG).10 These prognostic tools each have their advantages and disadvantages. The CP score has been widely used for prognostic evaluation, but may include subjective factors such as ascites and hepatic encephalopathy, which observers may evaluate differently.11 Although MELD score assesses liver function and renal function objectively, it does not reflect the degree of portal hypertension; hence patients with low MELD scores may have a high mortality rate.7 HVPG is the best indicator of portal hypertension and the best prognosticator for cirrhotic patients, but it does not reflect liver function.1213 One of the most important limitations of all these prognostic tools is that they do not reflect nutritional status and physical performance.7
Sarcopenia is one of the most common features of patients with cirrhosis, and is caused by reduced total energy intake, malabsorption, decreased muscle formation, and increased muscle breakdown.14 It has also been associated with the development of complications such as infection, and reduced quality of life.1516 Furthermore, post-liver transplantation outcomes were worse for patients with sarcopenia than for those without sarcopenia.17 Moreover, sarcopenia is associated with mortality of patients with liver cirrhosis, independent of liver function such as CP score or MELD score.1618 For these reasons, interest in sarcopenia in patients with liver cirrhosis has increased. However, it is not known whether the rate of skeletal muscle depletion, in addition to the presence of sarcopenia, is associated with a poor prognosis in patients with liver cirrhosis. Therefore, we investigated the prognostic impact of the rate of skeletal muscle depletion in patients with liver cirrhosis and compared it with the impacts of CP score, MELD score and HVPG.
METHODS
Patients
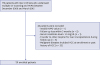
We collected retrospectively from electronic medical records and picture archiving and communication systems a total of 173 patients with liver cirrhosis who underwent multiple computed tomography (CT) scanning and HVPG measurement between December 2009 and March 2015. Liver cirrhosis was diagnosed by liver biopsy or by imaging findings suggestive of cirrhosis, including surface nodularity, or by clinical manifestations of portal hypertension and hepatic decompensation. CT scans were mainly performed for surveillance of hepatocellular carcinoma (HCC). HVPG was performed in patients with high risk varices or signs of decompensation. All patients were in a stable hemodynamic state and not active drinkers. Of the 173 patients, 42 were excluded for the following reasons (Fig. 1): i) invalid HVPG value (n = 1), ii) loss to follow-up within 3 months (n = 2), iii) serum creatinine (sCr) ≥ 1.5 mg/dL (n = 1), iv) transfer to another hospital for liver transplantation (n = 5), v) malignant disease including HCC at enrollment, or past history of HCC (n = 33). Finally, 131 patients were included in the analysis. The last follow-up date was 31st December 2016.
Clinical and laboratory parameters
We collected the following clinical and laboratory data from electronic medical records; age, gender, body mass index (BMI), cause of cirrhosis, history of ascites, variceal bleeding and hepatic encephalopathy, platelet (PLT) count, serum albumin, serum total bilirubin, prothrombin time (international normalized ratio [INR]), sCr, and serum sodium. Blood samples were taken less than 1 day after HVPG, and MELD was calculated from the same samples.
Measurement of SMA on CT scans, and diagnosis of sarcopenia
All patients underwent initial CT scans within 2 months of their initial laboratory examinations and HVPG measurement. Transverse CT images at the level of the third lumbar vertebra (L3) were used to evaluate skeletal muscle area (SMA), and these are known to represent whole-body skeletal muscle mass accurately.19 The authors of this study used self-produced image analysis software, which permits measurement of tissue demarcation by Hounsfield units (HU) within the drawn boundary, to measure the cross-sectional areas of skeletal muscles (cm2). Skeletal muscle was identified and quantified using HU thresholds of −29 to 150.20 The skeletal muscles at the L3 level consist of the psoas, erector spinae, quadratus lumborum, transversus abdominis, internal oblique, external oblique and rectus abdominis. The skeletal muscle index (SMI) was defined as muscle mass area/height (cm2/m2). Sarcopenia was defined by sex-specific cut-offs of ≤ 52.4 cm2/m2 in men and ≤ 38.5 cm2/m2 in women.1621 The SMA of the initial CT scans and the final CT scans during the follow-up period were measured regardless of the interval between both CT scans (mean interval between both CT scans, 37 ± 24 months). The relative change in skeletal muscle area per year (ΔSMA/y) was calculated from the equation: (SMA at final CT scan – SMA at initial CT scan)/SMA at initial CT scan × 100/interval between CT scans (years).22 In this study, 1 quartile, median, and 3 quartile of ΔSMA/y were −2.44%, −0.89%, and 1.15%, respectively. Thus, the patients with ΔSMA/y < −2.4% could be regarded as the high risk group for loss of skeletal muscle mass.
HVPG measurement
HVPG was measured at the outset of the study by a board-certified interventional radiologist with experience of more than 100 HVPG measurements. Briefly, under fluoroscopic guidance, a 6-Fr balloon-tip catheter (Arrow International, Inc., Cleveland, OH, USA) was inserted via a 7-Fr sheath placed in the right internal jugular vein and advanced into the right hepatic vein. The balloon-tip catheter tip was located less than 5 cm from the junction of the right hepatic vein and inferior vena cava (IVC). Free and wedged hepatic venous pressures were measured during balloon deflation and inflation, respectively, using an electronic barometer built into the patient-monitoring equipment (Pulscan-combo; Scionic Co., Ltd., Seoul, Korea). All measurements were performed 3 times and were represented as means. HVPG was determined by subtracting the free hepatic venous pressure from the wedged hepatic venous pressure. The pressure in the IVC at the level of hepatic venous drainage was also measured for comparison with the free hepatic venous pressure, to evaluate whether that measurement was accurate.
Statistical analysis
Categorical and continuous variables are given as frequencies (%) and mean values with standard deviations (SDs), respectively. Spearman's coefficient was used to test the correlation between ΔSMA/y and each parameter. To assess risk factors for long-term mortality, univariate and multivariable Cox proportional hazards models were used. We included in multivariate analysis any variable that is associated with the outcome at a P value of < 0.20 in the univariate analysis, regardless of whether or not the variable has been shown to be associated with the risk factor. However, the variable associated with clinical relevance can be included in multivariate analysis regardless of their statistical significance. The multivariable analysis was performed by backward stepwise regression in to avoid multicollinearity, and cumulative survival rates were calculated by the Kaplan-Meier method. Overall survivals according to the independent risk factors were compared using the log-rank test. Statistical significance in 2-sided tests was defined as P < 0.05. All statistical analyses were performed with SPSS version 18.0 for Windows (SPSS Inc., Chicago, IL, USA).
RESULTS
Baseline characteristics
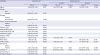
The baseline clinical characteristics and laboratory data of the 131 patients are shown in Table 1. The mean age of the patients was 53.7 years, with men predominating (n = 94, 71.8%). Alcoholic liver disease was the most common cause of cirrhosis (n = 81, 61.8%). A history of decompensation was identified in 115 (87.8%) patients, and 50, 49, and 32 patients were in CP class A, B, and C, respectively. The mean values of CP scores, MELD scores and HVPG were 7.6 ± 2.1, 10.7 ± 4.4, and 15.2 ± 5.6 mmHg, respectively.
Table 1
Baseline characteristics of the study population
Continuous data are expressed as mean ± standard deviation or number (%).
BMI = body mass index, INR = international normalized ratio, AST = aspartate aminotransferase, ALT = alanine aminotransferase, CP = Child-Pugh, MELD = model for end stage liver disease, HVPG = hepatic venous pressure gradient, SMI = skeletal muscle index, ΔSMA/y = change in skeletal muscle area per year.
![]()
Sarcopenia and ΔSMA/y
Mean SMIs in men and women were 50.5 ± 10.1 cm2/m2 and 43.3 ± 7.4 cm2/m2, respectively. Sixty-four patients (48.9%) were diagnosed with sarcopenia, which was more common in men than in women (58.5% vs. 24.3%; P < 0.001). The mean BMI of the patients with sarcopenia was lower than that of those without sarcopenia (P < 0.001). Also, sarcopenia was more common in alcoholic liver cirrhosis than in liver cirrhosis due to other causes (P < 0.001). Serum sodium was significantly lower in the patients with sarcopenia (P = 0.001) but there were no significant differences between patients with and without sarcopenia in age, history of decompensation, CP score, MELD score, HVPG and laboratory parameters other than serum sodium.
The mean ΔSMA/y was −0.88% ± 8.69%. There was no significant difference in ΔSMA/y between patients with sarcopenia and those without sarcopenia. ΔSMA/y was weakly positively correlated with total bilirubin (r = 0.252; P = 0.004), prothrombin time (INR) (r = 0.217; P = 0.013) and MELD score (r = 0.238; P = 0.006), but CP score (r = 0.157; P = 0.074) and HVPG (r = 0.148; P = 0.092) were not significantly correlated with ΔSMA/y (Table 2). The mean ΔCP score/y and ΔMELD score/y were 0.25% ± 2.29% and −0.01% ± 5.40%, respectively. ΔSMA/y was strongly positively correlated with ΔCP score/y (r = 0.643; P < 0.001) and ΔMELD score/y (r = 0.453; P < 0.001).
Table 2
Correlations between ΔSMA/y and other prognostic variables

ΔSMA/y = change in skeletal muscle area per year, BMI = body mass index, INR = International normalized ratio, AST = aspartate aminotransferase, ALT = alanine aminotransferase, CP = Child-Pugh, MELD = model for end stage liver disease, HVPG = hepatic venous pressure gradient, SMI = skeletal muscle index, ΔCP score/y = change in Child-Pugh score per year, ΔMELD score/y = change in MELD score per year.
![]()
Survival of patients with cirrhosis
During a median follow-up period of 46.2 months (range, 3.4–87.6), 45 patients (34.4%) died, and the cumulative survival rates at 1-, 3-, and 5-years were 95.3%, 76.5%, and 62.6%, respectively. The causes of death were liver failure (n = 14), infection (n = 5), HCC (n = 4), variceal bleeding (n = 2) and others (n = 20; 2 cardiac disease, 1 cerebral hemorrhage, 1 lung cancer, and 16 unknown).
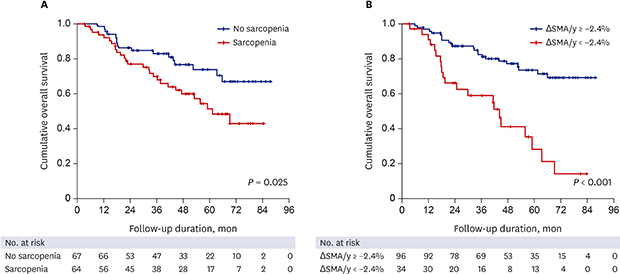
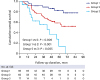
Cumulative survival was significantly higher in patients without sarcopenia than in those with sarcopenia (log-rank test, P = 0.025) (Fig. 2A). Survival rates at 1-, 3-, and 5-years were 98.5%, 82.9%, and 73.7%, respectively, in patients without sarcopenia, and 91.9%, 69.6%, and 51.3%, respectively, in patients with sarcopenia. Also, cumulative survival differed significantly according to the rate of skeletal muscle depletion (log-rank test, P < 0.001) (Fig. 2B). Survival rates at 1-, 3-, and 5-years were 91.0%, 59.0%, and 28.2%, respectively, in patients with ΔSMA/y < −2.4%, and 96.9%, 82.5%, and 73.5%, respectively, in patients with ΔSMA/y ≥ −2.4%.
 | Fig. 2Survival of patients with liver cirrhosis according to various prognostic factors.HVPG = hepatic venous pressure gradient, CP = Child-Pugh, ΔSMA/y = change in skeletal muscle area per year.
|
We also identified other prognostic factors for survival. Survival was significantly higher in patients with CP class A than in those with CP class B or C (log-rank test, P < 0.001) (Fig. 2C). Similarly, the survival of patients with HVPG < 12 mmHg was significantly higher than that of those with HVPG ≥ 12 mmHg (log-rank test, P = 0.034) (Fig. 2D).
Factors predicting mortality in liver cirrhosis
In univariate analysis, serum albumin, PT-INR, serum sodium, CP score, MELD score, HVPG, and sarcopenia were significantly associated with mortality (Table 3). Two models were constructed to avoid collinearity and multivariate analysis was performed (Table 3). In model 1 analysis excluding serum albumin, PT-INR, serum Na and MELD score, age (hazard ratio [HR], 1.04; 95% confidence interval [CI], 1.01–1.08; P = 0.019), CP score (HR, 1.23; 95% CI, 1.05–1.44; P = 0.012), HVPG (HR, 1.08; 95% CI, 1.02–1.15; P = 0.007), presence of sarcopenia (HR, 2.27; 95% CI, 1.17–4.40; P = 0.015) and ΔSMA/y (HR, 0.95; 95% CI, 0.91–0.99; P = 0.010) were independently associated with mortality. In model 2 analysis excluding serum albumin, PT-INR, serum Na and CP score, age (HR, 1.05; 95% CI, 1.01–1.08; P = 0.008), HVPG (HR, 1.11; 95% CI, 1.05–1.18; P < 0.001), presence of sarcopenia (HR, 2.75; 95% CI, 1.44–5.23; P = 0.002) and ΔSMA/y (HR, 0.94; 95% CI, 0.90–0.99; P = 0.013) were independent prognostic factors for mortality.
Table 3
Factors predicting mortality in liver cirrhosis
HR = hazards ratio, CI = confidence interval, INR = international normalized ratio, CP = Child-Pugh, MELD = model for end stage liver disease, HVPG = hepatic venous pressure gradient, ΔSMA/y = change in skeletal muscle area per year, ΔCP score/y = change in Child-Pugh score per year, ΔMELD score/y = change in MELD score per year.
![]()
Survival according to the combination of the presence of sarcopenia and its rate of change
We classified the patients into three group according to the presence of sarcopenia and its rate of change: group 1, patients without sarcopenia & ΔSMI/y ≥ −2.4%; group 2, patients with sarcopenia & ΔSMI/y ≥ −2.4% and those without sarcopenia & ΔSMI/y < −2.4%; and group 3, patients with sarcopenia & ΔSMI/y < −2.4%. There was a significant difference in overall survival according to ΔSMA/y and presence of sarcopenia (Fig. 3). Post hoc analysis was additionally performed to assess the difference in survival for each group. Group 1 and group 2 had significantly higher survival rates than group 3 (P < 0.001 and P = 0.005, respectively) and group 1 had significantly higher survival rates than group 2 (P = 0.006).
DISCUSSION
We have investigated the prognostic impact of the rate of skeletal muscle depletion compared with CP score, MELD score and HVPG in patients with liver cirrhosis. Our findings confirmed other reports that the presence of sarcopenia, as well as conventional prognostic factors reflecting liver function and portal hypertension, were independently associated with long-term survival in patients with liver cirrhosis. Moreover, the rate of change of skeletal muscle mass was also independently associated with prognosis. These results show that not only presence of sarcopenia but also its rate of change are associated with long term mortality of patients with liver cirrhosis, independent of liver function and portal hypertension.
Sarcopenia has been associated with the development of complications such as infection, reduced quality of life, and post liver transplantation outcomes.151617 It is also known to be associated with mortality of patients with liver cirrhosis, independent of liver function such as CP score or MELD score.1618 The mechanism why sarcopenia causes poor prognosis is not clear. However, the skeletal muscle is an organ that secretes many cytokines and peptides. When sarcopenia occurs, it induces hormonal and biochemical alteration and increases circulating endotoxins. This leads to an increased risk of infection due to a decrease in immune function and an increased risk of hepatic encephalopathy.14 Sarcopenia also aggravates the progression of liver fibrosis and increases the development of HCC.15 Therefore, many efforts have been made to improve sarcopenia in patients with cirrhosis. In addition, Hanai et al.22 recently reported that the rate of change of skeletal muscle mass affected the prognosis of cirrhosis patients independent of CP or MELD. Similarly, in this study we evaluated the prognostic impact of skeletal muscle mass change in patients with cirrhosis compared with HVPG, which is known to be the most accurate test for portal hypertension, CP score, and MELD score, and showed that skeletal muscle mass change affected the prognosis of the patients independent of these other predictors. Therefore, in addition to the presence of sarcopenia, evaluating skeletal muscle change may be useful in predicting the prognosis of patients with cirrhosis.
Sarcopenia is more common in patients with cirrhosis than in the general population.23 A gradual loss of skeletal muscle mass occurs in the general population from about 30–40 years of age.2425 This age-related loss has been estimated at about 0.3%–0.8% per year up to the age of 60–70 years, after which the loss increases to 1.5% per year.2425 This study showed that the annual rate of skeletal muscle decline in patients with cirrhosis was 0.89% per year, only slightly higher to that of the general population. On the other hand, Hanai et al.22 reported a skeletal muscle decline of 2.2% per year, which was higher than the rate in this study. The discrepancy between two studies was probably due to the younger age of the patients in this study compared to those of Hanai et al.22 (median age 52 years vs. 65 years). This suggests that muscle weakness may be more severe in older patients with cirrhosis than in the general population. Another reason for this difference could be the fact that the cause of cirrhosis in the study by Hanai et al.22 was mainly hepatitis C, whereas in this study it was mainly alcohol and hepatitis B, and it is likely that most of the cirrhotic patients in the study by Hanai et al.22 might not be treated with direct acting agents against their hepatitis C whereas our patients were treated for the causes of their cirrhosis, by, for example, active abstinence and hepatitis B antiviral therapy, along with nutritional support in the form of branched chain amino acid (BCAA). In this study, 61.8% (n = 81) of patients were prescribed BCAA for at least one month. Further evaluation is needed to determine whether aggressive treatment for the cause of cirrhosis slows the loss of muscle mass.
Although aging is a well-known risk factor of sarcopenia, age was not associated with the presence of sarcopenia in this study. It may be related to the relatively younger mean age (53.7 years) of the subjects in this study. Like this, other studies on clinical relevance of sarcopenia in patients with liver cirrhosis showed similar results.161826 This suggests that sarcopenia in patients with liver cirrhosis seems to be due to severity or etiology of liver disease, malnutrition, or presence of alcohol intake rather than age.
There is also a report that reversal of sarcopenia improves survival and clinical outcome.27 Likewise, the results of this study suggest that efforts to reverse muscle mass loss improve the prognosis of patients with cirrhosis. Therefore, more aggressive treatment is needed to increase muscle mass. Some guidelines recommend high-energy and high-protein diets.2829 However, it is unclear whether nutritional support improves prognosis. A recent meta-analysis showed that the use of BCAA, which is commonly recommended for treatment of sarcopenia, also had no effect on mortality or nutritional parameters.30 However, several other studies have provided evidence that BCAA promotes protein synthesis and prevents proteolysis3132 and long-term BCAA administration with leucine has been shown to improve prognosis and reduce complications such as sarcopenia in patients with liver cirrhosis.263334 Therefore, long-term BCAA administration holds promise for reducing muscle loss in cirrhotic patients.14 Although TIPS has been reported to improve sarcopenia and increase survival, further validation is needed.27 Testosterone and growth hormone have also been proposed as treatments for sarcopenia.3536
Although more than half of patients had decompensated liver disease in this study, the sCr was not associated with mortality. In recent studies, sCr ≥ 1.5 mg/dL is associated with a worse prognosis than a sCr < 1.5 mg/dL in patients with liver cirrhosis and AKI stage 1.3738 Therefore, patients with sCr ≥ 1.5 mg/dL, which is a risk of deteriorating renal function due to the use of contrast in CT scans or HVPG measurement, were excluded in this study. In addition, most of the patients (94.7%; n = 124) had a sCr ≤ 1.0 mg/dL. For these reasons, not only sCr but also MELD score, a significant predictor of mortality in patients with liver cirrhosis, were not predictors of mortality in this study.
This study had several limitations. First, it was a retrospective study involving a relatively small number of patients in a single center. In particular, because of this, the presence of sarcopenia was not associated with the liver function, such as CP or MELD score. Second, there is a possibility of selection bias because only cirrhotic patients who underwent multiple CT scans and HVPG measurement were enrolled. Thirdly, the SMI cutoff level for our patients was based on Western criteria rather than Asian ones. Fourthly, there is a possibility of the interobserver or intraobserver variability for SMA measured by CT. However, most other studies have measured SMA in the same way as in this study and in several studies for intraobserver agreement for SMA measured by CT, the intraobserver coefficient variation was only 1.3%–2.0%.3940 Finally, sarcopenia in this study was evaluated only in terms of muscle mass not muscle function.
In conclusion, both the existence of sarcopenia and its rate of change are associated with long term mortality in patients with liver cirrhosis, independent of liver function and portal hypertension. We therefore suggest that efforts to improve sarcopenia are needed to improve the prognosis of patients with liver cirrhosis.
 XML Download