Journal List > Asian Oncol Nurs > v.18(2) > 1108980

Seo, Ryu, and Young: Relationships among Mood Status, Social Support, Symptom Experience and Quality of Life in Colorectal Cancer Patients - based on the Theory of Unpleasant Symptoms

초록

Purpose

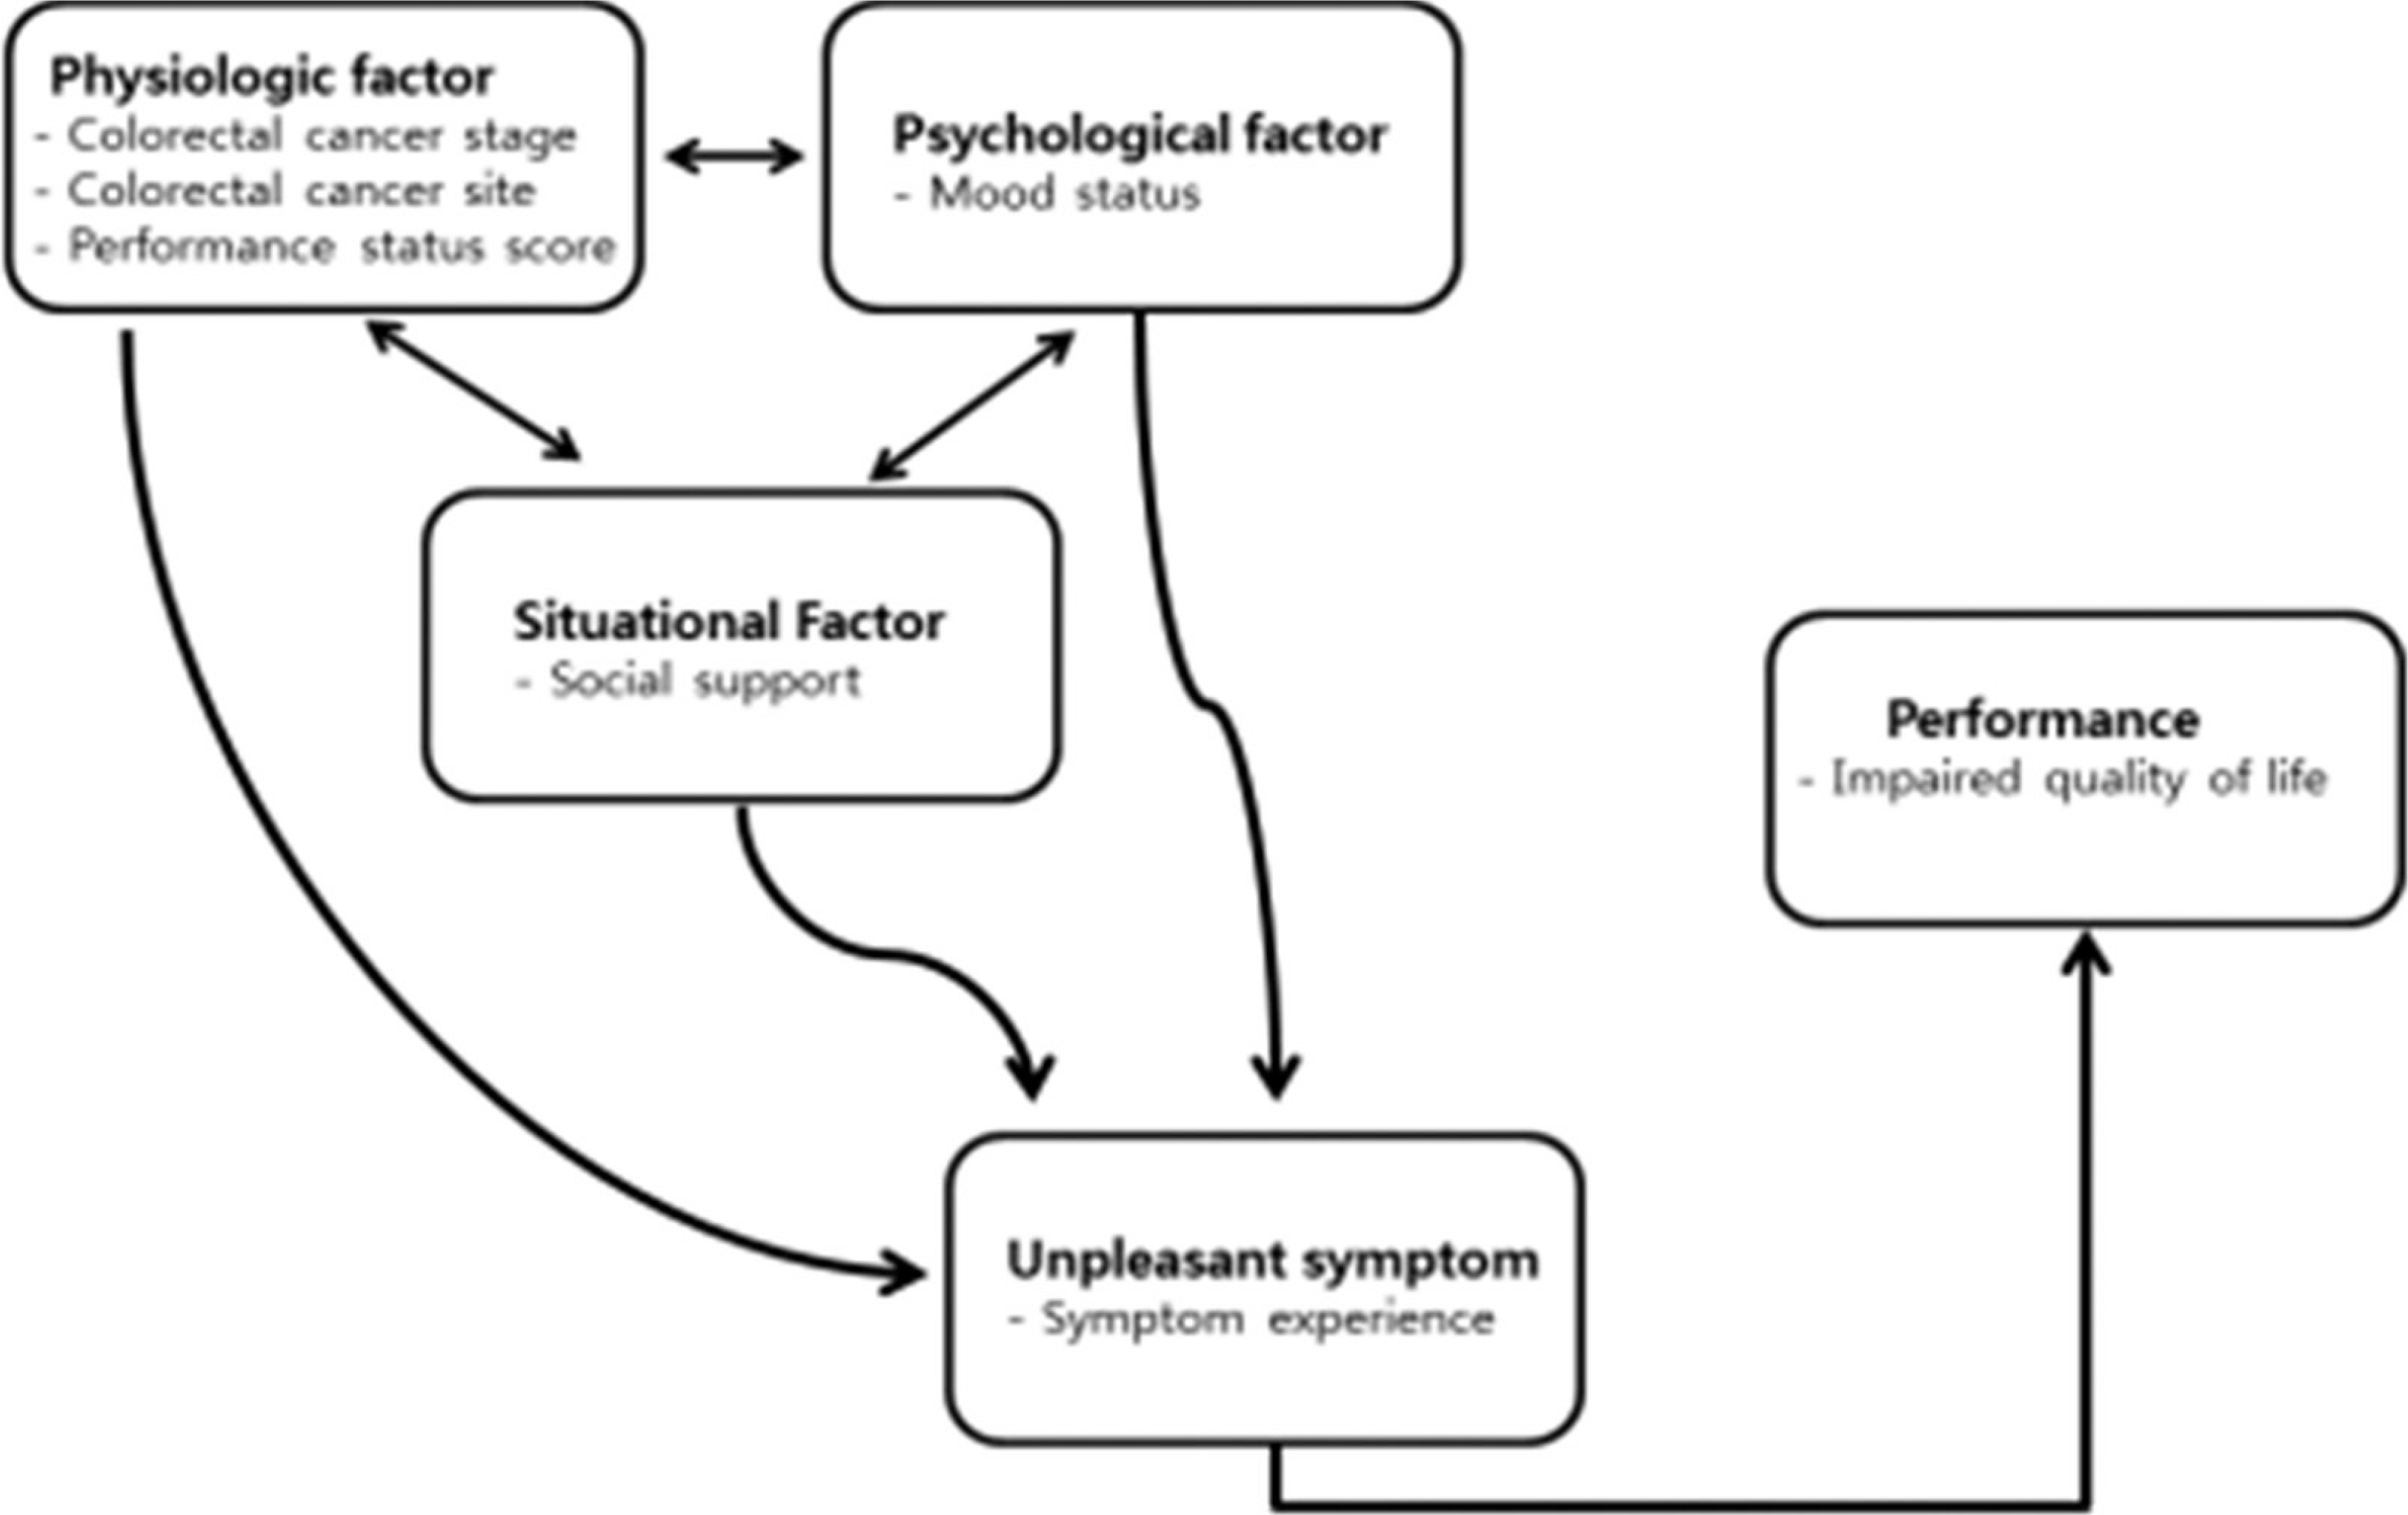
This study is to determine the effects of Colorectal Neoplasms patients’ stage, location of disease, functional status (physio-logical factor), mood (psychological factor), and social support (situational factor) on their symptom experience, and to verify the relationship between symptom experience and the quality of life.

Methods

The Theory of Unpleasant Symptoms was the framework for the study. A descriptive correlational design was used in analysis of data obtained from a sample of 113 Colorectal Neoplasms patients who were undergoing chemotherapy.

Results

Total mood disturbance and symptom experiences were negatively correlated with physical component score (PCS) and mental component score (MCS) of quality of life (r −.33 to r=−.51, p<.001; r=.40 to r=.50, p<.001). Multiple regression analysis revealed that the functional status and symptoms interference variables explained 29.2% of the variance in PCS of quality of life. Symptoms interference and age explained 30.6% of the variance in MCS of quality of life.

Conclusion

Although overall depression levels were low in this sample, these findings suggest that insomnia and fatigue are related to depression and that depression is more closely associated with quality of life than are insomnia and fatigue.

REFERENCES

1. Ferlay J, Soerjomataram I, Dikshit R, Eser S, Mathers C, Rebelo M, et al. Cancer incidence and mortality worldwide: sources, methods and major patterns in GLOBOCAN 2012. Int J Cancer. 2015; 136:E359–86.
crossref
2. National Cancer Information Center (KR). Annual report of cancer statistics in Korean: cancer incidence [Internet]. Available from. https://www.cancer.go.kr/lay1/S1T639C640/contents.do. [Accessed January 9, 2018].
3. Jung KW, Won YJ, Oh CM, Kong HJ, Lee DH, Lee KH, et al. Cancer statistics in Korea: incidence, mortality, survival, and prevalence in 2014. Cancer Res Treat. 2017; 49:292–305.
crossref
4. National Cancer Information Center (KR). Annual report of cancer statistics in Korean: 5-year relative survival rate [Internet]. Available from. https://www.cancer.go.kr/lay1/S1T648C650/contents.do. [Accessed May 4, 2018].
5. Jeong G, Kim K, Kwak Y. Quality of life in colorectal cancer patients according to the severity of symptom clusters classification. Asian Oncol Nurs. 2014; 14:74–83.
crossref
6. Ali WG, Ayoub NS. Nurses' attitudes toward caring for dying patient in Mansoura university hospitals. J Med Biomed Sci. 2010; 1:16–23.
7. Wong P, Reker G, Gesser G. Death attitude profile-revised: a multidimensional measure of attitudes toward death. Washington, DC: Taylor & Francis;1994.
8. Kim SH, Choi YS, Shin SW, Chong MK, Lee SN, Lee SW, et al. Development of education program for physicians based on the 2004 hos-pice palliative model project for terminal cancer. Korean J Hosp Palliat Care. 2006; 9:67–76.
9. Lenz ER, Pugh LC, Milligan RA, Gift A, Suppe F. The middle-range theory of unpleasant symptoms: an update. ANS Adv Nurs Sci. 1997; 19:14–27.
crossref
10. Kim HJ, Kim SH, Lee HK, Oh SE. Factors affecting symptom experiences of breast cancer patients - based on the theory of unpleasant symptoms. Asian Oncol Nurs. 2014; 14:7–14.
11. Keum KS, Yi M, Bang KS, Cho YA, Lee JL, Lee E. Relationships among activity status, anxiety, depression, social support, symptom experience, and functional status in lung cancer patients based on the theory of unpleasant symptoms. Perspect Nurs Sci. 2013; 10:87–96.
12. Kim JS, Seo YS. Factors influencing on quality of life in patients with liver cirrhosis: convergence on the theory of unpleasant symptoms. J Digit Converg. 2015; 13:271–81.
crossref
13. Lee HJ. Functional status, symptom experience and influential factors in gastric cancer patients with gastrectomy based on the theory of unpleasant symptoms [dissertation]. Seoul: Yonsei Univ.;2015.
14. Zubrod CG, Schneiderman M, Frei E 3rd, Brindley C, Lennard Gold G, Shnider B, et al. Appraisal of methods for the study of chemotherapy of cancer in man: comparative therapeutic trial of nitrogen mustard and triethylene thiophosphoramide. J Chronic Dis. 1960; 11:7–33.
crossref
15. Cohen J. A power primer. Psychol Bull. 1992; 112:155–9.
crossref
16. Yeun EJ, Shin-Park KK. Verification of the profile of mood states-brief: cross-cultural analysis. J Clin Psychol. 2006; 62:1173–80.
crossref
17. Zimet GD, Dahlem NW, Zimet SG, Farley GK. The multidimensional scale of perceived social support. J Pers Assess. 1988; 52:30–41.
crossref
18. Shin JS, Lee YB. The effects of social supports on psychosocial well-being of the unemployed. Korean J Soc Welf. 1999; 37:241–69.
19. Baek Y. The correlation among symptoms, anxiety, depression and quality of life in patients with colorectal cancer undergoing chemotherapy [dissertation]. Seoul: Seoul National Univ.;2013.
20. Yun YH, Mendoza TR, Kang IO, You CH, Roh JW, Lee CG, et al. Validation study of the Korean version of the M. D. Anderson Symptom Inventory. J Pain Symptom Manage. 2006; 31:345–52.
crossref
21. Ware JE, Kosinski M, Keller SD. A 12-Item Short-Form Health Survey: construction of scales and preliminary tests of reliability and validity. Med Care. 1996; 34:220–33.
22. Lee I. The effect of communication on marital adjustment of cancer patients and their spouses - focusing on the actor effect and partner effect -. Korean J Soc Welf. 2011; 63:179–205.
23. Park EJ, Jeon YW, Han SI, Oh SJ. A preliminary study on the quality of life for patients who had breast cancer operations. J Korean Breast Cancer Soc. 2004; 7:299–305.
crossref
24. Cha K, Kim K. Impact of uncertainty on resilience in cancer patients. Asian Oncol Nurs. 2012; 12:139–46.
crossref
25. Kwon EJ, Yi M. Distress and quality of life in breast cancer survivors in Korea. Asian Oncol Nurs. 2012; 12:289–96.
crossref
26. Cho OH, Yoo YS. Psychosocial adjustment, marital intimacy and family support of post-mastectomy patients. J Korean Oncol Nurs. 2009; 9:129–35.
27. Kim HJ, Kwon JH, Kim JN, Lee R, Lee KS. Posttraumatic growth and related factors in breast cancer survivors. Korean J Health Psychol. 2008; 13:781–99.
28. Jo H, Kim B, Lee H, Lee B. Perceived social support as influencing factors on quality of life among cancer patients. Korean J Health Educ Promot. 2010; 27:51–9.
29. Kim HJ, Chu SH, Yoo JS, Kim NK. Nutritional risk and physical activity on quality of life in patients with colorectal cancer. Asian Oncol Nurs. 2014; 14:66–73.
crossref

Fig. 1.
Conceptual framework of this study.
aon-18-104f1.tif
Table 1.
Descriptive Statistics for Study Variables (N =113)
Variables Categories M ± SD Minimum Maximum Range
POMS Tension-anxiety 5.08 ± 3.93 0 18 18
  Depression-dejection 4.01 ± 3.89 0 17 17
  Anger-hostility 4.04 ± 3.40 0 17 17
  Vigor-activity 6.26 ± 3.88 0 20 20
  Fatigue-inertia 4.27 ± 3.56 0 16 16
  Confusion-bewilderment 6.69 ± 3.19 1 15 14
  Total mood disturbance 17.84 ± 17.70 −18 81 99
MPASS Significant others 3.87 ± 0.72 2 5 3
  Family 4.03 ± 0.88 1 5 4
  Friends 3.67 ± 0.69 1.25 5 3.75
MDASI-GI Severity 3.39 ± 2.14 0 8.44 8.44
  Interference 3.55 ± 2.70 0 9.33 9.33
SF-12 Physical functioning 59.51 ± 32.78 0 100 100
  Role physical 56.08 ± 29.41 0 100 100
  Bodily pain 68.36 ± 28.15 25 100 75
  General health 48.63 ± 22.63 0 85 85
  Vitality 47.79 ± 30.17 0 100 100
  Social functioning 69.91 ± 30.82 0 100 199
  Role emotional 58.96 ± 30.04 0 100 100
  Mental health 64.49 ± 23.35 0 100 100
  Physical component score 44.63 ± 8.18 22.02 61.20 39.18
  Mental component score 45.54 ± 9.98 19.25 64.66 45.41

POMS= Profile of mood states-brief; MPASS= The multidimensional scale of perceived social support; MDASI-GI= The MD anderson symptom inventory-gastrointestinal cancer Module; SF-12= Short form-12.

Table 2.
Demographic and Quality Of Life according to Sample's Characteristics
Variables Categories n (%) or M ± SD Physical component score
Mental component score
M ± SD F or t p M ± SD F or t p
Gender (year)   58.1 ± 8.22   0.69 .493   0.45 .653
  Male 69 (61.1) 45.06 ± 8.60     45.88 ± 9.35    
  Female 44 (38.9) 43.97 ± 7.52     45.01 ± 10.98    
Education None 4 (3.5) 42.51 ± 2.91 0.53 .714 45.95 ± 14.26 1.00 .410
  Elementary school 13 (11.5) 41.91 ± 8.85     41.24 ± 12.04    
  Middle school High school 22 (19.5) 49 (43.4) 45.18 ± 5.0644.80 9.01     44.30 ± 9.7946.15 8.55    
  High school 49 (43.4) 44.80 ± 9.01     46.15 ± 8.55    
  ≥ College 25 (22.1) 45.58 ± 9.02     47.60 ± 10.96    
Marital status Single 5 (4.4) 41.94 ± 9.31 0.93 .430 45.58 ± 2.20 0.25 .865
  Married 95 (84.1) 45.09 ± 8.40     45.36 ± 10.47    
  Widowed 8 (7.1) 40.61 ± 4.18     45.24 ± 8.96    
  Others 5 (4.4) 45.20 ± 7.26     49.31 ± 6.76    
Religion None 46 (40.7) 45.84 ± 8.39 1.23 .304 46.84 ± 11.15 0.84 .504
  Buddhist 24 (21.2) 44.66 ± 8.24     46.13 ± 8.44    
  Christianity 26 (23.1) 41.73 ± 7.71     43.03 ± 8.40    
  Catholic 17 (15.0) 45.45 ± 7.59     45.96 ± 10.67    
  Others   48.56 ± 13.21     38.98 ± 15.91    
Job Yes 48 (42.5) 43.56 ± 8.38 −1.63 .105 44.88 ± 10.30 −0.82 .417
  No 65 (57.5) 46.09 ± 7.75     46.43 ± 9.57    
Monthly income (10,000 won) <100 24 (21.2) 42.04 ± 7.45 1.34 .262 42.73 ± 10.32 1.48 .213
  100~200 33 (29.2) 46.05 ± 7.80     44.70 ± 9.95    
  200~300 26 (23.0) 43.37 ± 9.17     45.53 ± 9.10    
  300~400 16 (14.2) 45.88 ± 8.79     47.34 ± 8.80    
  ≥ 400 14 (12.4) 46.69 ± 7.10     50.29 ± 11.51    
Living with others Alone 10 (8.8) 45.72 ± 7.70 0.19 .662 45.31 ± 8.29 0.01 .940
  Family 103 (91.2) 44.53 ± 8.25     45.56 ± 10.16    
Number of chemotherapy   5.61 ± 4.98            
ECOG PSR 0 17 (15.1)            
  1 84 (74.3)            
  2 12 (10.6)            

ECOG PSR= The eastern cooperative oncology group performance status scale.

Table 3.
Quality Of Life according to Disease-related Characteristics (N =113)
Variables Categories Physical component score (PCS)
Mental component score (MCS)
M ± SD t or F p Bonferroni M ± SD t or F p Bonferroni
Stage of colorectal neoplasms Stage 1 46.40 ± 0.68 .563   44.45 ± 10.19 1.02 .385  
  Stage 2 44.39 ± 8.30       47.93 ± 10.20      
  Stage 3 43.65 ± 9.04       44.65 ± 9.57      
  Stage 4 44.28 ± 2.63       42.56 ± 10.90      
Location of colorectal neoplasms Ascending Colona 45.88 ± 7.57 0.13 .973   50.08 ± 8.45 3.16 .017 b> a> e
  Transverse Colonb 44.20 ± 15.21       57.47 ± 3.56      
  Descending Colonc 44.89 ± 6.21       46.18 ± 9.27      
  Sigmoid colond 44.44 ± 9.17       44.55 ± 10.37      
  Rectume 44.33 ± 7.37       43.58 ± 9.70      
Type of treatment Operation 44.25 ± 8.60 0.08 .925   43.84 ± 9.60 1.90 .155  
  Operation + CTX 44.91 ± 7.56       47.50 ± 9.93      
  Operaion + CTX+RTX 44.78 ± 9.33       43.94 ± 10.58      
ECOG PS 0a 47.92 ± 7.01 5.60 .005 a, b> c 49.03 ± 7.97 1.95 .147  
  1b 2c 44.90 ± 8.1238.15 6.99       45.38 ± 9.6141.74 13.77      
  2c 38.15 ± 6.99       41.74 ± 13.77      

PCS= Physical component score; MCS= Mental component score; CTX= Chemotherapy; RTX= Radiotherapy; ECOG PS= Eastern cooperative Oncology group performance satus.

Table 4.
Correlations among the Study Variables (N =113)
Variables Mood Social support Symptom QOL
Total mood disturbance
Vigor
Severity
Interference
PCS
MCS
r (p) r (p) r (p) r (p) r (p) r (p) r (p)
Total mood disturbance 1            
Vigor −.44 (<.001) 1          
MSPSS −.11 (.262) .16 (.096) 1        
Symptom severity .55 (<.001) −.10 (.306) −.07 (.461) 1      
Symptom interference .61 (<.001) −.18 (.051) −.13 (.173) .58 (<.001) 1    
Physical component score −.40 (<.001) .15 (.111) .04 (.503) −.33 (<.001) −.52 (<.001) 1  
Mental component score −.45 (<.001) .27 (.003) .15 (.105) −.41 (<.001) −.51 (<.001) .35 (<.001) 1

MSPSS= The multidimensional scale of perceived social support; QOL= Quality of life; PCS= Physical component score; MCS= Mental component score.

Table 5.
The Predictors of SF Score (N =113)
Variables Categories B Std. error β t p Adjusted R2 Durbin-Watson
PCS (Constant) 52.86 1.53   34.59 <.001    
  ECOG PR −3.21 1.31 −.20 −2.46 .016    
  Symptom interference −1.45 0.25 −.48 −5.92 <.001 .29 1.73
MCS (Constant) 70.71 6.20   11.41 <.001    
  Age −0.24 0.10 −.20 −2.53 .013    
  Symptom interference −1.80 0.30 −.49 −5.91 <.001    
  Unpleasant symptoms s -1.47 0.70 −.17 −2.11 .037 .31 2.01

SF= Short form; PCS= Physical component score; MCS= Mental component score; ECOG PR= Eastern cooperative oncology group performance rating.

TOOLS
Similar articles