

 PDF
PDF ePub
ePub Citation
 Print
Print


INTRODUCTION
Ischiofemoral impingement (IFI) is a rare clinical entity characterized by chronic groin, buttock or atypical hip pain1). Usually considered a consequence of trauma or surgical hip procedure, IFI has recently been identified as a source of hip pain without iatrogenic origins2). Although frequently discussed, IFI is not always detected due to nonspecific symptoms3). Clinically, the IFI test-which places the patient's limb in a combined position of extension, adduction, and external rotation of the hip joint-can be used to identify symptoms4). Despite its clinical use, symptoms may be confused with other hip and lumbar spine pathology, which may also co-exist. Therefore, the diagnosis of IFI generally requires both clinical and imaging studies.
IFI is a source of hip pain derived from impingement between the lesser trochanter and the ischium, or from entrapment of the quadratus femoris muscle between the two structures56). In 2009, Torriani et al.6) first defined the ischiofemoral space (IFS) as the shortest distance between the ischial tuberosity and the lesser trochanter, and the quadratus femoris space (QFS) as the shortest distance of the quadratus femoris muscle, as a parameter of IFI on magnetic resonance imaging (MRI) axial cut image. According to Torriani et al.6), IFS and QFS in ischofemoral impingement patients were narrowing, and high signal was identified in the QFS, primarily due to edema of the quadratus femoris muscle. Since then, MRI has been the standard tool to diagnose IFI. On the other hand, plain X-ray has not been as useful15). Focusing on the definition of IFS, we looked for alternative methods of identifying the distance between the ischial tuberosity and lesser trochanter. We compared the IFS values measured in the false profile view with those measured in the hip anteroposterior (AP) view and the MRI measurements. This study aimed to characterize the potential utility (e.g., more convenient and less expensive) of identifying IFS using the false profile view before MRI.
MATERIALS AND METHODS
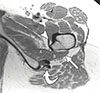
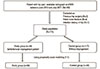
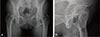
This retrospective study was approved by the institutional review board of Gangnam Severance Hospital in Seoul, Korea (3-2017-0205). We reviewed information from the picture archiving and communication system (PACS) database between June 2013 and July 2017 for all patients who had a clinical history of hip pain. Patients who visited our clinic complaining of hip pain with available false profile views, hip standing AP views and MRI images within 6 months were included. T2-weighted axial fat-suppressed images on MRI images as described by Torriani et al.6) (Fig. 1) were used to assign patients to the IFI or control group. Patients whose symptom provoked on the IFI test and present of quadratus femoris muscle edema were assigned to the IFI patient group. Patients with previous history of hip surgery, fractures around the hip joint, and patients with infectious diseases (e.g., septic arthritis of the hip joint) were excluded. On the basis of these inclusion and exclusion criteria, a total of 183 patients were selected. Among these included patients, 58 were identified as IFI patients. Among the remaining 117 patients, 58 were included as a matching control group based on propensity scores including gender, age, and body mass index (BMI) (Fig. 2). The mean age in the study group was 57.3±13.1 years. There were seven male patients and 51 female patients. Lesion sites were on the right side (n=30) and left side (n=28). The mean age of the control group was 56.9±17.0 years, similar to the study group. Because propensity score matching system was used, male to female ratio and lesion site were also the same as the study group (Table 1). All patients took a hip standing AP view, a false profile view, and MRI. The hip standing AP view was taken in the neutral rotation position, and teardrops of the pelvis had to be symmetric as an optimal position. During the MRI examination, patients were maintained in the supine position with leg extension in neutral rotation. Hips were placed in the neutral position (patella directly upward). The false profile view was taken with the patient in a standing position with the affected hip against the cassette and the pelvis rotated 65° in relation to the back wall stand. The foot on the same side as the affected hip was positioned parallel to the cassette. The central beam was then centered on the femoral head, with a tube-to-film distance of approximately 40 inches (102 cm)7). IFS was measured in each patient by weight-bearing hip standing AP image and false profile image (Fig. 3). IFS and QFS were also assessed using T2-weighted axial fat-suppressed MRI scans. Two authors independently measured each parameter on the radiographs and MRI scans using a PACS workstation (GE Medical Systems, Milwaukee, WI, USA). Cutoff values of the IFS measured in the false profile view was calculated and the correlation coefficient (r) between the IFS value measured in the radiograph (hip standing AP view, false profile view), and IFS and QFS value measured using MRI scans. The Youden J index, which was used to select the optimum cutoff points for each parameter, is a single statistic that summarizes the performance of a diagnostic test according to values ranging from 0 to 1 (1 indicates perfect test performance). The Youden index (J) was calculated with the following equation: J=sensitivity+specificity−1. The r-values were classified as follows: 0≤r<0.25, little or no relation; 0.25≤r<0.6, fair correlation; 0.6≤r<0.8, moderate to good correlation; and 0.8≤r, very good to excellent correlation. The area under the receiver operating characteristics (ROC) curve (AUC) was measured as a measure of the discriminatory ability and a high AUC value as below can be considered to have a better discriminatory ability (excellent discrimination, AUC≥0.90; good discrimination, 0.80≤AUC<0.90; fair discrimination, 0.70≤AUC<0.80; and poor discrimination, AUC<0.70). For statistical analysis, all data were analyzed SPSS version 23.0 statistical software (IBM Corp., Armonk, NY, USA).
RESULTS
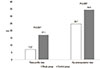
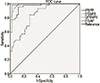
IFS measured in the false profile view was 7.07±2.8 mm in the study group and 17.1±6.4 mm in the control group. IFS measured in the hip AP view was 24.7±6.7 mm in the study group and 34.5±7.3 mm in the control group (Fig. 4). In both the false profile and hip AP views, IFS was significantly lower in the study group compared to the control group (P<0.01). AUC value was 0.967 on the false profile view and 0.841 on the hip AP view. Comparing the AUC values, the hip AP view was 0.841, within the good discrimination category, and the false profile view was 0.967, which is in the excellent discrimination category.
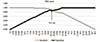
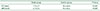
IFS and QFS calculated using MRI scans resulted in similar results. In this study, IFS values were measured as mean 7.7±2.7 mm and QFS 4.1±2.4 mm in the study group, and IFS 18.4±5.0 mm and QFS 13.4±4.3 mm in the control group, respectively, with the P-value significantly lower than 0.01 (Table 2). As shown in the ROC curve (Fig. 5), IFS measured in the false profile view was next to the IFS and QFS measured in the MRI image. The AUC was also 0.994 and 0.984 for IFS and QFS, respectively, indicating that MRI was also an excellent tool for diagnosing IFI. Both AUC of the IFS and QFS in the MRI presented excellent comparison values, followed by the false profile view and the hip AP view. The cutoff value of IFS measured in the false profile view was 10.3 mm (sensitivity, 88.6%; specificity, 88.4%) (Fig. 6).
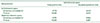
We also reaffirmed the usefulness of the false profile view through the correlation between the IFS and QFS measured by MRI, the IFS in the false profile view and the hip AP view. As shown in Table 3, the correlation between the IFS in the false profile view and the IFS and QFS measured by MRI was 0.73 and 0.78. The correlation between the IFS in the hip AP view and the IFS and QFS measured by MRI was 0.62 and 0.56.
DISCUSSION
IFI is known to cause hip pain and limit motion due to narrowing of the space between the ischial tuberosity and the lesser trochanter. The symptoms of IFI are not as easy to distinguish from nonspecific hip pain symptoms (e.g., groin pain, hip pain, pain on sitting and locking in hip motion)15). Currently, no specific clinical criteria exists for diagnosing IFI. Therefore, IFI diagnosis is made through a combination of physical examination and radiologic imaging. Since the 2009 Torriani et al.'s paper6), MRI has been used as the gold standard for diagnosing IFI. The MRI of IFI patients show narrower IFS and QFS compared to the normal population, and it is often accompanied by quadratus femoris muscle edema1). IFI may also be induced by certain pelvic morphology (e.g., osseous changes due to sclerosis or cystic change, femoral neck angle, ischial angle)8910). In addition, not only hip joint infection, but also myositis-like changes can induce impingement syndrome11). To exclude IFI syndrome that might have been caused by external factors, we excluded patients who underwent surgical treatment such as total hip replacement, bipolar hemiarthroplasty, fractures around the hip joint and infection.
Since the prevalence of IFI is rare and not well known, there has been little research on diagnostic tools other than MRI. Park et al.12) published the first data in 2016, using hip standing and supine AP X-ray. But hip AP view is not fully satisfactory, as the view of lesser trochanter depends on the patient position. As the definition of IFI is a narrowing of the space between the lesser trochanter and the ischial tuberosity, radiography that can better observe the lesser trochanter and ischial tuberosity may be more helpful. Therefore, in this study we used the false profile view as a screening tool for diagnosis of IFI. The false profile view was first described by Lequesne and de Seze13) in 1961 to evaluate the anterior-center-edge angle as a measure of severity of developmental dysplasia of the hip. It provides visualization of acetabular morphology, posterior joint congruity, and femoral head-neck junction14). It may also more reliably reveal pelvis morphology. False profile view requires a more specific position than other radiographs. The patient's pelvis is rotated 65° in relation to the back wall stand, and the foot on the same side as the affected hip should be positioned parallel to the cassette7). These parameters are important because the measurement results can vary depending on the patient's position. Therefore, we marked proper position on the floor, an approach that may also reduce variances between images.
According to Singer et al.15) in 2015, IFI patients had IFS ranging from 8.9 to 17.4 mm, QFS from 6.14 to 12 mm15). Bredella et al.8) reported that the mean IFS and QFS for healthy subjects were 30.6±9.3 mm and 19.3±7.1 mm, respectively, while the mean IFS and QFS distances for IFI patients were 17.4±5.5 mm and 12.0±4.5 mm, respectively. More recently, Park et al.12) reported both IFS and QFS were significantly lower in the IFI patients than in the control group. In our study, IFS was 7.7±2.7 mm for IFI patients and 4.1±2.4 mm for QFS, which was statistically significantly lower in the IFI patient group than in the control group. Similarly, Park et al.12) also reported significantly lower IFS values in IFI patients when compared with the control group on standing hip AP radiographs. Similar to the Park et al.12) study, this study also revealed that IFS values measured on the false profile view and hip standing AP view were significantly different between the two groups (P<0.01). Singer et al.15) indicated that ROC analysis resulted in good performance for both IFS and QFS in predicting IFI, with an AUC of 0.88 for IFS and 0.83 for QFS. Similarly, in the current study the AUC of IFS and QFS were 0.994 and 0.984, respectively. The AUC of IFS in the false profile view also was 0.967, qualifying as a good parameter. The IFS in the false profile view using a cutoff of ≤10.3 mm yielded 88.6% sensitivity and 88.4% specificity. Comparing the AUC values, the values were higher in the false profile view than in the hip AP view (Table 1). The correlation coefficients between the values measured in the false profile view and in the MRI also showed a significant correlation (Fig. 3, Table 3). Of course, there is no consensus of narrowing of the IFS and QFS as diagnostic criteria for IFI. Maras et al.16) suggested that IFS and QFS narrowing does not necessarily signify IFI. However, the IFS in the false profile view was highly correlated with the values measured in the MRI, respectively.
There are some limitations in our study. First, despite propensity matching, this is still a retrospective study. Second, we could not consider all diseases (e.g., iliopsoas tendinitis, hamstring injury and bursitis) which are associated with symptoms similar to IFI. Other authors demonstrated that IFS and QFS narrowing may or may not be associated with quadratus femoris abnormalities and may not be associated with hip pain1718). Therefore, some of our patients possibly had hip pain from other causes. Third, there was the potential bias for the parameters such as IFS and QFS in the MRI scans. Previously, Tosun et al.5) stated that quadratus femoris edema was related to IFI. Forth, even with specific instructions on how to take the false profile view, there was a possibility of a difference depending on the instructor.
If clinical features point to diseases other than IFI, MRI and/or bone scan are the first choice. However, those tools are relatively expensive and require significant time commitments. Especially in the clinic, false profile views are the most rapid and least expensive examination capable of identifying IFI. A major strength of this study is that, to our knowledge, it is the first study using false profile views for evaluation of IFI. Another strength is that this study compared the parameters in false profile view with other radiographs and MRI through the correlation coefficient. The small number of patients enrolled in the study was supplemented by the propensity score matching system.
CONCLUSION
Although MRI is the most useful tool for diagnosing IFI, it is expensive and rather difficult to use in all patients. The false profile view is relatively simpler and a less expensive option. Considering the high correlation with MRI scans, the false profile view can be useful for hip pain patients with suspicion of IFI before MRI.

 XML Download