Abstract
Purpose
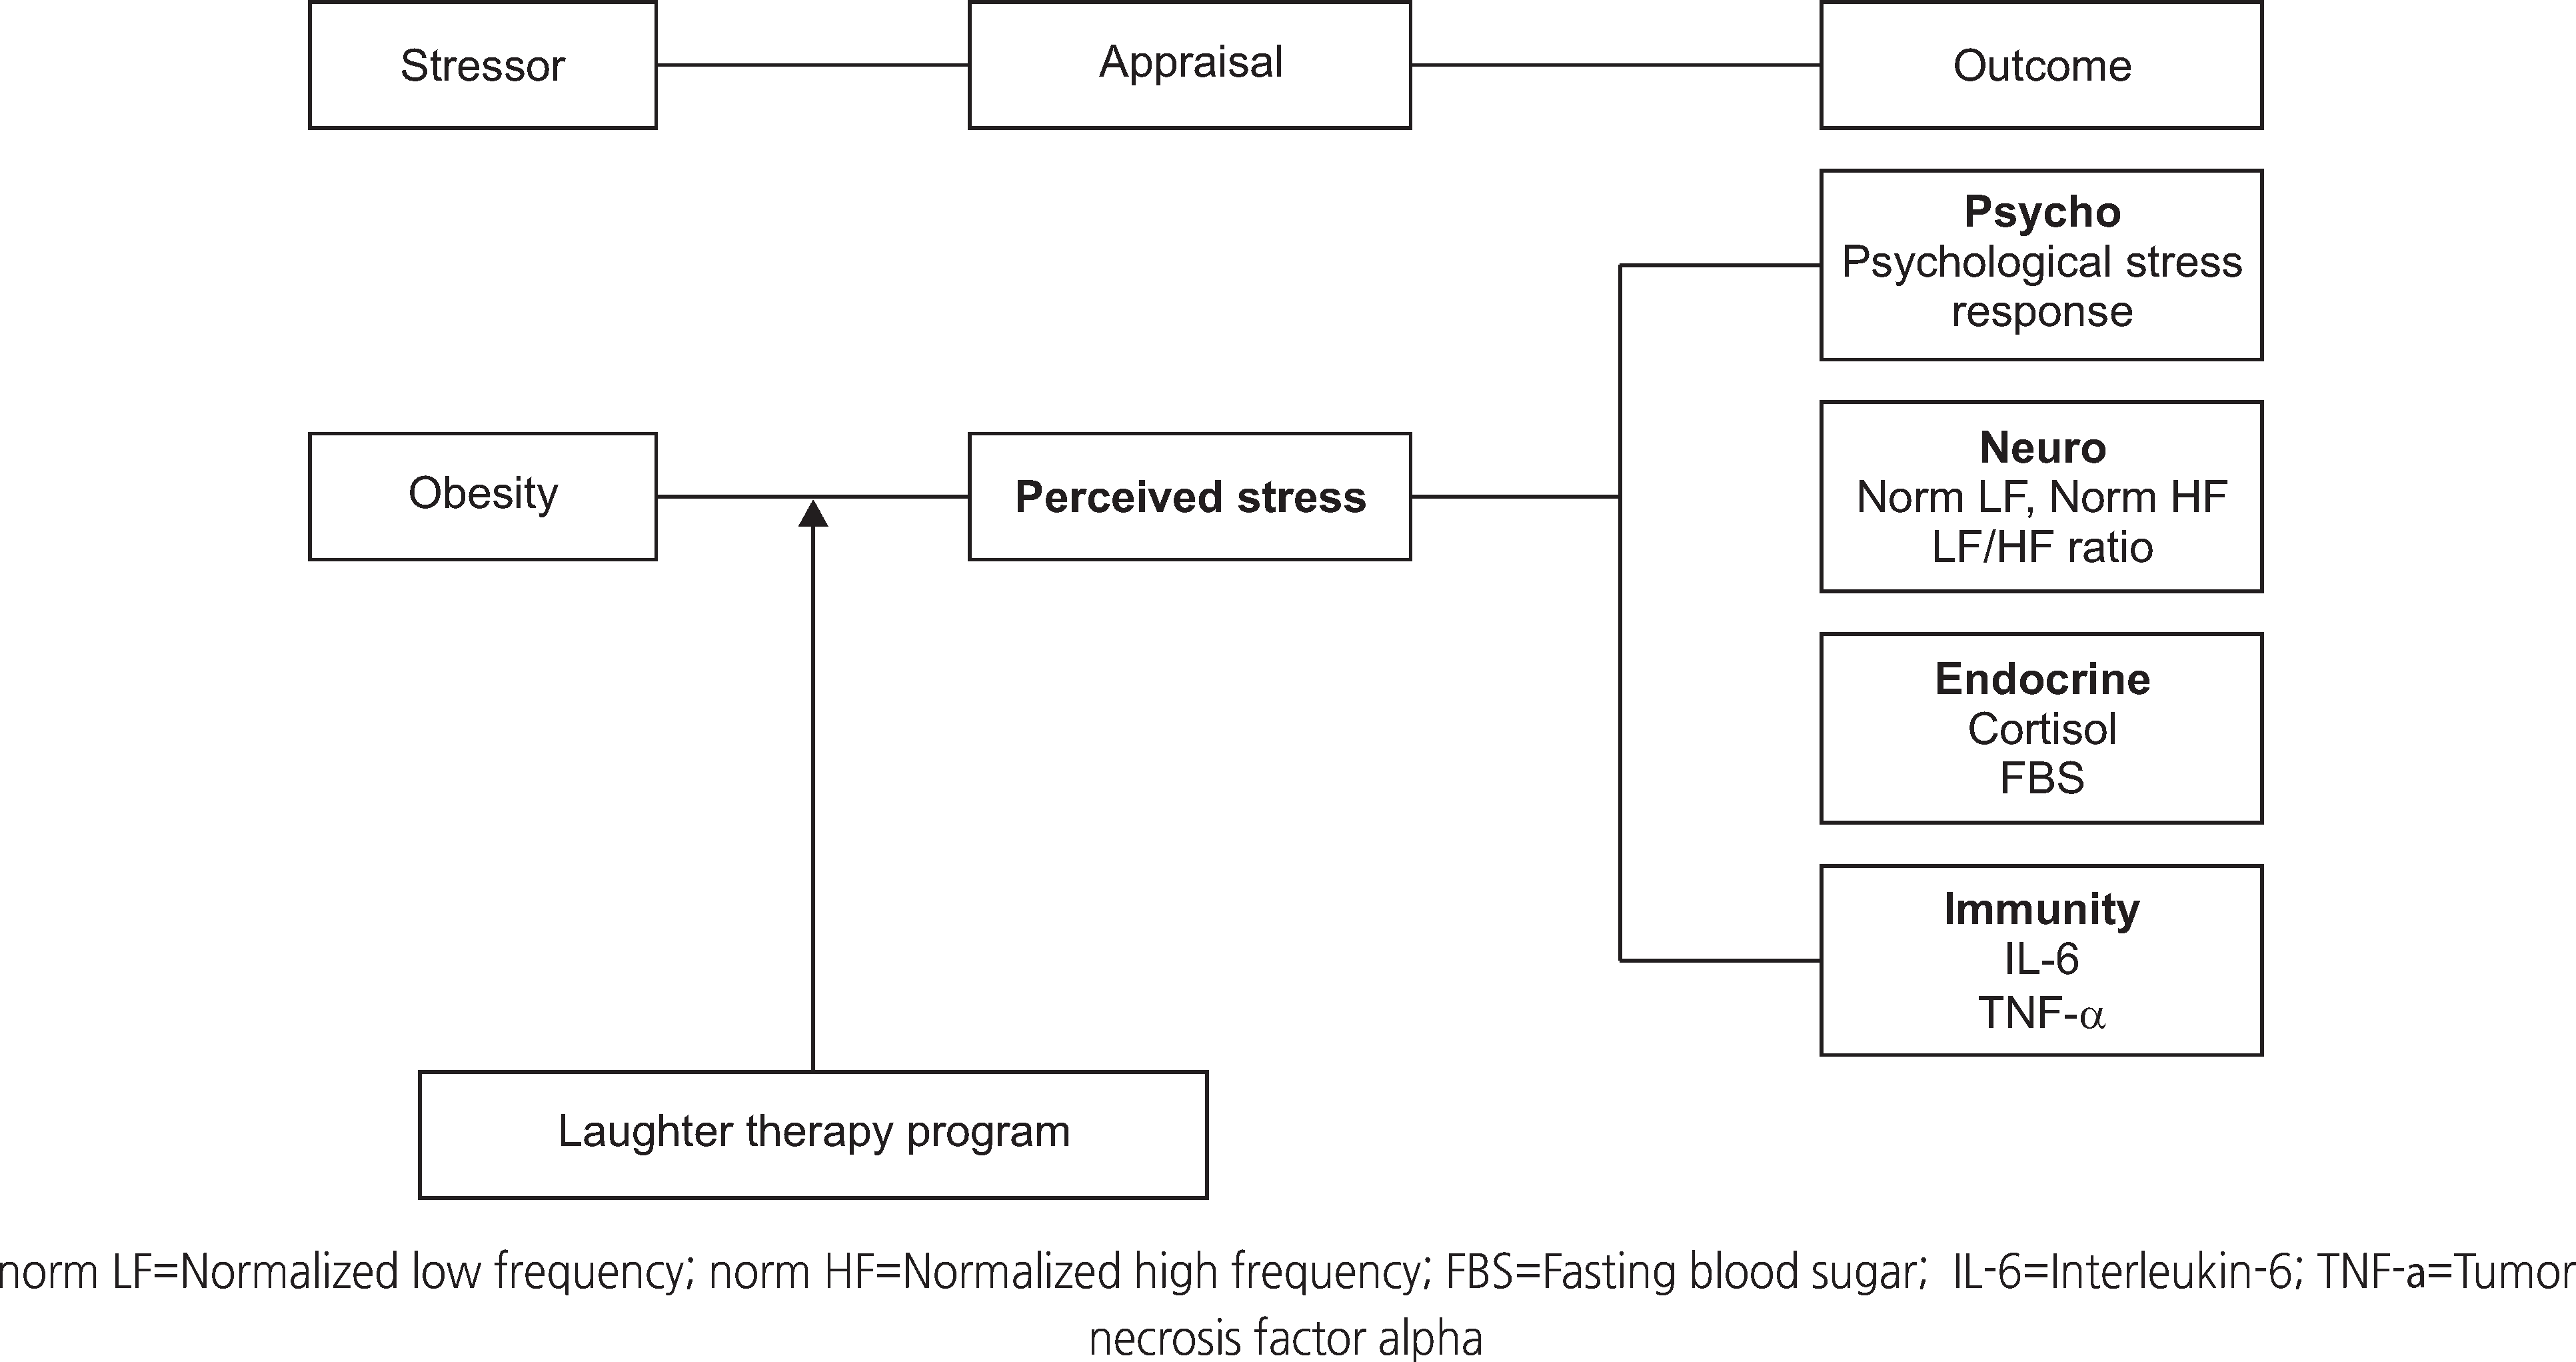
The purpose of this study was to examine the effects of the laughter therapy program on perceived stress and psycho-neuro-endocrine-immune responses in obese women.
Methods
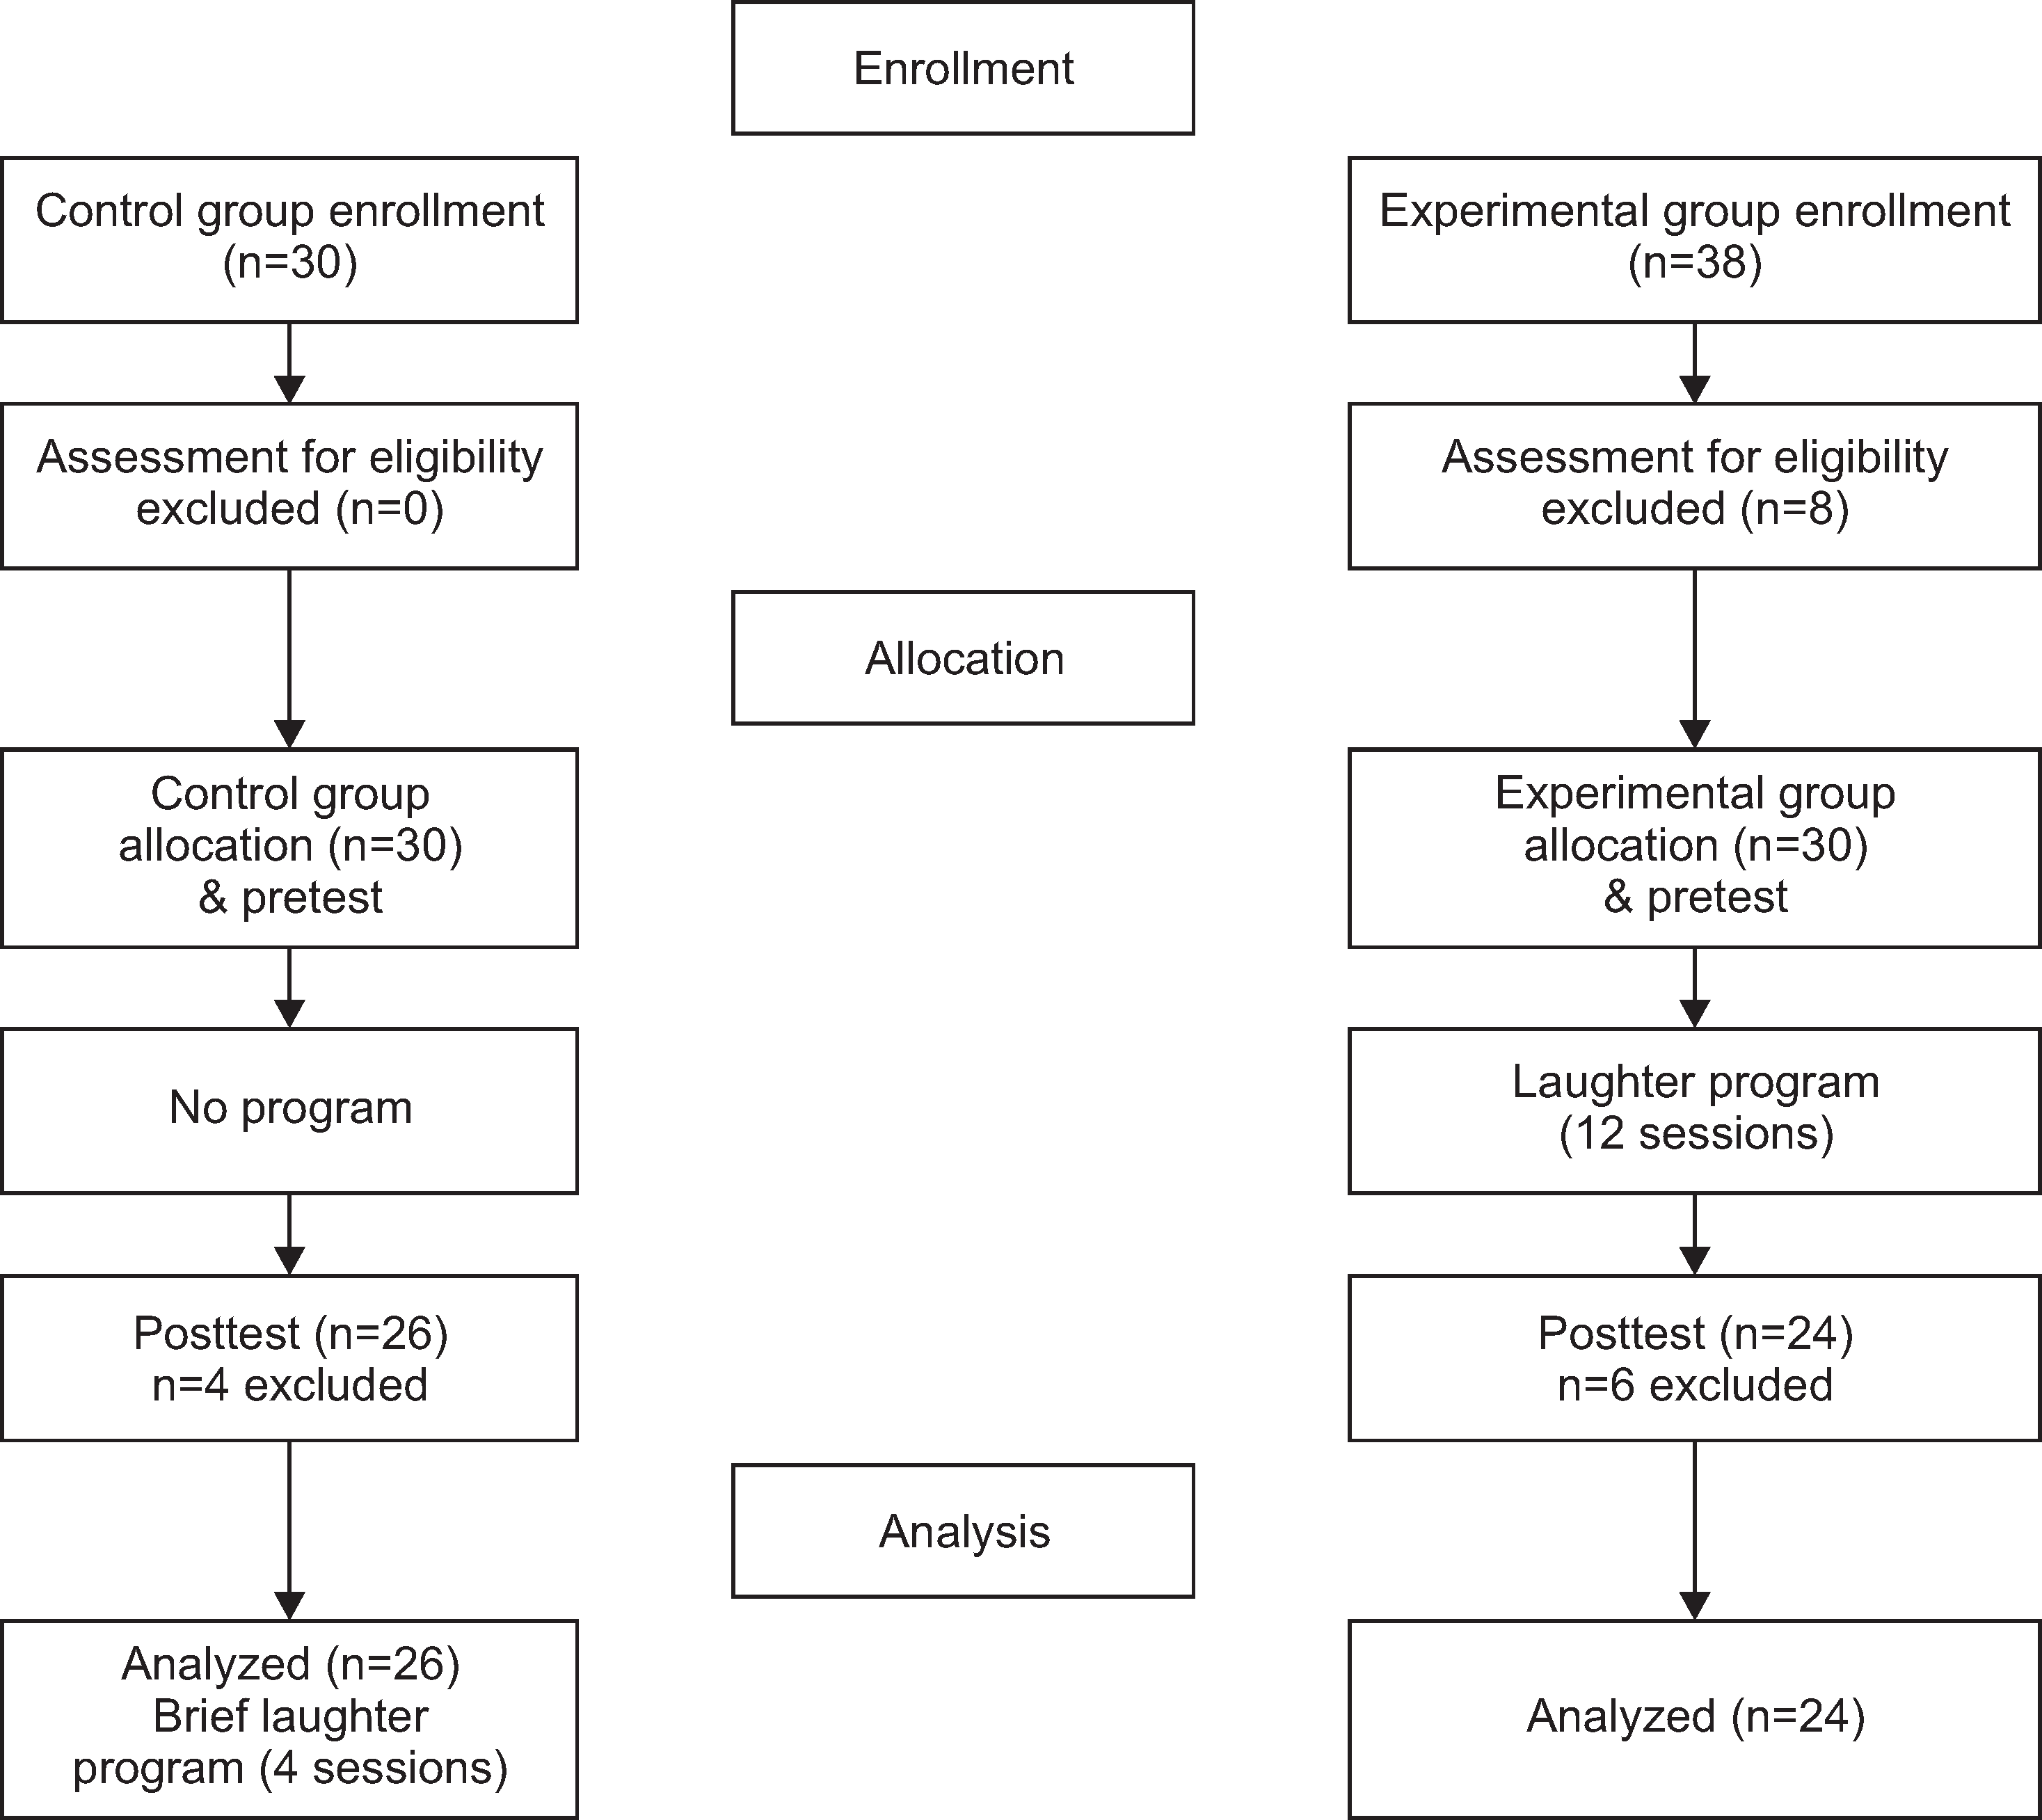
A nonequivalent control group with a pretest-posttest design was used. The participants (n=60), whose age ranged from 30 to 50 years (pre-menopausal and body mass index of over 25 kg/m2), were assigned to the experimental group (n=24) or control group (n=26). The experimental group was provided with the laughter therapy program (12 sessions) for 6 weeks.
Results
There were significant differences in perceived stress, psychological stress response, fasting blood sugar, interleukin-6, and tumor necrosis factor alpha between the two groups after the program. However, there were no significant differences in normalized low frequency (norm LF), normalized high frequency (norm HF), LF/HF ratio, and cortisol between the two groups after the program.
Go to : 
References
1. WHO. Health topic: Obesity [Internet]. Geneva: World Health Organization;c2015. [cited 2018 Jan 25]. Available from:. http://www.who.int/topics/obesity/en/.
2. Statistics Korea. Korea National Health and Nutrition Survey: Obesity prevalence rate [Internet]. Daejeon: Ministry of Health & Welfare;c2016. [cited 2018 Jan 25]. Available from:. http://www.index.go.kr/potal/main/EachDtlPageDetail.do?idx_cd=2705.
3. Ministry of Health & Welfare. National Health Insurance Service. 2016. National Health Statistics [Internet]. Daejeon: Ministry of Health & Welfare;c2017 [cited 2018 Jan 25]. Available from:. http://www.mohw.go.kr/react/al/sal0301vw.jsp?PAR_MENU_ID=04&MENU_ID=0403&CONT_SEQ=342900&page=1.
4. Brewis AA. Stigma and the perpetuation of obesity. Social Science & Medicine. 2014; 118:152–158. https://doi.org/10.1016/j.socscimed.2014.08.003.

5. Scott KM, McGee MA, Wells JE, Oakley Browne MA. Obesity and mental disorders in the adult general population. Journal of Psychosomatic Research. 2008; 64(1):97–105. https://doi.org/10.1016/j.jpsychores.2007.09.006.

6. Nam SJ, Park JH. Depression and stress related to obesity among normal, obese, and severe obese groups-Comparison among normal, obesity, and severe obesity groups. Korean Journal of Human Ecology. 2012; 21(6):1199–1210. https://doi.org/10.5934/KJHE.2012.21.6.1199.
7. Kim KJ, Hong HS, Park WJ, Ko SJ, Na YK. Effects of an abdominal obesity management program on physiological bio-markers of middle-aged women in Korea: A meta-analysis. The Korean Journal of Obesity. 2016; 25(3):138–149. https://doi.org/10.7570/kjo.2016.25.3.138.

8. Sok DE. Psychoneuroendocrinoimmunology. Bio-psycho-socio-spiritual approach. Daejeon: Chungnam National University Publishing Center;2012. p. 17–20.
9. Kim DH. An overview of psychoneuroimmunology. Korean Journal of Biological Psychiatry. 2008; 15(3):147–151.
10. Kim YM, Ahn SH. A review of postpartum depression: Focused on psychoneuroimmunological interaction. Korean Journal Women Health Nursing. 2015; 21(2):106–114. https://doi.org/10.4069/kjwhn.2015.21.2.106.

11. Park SE, Kim JH, Jeung GW, Kim KS. Assesment of heart rate variability by integral pulse frequency modulation model. The Transactions of the Korean Institute of Electrical Engineers. 2015; 64(5):799–804. https://doi.org/10.5370/KIEE.2015.64.5.799.

12. Kim BS, Min JA. Application and interpretation of HRV in stress clinic. Seoul: Pan-Mun Education;2015. p. 1–140.
13. Kern PA, Gregorio GB, Lu T, Rassouli N, Ranganathan G. Relation to obesity, insulin resistance, and tumor necrosis factor-α expression. Diabetes. 2003; 52(7):1779–1785. https://doi.org/10.2337/diabetes.52.7.1779.
14. Lazarus RS, Folkman S. Stress, appraisal and coping. New York: Springer Publishing Company;1984. p. 11–52.
15. Welliver M. Laughter: The best medicine or best measure? Gastroenterology Nursing. 2012; 35(2):135–136. https://doi.org/10.1097/SGA.0b013e31824ed403.
16. Ripoll RM, Casado IQ. Laughter and positive therapies: Modern approach and practical use in medicine. Revista de Psiquiatría y Salud Mental (English Edition). 2010; 3(1):27–34. https://doi.org/10.1016/S2173-5050(10)70006-6.

17. Choi JH, Kim KH, Cha SJ, Pyo HJ, Kim YK. Effects of laughter therapy on mood, pain, and stress of mastectomy patients. Journal of Korean Clinical Nursing Research. 2010; 16(1):83–93.
18. Han HJ, Park A, Kim HS, Moon HK, Park YH. The effects of laughter therapy on stress responses in patients with preoper- ative breast cancer. Journal of Korean Oncology Nursing. 2011; 11(2):93–100. https://doi.org/10.5388/jkon.2011.11.2.93.
19. Oh EY, Kang KH, Son OL, Wo MA, Lee MS, Kim SJ. The effects of laughter therapy on stress response and coping for specialized burn hospital nurses. Korean Journal Stress Research. 2011; 19(4):323–331.
20. Cha MY, Hong HS. Effects on the laughter score, cortisol and immunoglobulin of laughter therapy in middle aged women. Journal of Korean Biological Nursing Science. 2013; 15(4):230–236. https://doi.org/10.7586/jkbns.2013.15.4.230.

21. Lee DY, Seo HY, Lee BC, Jung GH. Development and effects of laughter therapy program in geriatric successful aging and stress in elderly. Journal of the Korea Convergence Society. 2016; 7(4):199–208. https://doi.org/10.15207/JKCS.2016.7.4.199.

22. Kang JS. A meta-analysis of laughter therapy in Korean journal. Asia-Pacific Journal of Multimedia Services Convergent with Art, Humanities, and Sociology. 2017; 7(1):489–501. https://doi.org/10.14257/AJMAHS.2017.01.08.

23. Cohen S, Kamarck T, Mermalstein R. A global measure of perceived stress. Journal of Health and Social Behaviour. 1983; 24(4):385–396.

24. Ha YS, Jeong GH, Kim SJ. Relationships between perceived stress during the maternal role attainment process and health-promoting lifestyle practice. Nursing Science. 1990; 2:23–47.
25. Koh KB, Park JK, Kim CH. Development of the stress response inventory. Journal of the Korean Neuropsychiatric Association. 2000; 39(4):707–719.
26. Foley E, Matheis R, Schaefer C. Effect to forced laughter on mood. Psychological Reports. 2002; 90(1):184.
27. Lynn MR. Determination and quantification of content validity. Nursing Research. 1986; 35(6):382–385.

28. Min KS. Analysis of the stress between mother and fetus and development of algorithm for labor prediction using heart rate variability [dissertation]. Daejeon: Chungnam National University;2006. p. 1–51.
29. Woo JM. The concept and clinical application for the measurement of heart rate variability. Korean Journal of Psychosomatic Medicine. 2004; 12(1):3–14.
30. Matsuzaki T, Nakajima A, Ishigami S, Tanno M, Yoshino S. Mirthful laughter differentially affects serum pro- and anti-inflammatory cytokine levels depending on the level of disease activity in patients with rheumatoid arthritis. Rheumatology (Oxford). 2006; 45(2):182–186. https://doi.org/10.1093/rheumatology/kei081.

Go to : 
Table 1.
Laughter Therapy Program for Obese Women
Table 2.
Homogeneity Tests of General Characteristics for the Two Groups (N=50)
| Characteristics | Categories | Exp. (n=24) | Cont. (n=26) | χ2 or t | p |
|---|---|---|---|---|---|
| n (%) or M±SD | n (%) or M±SD | ||||
| Age (yr) | 41.21±5.25 | 43.54±5.35 | 1.55 | .127 | |
| BMI (Kg/m2) | 28.38±3.59 | 28.48±3.86 | 0.10 | .924 | |
| Education level† | High shool | 14 (58.4) | 19 (73.1) | .563 | |
| College graduate | 8 (33.3) | 6 (23.1) | |||
| ≥ Graduate school | 2 (8.3) | 1 (3.8) | |||
| Religion | Yes | 12 (50.0) | 15 (57.7) | 0.30 | .586 |
| No | 12 (50.0) | 11 (42.3) | |||
| Occupation† | Yes | 3 (12.5) | 9 (34.6) | .067 | |
| No | 21 (87.5) | 17 (65.4) | |||
| Monthly income† (10,000 won) | None | 6 (25.0) | 7 (27.0) | .645 | |
| < 200 | 6 (25.0) | 3 (11.5) | |||
| 200∼400 | 8 (33.4) | 13 (50.0) | |||
| > 400 | 4 (16.6) | 3 (11.5) | |||
| Exercise | Never | 10 (41.7) | 10 (38.5) | 0.14 | .931 |
| Sometimes | 8 (33.3) | 10 (38.5) | |||
| Regularly | 6 (25.0) | 6 (23.0) | |||
| Meal (times per day) | Two | 10 (41.7) | 7 (26.9) | 1.21 | .272 |
| Three | 14 (58.3) | 19 (73.1) | |||
| Snack (times per day)† | One | 11 (45.8) | 12 (46.2) | .645 | |
| Two | 8 (33.3) | 11 (42.3) | |||
| Three | 5 (20.9) | 3 (11.5) | |||
| Health status† | Bad | 9 (37.5) | 7 (26.9) | .771 | |
| Average | 14 (58.3) | 16 (61.5) | |||
| Good | 1 (4.2) | 3 (11.6) | |||
| Health concern† | No | 2 (8.4) | 2 (7.7) | .481 | |
| Average | 8 (33.3) | 14 (53.8) | |||
| Much | 14 (58.3) | 10 (38.5) | |||
| Weight control | No | 11 (45.8) | 9 (34.6) | 0.79 | .674 |
| Moderate | 7 (29.2) | 8 (30.8) | |||
| Severe | 6 (25.0) | 9 (34.6) |
Table 3.
Homogeneity Test of the Dependent Variables for the Two Groups (N=50)
Table 4.
Differences in Dependent Variables between the Two Groups (N=50)
| Variables | Groups | Pretest | Posttest | Difference | t or F | p |
|---|---|---|---|---|---|---|
| M±SD | M±SD | M±SD | ||||
| Perceived stress | Exp. | 28.58±5.59 | 19.50±6.14 | -9.08±7.39 | 3.73 | <.001 |
| Cont. | 28.58±7.00 | 26.88±8.17 | -1.70±6.63 | |||
| Psychological stress response | Exp. | 51.13±27.56 | 19.50±21.94 | -31.63±21.75 | 2.94 | .005 |
| Cont. | 44.65±28.82 | 41.42±30.44 | -3.23±14.49 | |||
| norm LF (nu) | Exp. | 68.15±0.19 | 65.49±0.15 | -2.66±0.20 | 0.78 | .438 |
| Cont. | 60.23±0.18 | 61.52±0.15 | 1.29±0.16 | |||
| norm HF (nu) | Exp. | 31.85±0.19 | 34.51±0.15 | 2.66±0.20 | -0.78 | .438 |
| Cont. | 39.77±0.18 | 38.48±0.15 | -1.29±0.16 | |||
| LF/HF ratio | Exp. | 3.18±2.30 | 2.57±1.84 | -0.61±3.00 | 0.85 | .399 |
| Cont. | 2.16±1.62 | 2.15±1.72 | -0.01±1.83 | |||
| Cortisol (μg/dl) | Exp. | 9.52±2.87 | 9.84±3.08 | 0.32±3.74 | 0.27 | .979 |
| Cont. | 9.67±3.27 | 10.02±4.22 | 0.35±4.01 | |||
| Fasting blood sugar (mg/dl) | Exp. | 106.04±11.30 | 99.42±10.38 | -6.62±13.43 | 2.10 | .041 |
| Cont. | 108.00±10.36 | 110.35±15.18 | 2.35±16.50 | |||
| IL-6 (pg/ml) | Exp. | 2.43±1.28 | 1.51±0.74 | -0.92±1.27 | 2.17 | .035 |
| Cont. | 2.03±1.92 | 1.92±1.63 | -0.11±1.36 | |||
| TNF-α (pg/ml)† | Exp. | 1.73±0.50 | 1.08±0.38 | -0.65±0.08 | 4.44 | .041 |
| Cont. | 1.33±0.41 | 1.15±0.47 | -0.18±0.08 |


 PDF
PDF ePub
ePub Citation
 Print
Print


 XML Download