

 PDF
PDF ePub
ePub Citation
 Print
Print


Joo-Young Na1, 2 , Jong-Tae Park3
, Jong-Tae Park3
Abstract
The diagnosis of cause of death (COD) or estimation of postmortem interval (PMI) is hard to perform using postmortem blood or other bodily fluids due to various biochemical changes that occur during the agonal phase or after death. To solve these problems, new paradigms and new analytical methods are needed. In this study, postmortem blood was fractionated with specific gravity 1.021, 1.029, 1.038, and 1.045, and the absorbance patterns of each sample of the 131 total cases (12 kinds of COD) were analyzed using a spectrometer. The absorbance was grouped into 9 patterns (ABS pattern 1 to 9) according to the wave length and the signal intensity. These patterns of postmortem blood were found to be distinctly different from the absorbance pattern of fresh blood. The analysis of ABS patterns is useful for the diagnosis of deaths due to acute or rapid bleeding, fire death, drowning and, in some cases, poisoning, but is not useful for the estimation of PMI.
Figures and Tables
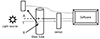 | Fig. 1Diagram of spectrometric analysis of postmortem blood. A, absorbance; T, transmittance; R, reflectance.
|
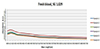
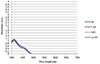
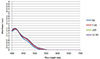
 | Fig. 4Absorbance spectrum of ABS 1 is below 500 nm and the peak is less than 1.0 (5×, SG 1.021; 7.5×, SG 1.029; 10×, SG 1.038; 12.5×, SG 1.045).
|
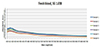
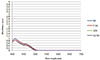
 | Fig. 5Absorbance spectrum of ABS 2 is below 500 nm and the peak is more than 1.0 (5×, SG 1.021; 7.5×, SG 1.029; 10×, SG 1.038; 12.5×, SG 1.045).
|
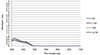
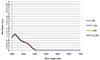
 | Fig. 6Absorbance spectrum of ABS 3 is slightly over 500 nm and the peak is less than 1.0 (5×, SG 1.021; 7.5×, SG 1.029; 10×, SG 1.038; 12.5×, SG 1.045).
|
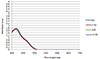
 | Fig. 7Absorbance spectrum of ABS 4 is slightly over 500 nm and the peak is more than 1.0 (5×, SG 1.021; 7.5×, SG 1.029; 10×, SG 1.038; 12.5×, SG 1.045).
|
 | Fig. 8Absorbance spectrum of ABS 5 is slightly over 500 nm and the peak is more than 1.5 (5×, SG 1.021; 7.5×, SG 1.029; 10×, SG 1.038; 12.5×, SG 1.045).
|
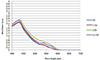
 | Fig. 9Absorbance spectrum of ABS 6 is below 550 nm (5×, SG 1.021; 7.5×, SG 1.029; 10×, SG 1.038; 12.5×. SG 1.045).
|
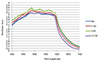
 | Fig. 10Absorbance spectrum of ABS 7 is below 600 nm (5×, SG 1.021; 7.5×, SG 1.029; 10×, SG 1.038; 12.5×, SG 1.045).
|
 | Fig. 11Absorbance spectrum of ABS 8 is below 600 nm and new peak is in 550 nm (5×, SG 1.021; 7.5×, SG 1.029; 10×, SG 1.038; 12.5×, SG 1.045).
|
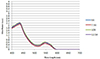
 | Fig. 12Absorbance spectrum of ABS pattern 9 is over 650 nm and peak show plateau(5×, SG 1.021; 7.5×, SG 1.029; 10×, SG 1.038; 12.5×, SG 1.045).
|
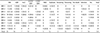
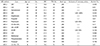
Table 2
Relationship between the ABS pattern of postmortem blood samples and BMI, PMI, coronary artery disease, and blood alcohol concentration in the individuals who died of ischemic heart disease
![]()
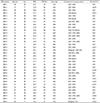
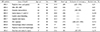
Table 3
Relationship between the ABS pattern of postmortem blood samples and BMI, PMI, coronary artery disease, and blood alcohol concentration in the individuals who died of cardiomyopathy

![]()
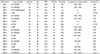
Table 4
Relationship between the ABS pattern of postmortem blood samples and BMI, PMI, coronary artery disease, and blood alcohol concentration in the individuals who died of sudden cardiac

![]()
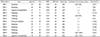
Table 5
Relationship between the ABS pattern of postmortem blood samples and BMI, PMI, coronary artery disease, and blood alcohol concentration in the individuals who died of intracranial hemorrhage
![]()
Table 6
Relationship between the ABS pattern of postmortem blood samples and BMI, PMI, coronary artery disease, and blood alcohol concentration in the individuals who died of aortic aneurysm (or aortic dissection)

![]()
Table 7
Relationship between the ABS pattern of postmortem blood samples and BMI, PMI, coronary artery disease, and blood alcohol concentration in the individuals who died of asphyxia
![]()
Table 8
Relationship between the ABS pattern of postmortem blood samples and BMI, PMI, coronary artery disease, and blood alcohol concentration in the individuals who died of drowning

![]()
Table 9
Relationship between the ABS pattern of postmortem blood samples and BMI, PMI, coronary artery disease, and blood alcohol concentration in the individuals who died of poisoning
![]()
Table 10
Relationship between the ABS pattern of postmortem blood samples and BMI, PMI, coronary artery disease, and blood alcohol concentration in the fire death

![]()
Table 11
Relationship between the ABS pattern of postmortem blood samples and BMI, PMI, coronary artery disease, and blood alcohol concentration in the individuals who died of infection

![]()
Acknowledgments
This work was supported by National Forensic Service (NFS2014MED05 and NFS2015MED06), Ministry of the Interior and Safety, Republic of Korea.
References
1. Wang K, Asinger RW, Marriott HJ. ST-segment elevation in conditions other than acute myocardial infarction. N Engl J Med. 2003; 349:2128–2135.

2. Hauser AM, Gangadharan V, Ramos RG, et al. Sequence of mechanical, electrocardiographic and clinical effects of repeated coronary artery occlusion in human beings: echocardiographic observations during coronary angioplasty. J Am Coll Cardiol. 1985; 5(2 pt 1):193–197.
3. Eggers KM, Oldgren J, Nordenskjold A, et al. Diagnostic value of serial measurement of cardiac markers in patients with chest pain: limited value of adding myoglobin to troponin I for exclusion of myocardial infarction. Am Heart J. 2004; 148:574–581.
4. Normand ST, Landrum MB, Guadagnoli E, et al. Validating recommendations for coronary angiography following acute myocardial infarction in the elderly: a matched analysis using propensity scores. J Clin Epidemiol. 2001; 54:387–398.
5. Warraich HJ, Benson CC, Khosa F, et al. Diagnosis of acute myocardial infarction on computed tomography angiogram. Circulation. 2014; 129:272–273.
6. Min BW, Park JT, Choi JS. Postmortem biochemistry (I): cardiac markers. Korean J Leg Med. 2012; 36:1–14.
7. Hausdorfer C, Pedal I, Zimmer G, et al. Catecholamines, myofibrillary degeneration of the heart muscle and cardiac troponin T in various types of agony. Arch Kriminol. 1995; 196:46–57.
8. Matoba K, Terazawa K, Watanabe S, et al. Problems in applying a rapid assay kit for cardiac troponin T to medico-legal blood samples. Hokkaido Igaku Zasshi. 2006; 81:359–363.
9. Zhu BL, Ishida K, Quan L, et al. Post-mortem urinary myoglobin levels with reference to the causes of death. Forensic Sci Int. 2001; 115:183–188.
10. Madea B. Is there recent progress in the estimation of the postmortem interval by means of thanatochemistry? Forensic Sci Int. 2005; 151:139–149.
11. Luna A. Is postmortem biochemistry really useful? Why is it not widely used in forensic pathology? Leg Med (Tokyo). 2009; 11:Suppl 1. S27–S30.
 XML Download