

 PDF
PDF ePub
ePub Citation
 Print
Print


INTRODUCTION
Reliable biomarkers are crucial for timely assessment of conditions of patients, especially those who have just received organ transplants and are under risk of acute rejection.1 Under the current standard of care for immunosuppression, acute rejection occurs in about 15–20% of patients who undergo kidney transplantation. Acute rejection is diagnosed by increase of serum creatinine or development of newly onset proteinuria, and is further confirmed by invasive needle biopsy.2 However, in a subset of patients with subclinical acute rejection, no increase in serum creatinine or proteinuria can be observed.3
Needle biopsy has become safer and its interpretation has been standardized; however, needle biopsy still carries the risk of post-biopsy bleeding, which can ultimately lead to graft loss. Moreover, biopsy interpretation is subject to sampling errors as well as inter-observer variability.4 Moreover, systematic review or meta-analysis of biopsy studies are generally unfeasible due to recurring revisions of the diagnostic criteria every two years, which entail non-interconvertible histology classifications.5 In addition, the predictive power of renal core biopsy has been shown to be poor.6
In case of allograft rejections, abnormalities in immune response appear at the molecular level before becoming apparent at the histological level.7 Therefore, there is a need for the development of noninvasive molecular biomarkers with high reliability and predictive power for early diagnosis and monitoring of any clinical condition after kidney transplantation.8910 Unlike interstitial fibrosis/tubular atrophy (IFTA), tubulointerstitial inflammation is a reversible condition of kidney allograft if early diagnosis and subsequent treatment is given. Therefore, it is important to distinguish tubulointerstitial inflammation from fibrosis. Several urinary biomarkers such as transglutaminase- 2 (TG2) have been used for assessment of renal fibrosis1112 as well as inflammation1314 in kidney allografts. In the current study, we aimed to verify urinary biomarkers that enable distinction between tubulointerstitial inflammation and IFTA.
MATERIALS AND METHODS
Study population
From July 2015 to July 2017, a total of 210 kidney transplant recipients (aged 17 to 77 years) who were at least 6 months post kidney transplantation were asked to be enrolled in this study when they visited our center for regular check-up or for-cause allograft biopsy. After an informed consent was obtained, urine specimens were collected at the time of check-up or 2–3 hours before the for-cause biopsy. In addition, a total of 50 living kidney donors were enrolled in this study and urine specimens were collected just before donor nephrectomy. A total of 260 urine specimens were collected from the 260 patients for quantitative analysis of candidate biomarkers. Recipients without for-cause biopsy were considered to have stable graft function if their average serum creatinine level was less than or equal to 2.0 mg/dL (180 µmol/L) at the time of enrollment and was within 120% of the baseline value over the previous 6 months, there was no treatment for acute rejection, and no evidence of cytomegalovirus (CMV) or polyomavirus type BK (BKV) infection.13 This study was performed after receiving approval from the institutional review board of Asan Medical Center (approval number: 2015–0758), and all patients provided written informed consent.
Urine sample collection and storage
Urine sample (35–50 ml) was collected from each patient. For each urine specimen, 0.5 ml of protease inhibitor mixture (5 mM 4-(2-animoethyl) benzenesulfonyl fluoride hydrochloride, 2 µM leupeptin-hemisulfate, 3.3 mM sodium azide) was added. To remove urinary sediments such as whole cells, large membrane particles, and other debris, urine specimens were centrifuged at 4000 rpm for 15 minutes at 4℃. The aliquot of supernatant was stored at −80℃ until use.15
Creatinine normalization
Urine molecule concentration depends on several biological variables such as fluid intake, body composition, hepatic function, and renal function.16 Because urinary creatinine concentration serves as an indicator of urine molecule concentration level, we measured the level of urine creatinine. Urinary creatinine was measured according to the manufacturer's protocol (R&D systems Inc., Minneapolis, MN, USA). Briefly, 50 µl of 20-fold diluted urine samples and standards were mixed with 100 µl of alkaline picrate solution and were incubated in the dark for 30 minutes. Absorbance of each well was measured on a microplate reader (Sunrise, Tecan Trading AG, Switzerland) set to 490 nm, and was analyzed using Magellan software (Magellan™-data analysis software, Tecan Trading AG). Creatinine normalization of each candidate was calculated by dividing the concentration of each molecule by urine creatinine.
ELISA of TG2, syndecan-4, and α-1 microglobulin in urine
TG2 (Mybiosource, San Diego, CA, USA), syndecan-4 (SDC4) (R&D Systems), and α-1 microglobulin (A1M) (abcam, UK) were quantified using ELISA kit according to the manufacturer's protocol. To detect TG2, 100 µl of 60-fold diluted urine sample and standards were added to the bottom of micro ELISA plate wells and were incubated for 90 minutes at 37℃. Biotinylated detect antibody was then added to each well and incubated for 1 hour at 37℃. The plate was washed three times with wash buffer. Horseradish peroxidase conjugated working solution was then added to each well and incubated for 30 minutes at 37℃. After washing, 90 µl of substrate solution was added and incubated for 15 minutes at 37℃. Absorbance of each well was measured on a microplate reader (Sunrise) set to 450 nm. To detect A1M, 50 µl of 20,000-fold diluted urine sample and standards were added to wells and incubated for 120 minutes at room temperature. To detect SDC4, 100 µl of non-diluted urine sample were added to the well and incubated for 120 minutes at room temperature. Thereafter, procedures similar to that of TG2 ELISA were performed according to their own protocol. Each candidate was normalized by their respective creatinine value.
Cytometric bead array of MCP-1, IP-10, and IL-6 in urine
Levels of MCP-1, IP-10, and IL-6 were measured using cytometric bead array method by using cytometric bead array flexset kit (BD Life Science, CA, USA), according to the manufacturer's protocol. Briefly, 50 µl of mixed capture beads were added to the same volume of urine or standard and incubated for 1 hour at room temperature in the dark while shaking to allow binding between cytokines and capture beads. PE detection reagent was then added to each tube and incubated for 2 hr at room temperature in the dark while shaking. For IL-6 analysis, we extended the reagent treatment for 1 hr in order to enhance the signal. Fluorescence-labeled cytokine-specific beads were detected with flow cytometry and analyzed with FLAP array software (BD). Each candidate was normalized by their respective creatinine value.
For-cause allograft biopsy and matched urine specimens
A total of 123 patients had for-cause biopsy at the time of enrollment. Urine specimen was collected 2–3 hours before biopsy. At least seven glomeruli and one artery were included in all biopsies, which was adequate to diagnose and categorize rejection.
Among those biopsies, eight were diagnosed as polyomavirus type BK nephropathy and were excluded to eliminate the effect of viral infection on tubulointerstitial inflammation. All biopsy specimens were graded according to the Banff 2013 classification5 by two renal pathologists (Y.M.C. and H.G.). Banff criteria used for scoring included glomerulitis (g), interstitial inflammation (i), tubulitis (t), intimal arteritis (v), peritubular capillaritis (ptc), transplant glomerulopathy (cg), mesangial matrix increase (mm), interstitial fibrosis (ci), tubular atrophy (ct), vascular fibrous intimal thickening (cv), arteriolar hyaline thickening (ah), and C4d. The diagnosis of no major abnormalities (NOMOA) was assigned to biopsies that lacked histological disease features. Biopsies diagnosed as interstitial fibrosis (ci) and tubular atrophy (ct) not otherwise specified were defined as having a ci-score >1 and no features of specific disease. Acute and chronic active antibody-mediated rejection were morphologically diagnosed according to the Banff classification.
Statistical analysis
Participants from the cohort were categorized into three subgroups: recipients with for-cause biopsy, recipients with stable graft function, and living kidney donors. Categorical variables are expressed as absolute and relative frequencies. Quantitative variables are expressed as mean and standard deviation (SD). Differences among means were analyzed using analysis of variance (ANOVA) for continuous variables. Quantification of urinary biomarker candidates was adjusted by urinary creatinine, and subsequently natural log-transformed prior to analysis. Multivariable linear regression analysis was performed to estimate the degree of correlation between the levels of each biomarker candidate and histopathologic scores that represent each allograft status, such as the sum of Banff ct and ci (ct+ci), t and i (t+i), and g and ptc (g+ptc) scores.
All statistical analyses were performed using SPSS version 21.0 for Windows (SPSS Inc., Chicago, IL, USA) and R software version 3.1.2 (R Foundation for Statistical Computing, Vienna, Austria). Statistical significance was assumed at p<0.05.
RESULTS
Patients
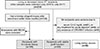
This cross-sectional cohort study was conducted from July 2015 to July 2017. We collected 210 urine specimens from the 210 kidney transplant recipients who underwent living donor or deceased donor kidney transplantation at our center. Of the 87 recipients who did not have for-cause biopsy, a total of 34 recipients did not meet the criteria for stable graft function: 21 recipients had average serum creatinine levels higher than 2.0 mg/dL at the time of enrollment; 8 recipients had one or more history of treatment for acute rejection; 5 recipients were detected with CMV or BKV infection at the time of enrollment. Among the 210 patients, 123 had for-cause biopsy and their urine was sampled before biopsy. After excluding 8 recipients with BK virus nephropathy, the levels of several candidate biomarkers in this for-cause biopsy group (n=115) were compared with those of recipients with stable allograft function (n=53) and living kidney donors (n=50) just before donor nephrectomy (Fig. 1).
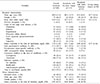
Participant characteristics are shown in Table 1. Compared with the two recipient groups, living kidney donors were younger and had higher body mass index. In addition, serum creatinine in recipients with for-cause biopsy was significantly higher compared with other groups at the time of enrollment. There was no significant difference in the baseline characteristics between recipients with for-cause biopsy and those with stable graft function, except for higher serum creatinine level in those with for-cause biopsy.
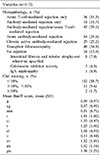
One hundred and fifteen for-cause biopsies were analyzed in this study (Table 2). Sixteen patients (13.9%) had no histologic evidence of rejection. Thirty-six (31.3%) had acute T-cell-mediated rejection only, eighteen (15.7%) had pathologic features suspicious for antibody-mediated rejection only, and forty-five (39.1%) had both acute T-cell-mediated rejection and antibody-mediated rejection. Of the 36 specimens with acute T-cell-mediated rejection only and the 45 specimens with both acute T-cell-mediated rejection and antibody-mediated rejection, borderline changes (n=48, 59.3%) was most frequently diagnosed. Type IA, IB, IIA, IIB, and III rejection were diagnosed in 16 (19.8%), 12 (14.8%), 2 (2.5%), 2 (2.5%), and 1 (1.2%) specimens, respectively. Of the 63 with antibody-mediated rejection, acute antibody-mediated rejection was diagnosed in 34 (54%) and chronic active antibody-mediated rejection was present in 29 (46%) specimens.
Comparison of urinary biomarkers among the three groups
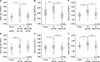
We quantified the level of each biomarker using ELISA kit or cytometric bead array flexset kit in each urine sample. TG2, SDC4, A1M, IL-6, and MCP-1 were significantly higher in the for-cause biopsy group compared with the other two groups (Fig. 2A–C, 2E, F). There was no significant difference in the level of IP-10 between the for-cause biopsy group and the stable graft function group, while the level of IP-10 in the for-cause biopsy group was significantly higher compared with that in the living kidney donor group (Fig. 2D).
Comparison of urinary biomarkers according to the degree of interstitial fibrosis and tubular atrophy
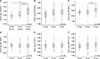
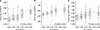
The levels of each biomarker were quantified according to the degree of IFTA in recipients with for-cause biopsy. Of the 115 recipients with for-cause biopsy, minimal (IFTA 0), mild (IFTA 1), and moderate-to-severe (IFTA 2) degree of IFTA were diagnosed in 12, 50, and 53 recipients, respectively. Severity of IFTA degree in the for-cause biopsy showed positive correlation with urinary TG2 level (Fig. 3A). The level of A1M was significantly higher in recipients with moderate-to-severe IFTA compared with those with mild IFTA (Fig. 3C). There was no significant correlation between the degree of IFTA and the levels of other candidate biomarkers (Fig. 3B, D–F).
Comparison of urinary biomarkers between recipients with and without rejection
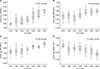
Of the 115 recipients with for-cause biopsy, 99 recipients were diagnosed with T-cell-mediated or antibody-mediated rejection, whereas 16 recipients showed no evidence of rejection. When we compared the levels of biomarkers between recipients with and without rejection, the levels of TG2 and SDC4 were significantly higher in those with biopsy-proven acute rejection (Fig. 4A, B). The level of A1M was higher in those with biopsy-proven acute rejection with marginal significance (Fig. 4C). There was no significant difference in the levels of IP-10, IL-6, and MCP-1 between the two groups (Fig. 4D–F).
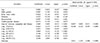
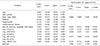
Correlation between each variable and pathologic scores representing histopathologic diagnosis by multivariable linear regression analysis
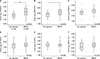
We investigated the correlation between each biomarker and IFTA, tubulointerstitial inflammation, and glomerulitis/peritubular capillaritis. Pearson correlations between the level of each biomarker and lesion scores were calculated. Loge (TG2/Cr) (r2=0.514, p<0.001), loge (A1M/Cr) (r2=0.349, p<0.001), and loge (MCP-1/Cr) (r2=0.403, p<0.001) were positively correlated with the sum of Banff ct and ci scores (Fig. 5). Regarding the sum of Banff t and i scores, loge (TG2/Cr) (r2=0.651, p<0.001), loge (SDC4/Cr) (r2=0.542, p<0.001), and loge (IP-10/Cr) (r2=0.580, p<0.001) were positively correlated while loge (MCP-1/Cr) (r2=−0.467, p<0.001) was negatively correlated (Fig. 6). Multivariable linear regression analysis was performed to estimate the degree of correlation between the levels of each candidate biomarkers and histopathologic scores representing each allograft status after adjusting for age, sex, body mass index, diabetes, hypertension, cardiovascular disease, and the interval between transplant and for-cause biopsy. Multivariable linear logistic regression analysis revealed that loge (TG2/Cr) and the interval between transplant and for-cause biopsy were independent factors, which were both positively correlated with IFTA (ct+ci scores) (Table 3). Regarding tubulointerstitial inflammation (t+i scores), body mass index, loge (TG2/Cr), loge (SDC4/Cr), and loge (IP-10/Cr) were positively-correlated factors, whereas loge (MCP-1/Cr) and the interval between transplant and for-cause biopsy were negatively-correlated factors (Table 4). There was no significant factor that represented glomurulitis/peritubular capillaritis (g+ptc scores).
DISCUSSION
Our analysis of 218 urine samples from kidney transplant recipients and living donor and 115 for-cause biopsies revealed that a composite of urinary biomarkers enables differentiation of tubulointerstitial inflammation from IFTA. Moreover, we showed that the levels of each potent biomarker in urine specimens of patients with clinically stable graft function and living kidney donors were relatively low and distinct from those observed in urines of patients with for-cause biopsy.
This study demonstrates that quantification of several urinary protein may be used to assess the status of kidney allograft injury. Of the six urinary biomarker candidates, only TG2 was significantly correlated with IFTA severity. Also, a composite of biomarkers including TG2, SDC4, IP-10, and MCP-1 reflected the status of tubulointerstitial inflammation. Therefore, quantitative analysis of a composite of biomarkers enabled differentiation of tubulointerstitial inflammation from IFTA. This will help physicians adjust the course of immunosuppressive therapy of kidney transplant recipients. Reasonably, clinical factors such as body mass index and the interval between transplant and for-cause biopsy were shown to be related with tubulointerstitial inflammation and IFTA.
Most studies on diagnostic biomarkers used single non-invasive urinary molecules to assess ongoing acute rejection1. Hricik et al.17 suggested that urinary CXCL9 mRNA and CXCL9 protein were useful for diagnosing acute rejection. According to Ho et al.,18 urinary matrix metalloproteinase-7 was elevated in renal allograft inflammation/injury and has moderate discrimination power for subclinical rejection. Also, aside from serving as a noninvasive biomarker, matrix metalloproteinase-7 is an important pathogenic mediator of kidney fibrosis.19 Several biomarkers such as CXCL10, perforin, granzyme B, and granulysin mRNA as well as CXCL9 and CXCL10 protein have been repeatedly evaluated for their use as urinary biomarkers—however, their diagnostic performances were not consistent.1
TG2 is a member of the transglutaminase enzyme family, and is involved in various biological functions such as angiogenesis,20 apoptosis,21 cell differentiation,22 and wound healing.2324 We have previously reported that TG2 is potentially involved in the stabilization of extracellular matrix by interacting with fibronectin and TGF-β in human abdominal aortic aneurysm.25 In addition, Scarpellini et al. demonstrated that SDC4 is required for cell surface targeting of TG2 as well as the development of kidney fibrosis in chronic kidney disease.11 To our knowledge, our study is the first to verify the value of urinary TG2 and SDC4 as biomarkers for tubulointerstitial inflammation and IFTA in kidney allografts.
We also identified IP-10 as a significant urinary biomarkers for tubulointerstitial inflammation; this is consistent with the results of the study by Suthanthiran et al., in which IP-10 mRNA level in urinary cells contributed to the molecular signature for acute cellular rejection in kidney allografts.13
We also verified urinary A1M and MCP-1 in kidney transplant recipients because they have been reported to be associated with the severity of tubulointerstitial fibrosis.12 In a condition of renal tubule dysfunction, urinary A1M was elevated because proximal tubular reabsorptive capacity was decreased26 and higher urinary A1M was correlated with IFTA on biopsy.27 MCP-1 is a potent chemokine expressed by renal tubular epithelial cells, which induces recruitment of macrophages and renal interstitial fibroblasts and leads to both interstitial and mesangial fibrosis.12 Although both A1M and MCP-1 were correlated with IFTA in univariate analysis, they failed to get a significant association with IFTA in a multivariate analysis. Interestingly, urinary MCP-1 was negatively correlated with tubulointerstitial inflammation in our analysis.
Our study has the following limitations. It is hard to apply the results of this study generally to other cohorts without additional validation because this is an observational study in a single center. The urinary markers were measured at a single time point from urine samples acquired just before for-cause biopsy, living donor nephrectomy, or at outpatient clinics. Therefore, this study cannot validate biomarkers for early diagnosis of inflammation or fibrosis. We are now collecting urinary samples prospectively in patients who have kidney transplantation to evaluate and validate predictive biomarkers for early detection of tubulointerstitial inflammation or fibrosis. Urine samples are collected postoperative three days, one week, one month, three months, six months, and one year. When a recipient need for-cause biopsy, additional sample is collected just before the biopsy. In search of more specific and sensitive biomarkers, we are isolating exosomes to analyze exosomal proteins and small RNAs. In addition, R-squared values in the multivariable regression analyses are relatively small suggesting that those models do not have enough predictive value. We also lack data from an external subset of cohort to validate our results. In spite of several limitations, this study is worthy in that it revealed the association between a composite of urinary biomarkers and tubulointerstitial pathologic findings.
In conclusion, we have shown that a composite of urinary biomarkers including TG2, SDC4, IP-10, and MCP-1 proteins enables distinction between tubulointerstitial inflammation and IFTA. Validation of our results in a larger external cohort may provide a means of assessing immune status in kidney allograft recipients while minimizing the need for an invasive biopsy.
 XML Download