

 PDF
PDF ePub
ePub Citation
 Print
Print


INTRODUCTION
Type 2 diabetes mellitus (T2DM) is a common and frequent disorder, which is seriously harmful to human health with a clear genetic susceptibility (123). By the year 2030, an estimated 350 million individuals worldwide will suffer from diabetes (4), with approximately 100 million people with T2DM in China alone (5). However, this disease is usually caused by the combination of gene and environment. Therefore, it's helpful to identify vulnerable populations with high risk of T2DM by studying the either gene-gene interaction or gene-environment interaction (67), thereby managing early prevention.
As known, insulin resistance (IR) and β-cell dysfunction contribute to T2DM (8). It has been suggested that forkhead box O1 (FOXO1) is closely related to the 2 pathogenesis of T2DM. Activated FOXO1 leads to IR by regulating transcription of target gene, resulting in an increase of the gluconeogenesis and hepatic glucose production in liver; it also leads to β-cell dysfunction by decreasing β-cell proliferation and compensatory ability in islet (910). Furthermore, activity of FOXO1 is mainly regulated through insulin/insulin-like growth factor signaling pathway insulin receptor substrate (IRS)-AKT-FOXO1 (11). Furthermore, IRS2 knockout mice have a progressive development of T2DM, with IR and progressive deterioration of β-cell (12). The IRS
+/− mice with heterozygous knockout FOXO1 can significantly improve sensitivity of hepatic insulin and prevent diabetes (13), as well as prevent function failure of β-cell (14). Thus, FOXO1 and IRS2 may be co-involved in IR and β-cell dysfunction, and their interaction may promote the occurrence of T2DM.
Previously, different results have been shown in association of single nucleotide polymorphisms (SNPs) at IRS2 gene and FOXO1 gene with T2DM in multiple populations (1516171819), which may be due to the various ethnic groups. However, it is still unclear whether the FOXO1-IRS2 interaction or the 2 genes-environment interaction could increase T2DM susceptibility, especially in East Asian population. This study aimed to investigate the impact of FOXO1-IRS2 interaction or the 2 genes-environment interactions on T2DM susceptibility in Chinese Han population in Chongqing.
MATERIALS AND METHODS
Subjects
We collected a total of 780 cases from a Chinese Han population in Chongqing, including 474 cases of T2DM and 306 cases of healthy controls. There was no blood relationship among these individuals. Cases of healthy control group were subjected to oral glucose tolerance testing (OGTT) to exclude diabetes and impaired glucose regulation (IGR). Diabetes and IGR were diagnosed according to 1999 World Health Organization (WHO) standard. Criteria for the diagnosis of diabetes was fasting plasma glucose (FPG) ≥ 126 mg/dL (7.0 mmol/L) or the 2-hour plasma glucose (2-hr PG) ≥ 200 mg/dL (11.1 mmol/L) during an OGTT. Criteria for the diagnosis of IGR was FPG ≥ 110 mg/dL (6.1 mmol/L) or the 2-hr PG ≥ 140 mg/dL (7.8 mmol/L) during an OGTT. Exclusion criteria included: 1) patients with a history of ketoacidosis; 2) patients requiring continuous insulin treatment; 3) patients having exocrine pancreatic disease; or 4) patients with exceptionally early age of disease onset (< 30 years). Moreover, the obesity was defined by waist circumference of 90 and 80 cm for men and women respectively according to the definition of International Diabetes Federation (IDF). This study was approved by the ethics committee of our institute, and all the subjects signed the informed consent.
Clinical measurements
All participants underwent a demographic, anthropometric, and biochemical investigation as described previously (20). Briefly, anthropometric parameters such as height, weight, blood pressure, waist and hip circumference were measured. Body mass index (BMI) and the waist-to-hip ratio (WHR) were calculated. Subjects were conducted with 75 g oral glucose tolerance test. Fasting blood samples were taken at 2 hours after serving sugar, and then DNA isolation and biochemical indices detection were performed. Glucose oxidase method was used to detect blood glucose, radioimmunoassay was used to detect insulin, and automatic biochemical analyzer was used to detect blood lipids. Homeostasis model assessment (HOMA) calculated by FPG and insulin was used for estimating IR index and β-cell function (21).
Selection of SNPs loci
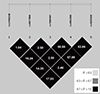
According to public SNP database of National Center for Biotechnology Information (NCBI), we selected 15 SNPs from missense mutation of exon region, promoter, introns and a 3'-none-coding region with high degree of heterozygosity (heterozygosity > 0.1) in FOXO1 gene. In the 105 cases of Chinese Han population in Chongqing (48 healthy cases, 57 T2DM cases), we analyzed the 15 SNPs by polymerase chain reaction-based restriction fragment length polymorphism (PCR-RFLP) and gene sequencing. Polymorphism was not found with the reported SNPs from the 3 databases (including 2 missense mutations). Finally, we conducted association analysis of the 5 loci from the screened genes of the 12 SNPs that were coincided with Hardy-Weinberg equilibrium (48 cases of healthy individuals and 57 cases of T2DM patients, P > 0.05) (Table 1), and they were rs17592236, rs9577066, rs7986407, rs4581585, and rs4325426, respectively (standardized LD coefficient [D'] > 0.7). Then, linkage disequilibrium (LD) analysis was performed again with much more cases (204 cases of healthy individuals and 414 cases of T2DM patients) to confirm the 5 selected loci (Fig. 1). Furthermore, according to literatures (222324), Gly1057Asp and −769C/T loci in IRS2 gene were selected to conduct the further detection.
Table 1
LD coefficients (D' and r2) among 12 SNPs in FOXO1
Fig. 1
LD maps for SNPs genotyped in FOXO 1 gene.
Shades of gray show the strength of the pairwise LD based on D', and numbers indicate the value of r
2 expressed as a percentage.
LD = linkage disequilibrium, SNP = single nucleotide polymorphism, FOXO1 = forkhead box O1, D' = standardized LD coefficient.
Genotype identification of SNPs loci
Phenol-chloroform method was used to extract genomic DNA. The primers were designed and synthesized based on public SNP databases and relevant literatures. SNPs genotypes were identified by PCR-RFLP. The PCR products with different enzyme genotype were randomly selected and confirmed by sequencing. PCR primer, reaction condition, and restrictive enzyme of each SNP locus are listed in Table 2.
Table 2
PCR primers, reaction condition, and restriction enzymes
Statistical analysis
Statistical analysis was performed by SPSS 11.5 software (SPSS Inc, Chicago, IL, USA): categorical data was represented by rate (%); continuous data was represented by mean plus or minus standard deviation (± s); comparison of clinical data between the 2 groups was conducted by t-test; comparison between allele and genotypic distribution was conducted by χ2 test; relative T2DM risk of with SNP genotypes was analyzed by non-conditional logistic regression analysis, which was represented by odds ratio (OR) and 95% confidence interval (CI), and the relative risk OR was used to adjust age and gender. Linkage Disequilibrium Analyzer (LDA) 1.0 software (Chinese National Human Genome Center, Beijing, China) was used to perform Hardy-Weinberg equilibrium and LD analysis. Multifactor dimensionality reduction (MDR) was used for analysis of the interaction between genes or gene and environment by MDR_3.0.2 software (Computational Genetics Laboratory of the University of Pennsylvania, Philadelphia, PA, USA). This method effectively reduced high-dimensional data into 2-dimensional data and established multi-factor interaction model with different combinations. The model with highest cross-validation consistency (CVC) and the maximum testing balanced accuracy (TBA) was considered as a best model. If interactive model had statistical significance (P < 0.05), then MDRpt-1.0_beta_2 software was used to conduct permutation test, which further confirmed the reliability of the result.
RESULTS
Clinical characteristics
Clinical features of the subjects are shown in Table 3. There was no significant difference in age, sex, diastolic blood pressure (DBP), total cholesterol, and low-density lipoprotein cholesterol between the 2 groups. However, T2DM patients had significantly higher BMI, WHR, waist, systolic blood pressure (SBP), triglycerides (TG), fasting glucose, 2-hour blood glucose after OGTT, fasting insulin, and 2-hour insulin after oral glucose compared with control subjects. In contrast, high-density lipoprotein cholesterol and homa-β were lower in the T2DM group compared to controls. As expected, T2DM patients had IR compared to controls, as evaluated by homeostasis model assessment of insulin resistance index (HOMA-IR).
Table 3
Clinical characteristics of the subjects
HOMA-IR = (FPG × Fasting insulin)/22.5; HOMA-β = 20 × Fasting insulin/(FPG − 3.5). After adjusting of age, BMI, WHR, and waist were compared; after adjusting age, BMI, and WHR, the other indicators were compared.
T2DM = type 2 diabetes mellitus, BMI = body mass index, WHR = waist-to-hip ratio, SBP = systolic blood pressure, DBP = diastolic blood pressure, TG = triglycerides, FPG = fasting plasma glucose, HOMA-IR = homeostasis model assessment of insulin resistance index, HOMA-β = homeostasis model assessment of β-cell function.
Compared with normal control: *P<0.01.
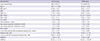
Rs7986407 and rs4581585 in FOXO1 gene and IRS2 gene are associated with T2DM
A allele frequency (31.2% vs. 24.2%; χ2 = 7.798; P = 0.005) of rs7986407 locus and AA genotype (12.0% vs. 7.4%; χ2 = 7.070; P = 0.029) in T2DM group (414 cases), as well as CC genotype frequency of rs4581585 locus were significantly higher than those in control group (290 cases). However, there was no significant difference in other loci between the 2 groups (P > 0.05). Association analysis showed that the T2MD risk of individuals with rs7986407 AA genotypes was 2.092 times higher than that with GG genotype, and the T2MD risk of individuals with rs4581585 CC genotypes was 2.57 times higher than those with TT genotype. Taken together, it indicates that both rs7986407 locus and rs4581585 locus are closely related to the risk of T2DM (Table 4).
Table 4
Association between polymorphisms in FOXO1 and the risk of T2DM
Genotype distributions were shown with number (%). ORs, 95% CI, and P values were from logistic regression analyses with additive, dominant, and recessive models controlling for age and sex as covariates. In additive models, ORs was expressed per difference in number of rare allele. Genotype was given codes of (0, 1, and 2), (0, 1, and 1), (0, 0, and 1) in additive, dominant and recessive models, respectively.
FOXO1 = forkhead box O1, T2DM = type 2 diabetes mellitus, SNP = single nucleotide polymorphism, OR = odds ratio, CI = confidence interval.
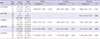
Gly1057Asp locus in IRS2 gene is associated with T2DM
A allele and AA genotypic frequency of Gly1057Asp locus in T2DM group (474 cases) were significantly lower than those in control group (306 cases), 32.8% vs. 38.5% (χ2 = 5.383; P = 0.02) and 10.5% vs. 13.4% (χ2 = 6.743; P = 0.034), respectively (Table 5). The T2DM risk of individuals with GG genotype of Gly1057Asp was 1.42 times higher compared to AA genotype (additive model: OR = 1.422; 95% CI = 1.037–1.949; P = 0.029), indicating a significant association of GG genotype of Gly1057Asp with T2DM. Furthermore, allele and genotypic frequency distribution of −769C/T locus had neither a significant difference between the 2 groups, nor an apparent association with T2DM (P > 0.05) (Table 5).
Table 5
Associations between polymorphisms in IRS2 and the risk of T2DM
Genotype distributions are shown as number (%). ORs, 95% CI, and P values were from logistic regression analyses with additive, dominant, and recessive models controlling for age and sex as covariates. In additive models, ORs are expressed per difference in number of rare allele. Genotype were given codes of (0, 1, and 2), (0, 1, and 1), (0, 0, and 1) in additive, dominant and recessive models, respectively.
IRS2 = insulin receptor substrate 2, T2DM = type 2 diabetes mellitus, SNP = single nucleotide polymorphism, OR = odds ratio, CI = confidence interval.
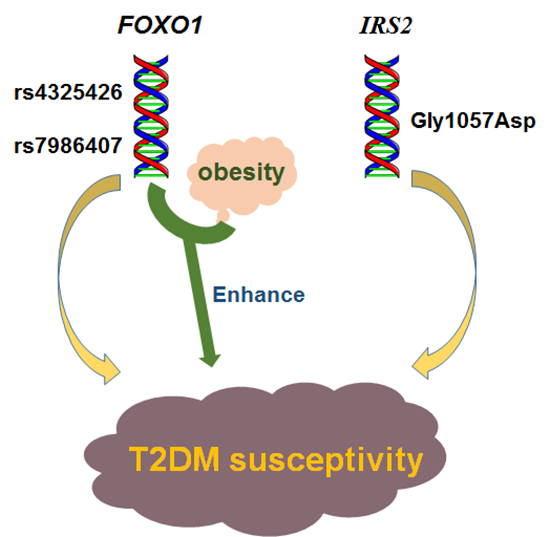
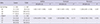
T2DM susceptibility is increased due to the interaction between rs7986407 or rs4325426 in FOXO1 gene and obesity
Analysis of inter-gene interaction was conducted by MDR method for the 7 SNPs at FOXO1 and IRS2, showing no interaction model for T2DM (P > 0.05) (data not shown). It indicates that the FOXO1-IRS2 gene interaction is irrelevant to the prevalence of T2DM
Next, we analyzed the gene-environment interaction between the 7 SNPs and environment factors (aging, obesity, and hypertriglyceridemia). MDR analysis suggested that the interaction model composed of the 3 factors, rs7986407, rs4325426, and waist, was the best model with statistical significance (P value from sign test [Psign] = 0.0251; P value from permutation test [Pperm] = 0.000–0.001) (Table 6 and Fig. 2). Moreover, case/control ratio of more than 1.23 was defined as high-risk, and the ratio of less than 1.23 was defined as low-risk. T2DM incidence in high-risk group was increased significantly compared to low-risk group, and its OR was 3.976 (95% CI = 1.156–13.675), indicating that rs7986407, rs4325426, and waist are associated with T2DM. In case of non-obesity, the risk of T2DM was increased in individuals with AA of rs7986407 combined with CC or AC of rs4325426, as well as AG of rs7986407 combined AA of rs4325426; while in obesity, individuals with AA of rs7986407 and any genotype of rs4325426, or individuals with AA of rs4325426 and any genotype of rs7986407 were prone to T2DM.
Table 6
MDR models of gene-environmental interactions on T2DM

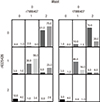
Fig. 2
Distribution of high-risk and low-risk genotypes in the best 3-factor model.
High-risk genotypes are in dark gray and low-risk genotypes are in light gray. The number of T2DM patients (left bar in boxes) and control subjects (right bar in boxes) are shown for each 3-factor combination. rs7986407: 0 for AA genotype, 1 for AG genotype, 2 for GG genotype; rs4325426: 0 for AA genotype, 1 for AC genotype, 2 for CC genotype; Age: 0 for ≤ 40 years, 1 for > 40 years and ≤ 60 years, 2 for > 60 years; BMI: 0 for < 25 kg/m2, 1 for ≥ 25 kg/m2; Waist: 0 for < 90 cm (male) or 80 cm (female), 1 for ≥ 90 cm (male) or 80 cm (female); TG: 0 for < 1.7 mmol/L, 1 for ≥ 1.7 mmol/L.
T2DM = type 2 diabetes mellitus, BMI = body mass index, TG = triglycerides.
DISCUSSION
In this study, we showed that there were significant differences in genotype distributions of rs7986407 and rs4581585 in FOXO1 gene between control group and T2DM group, suggesting that FOXO1 gene mutation is associated with T2DM. AA genotype for rs7986407 and CC genotype for rs4581585 increase the risk of T2DM in Chinese Han population in Chongqing. The association of FOXO1 gene mutation with T2DM was not found in Caucasians and African-Americans in the past (17), but the study of a population in Germany and Finland suggested that FOXO1 gene mutation was associated with the increasing risk of T2DM. Thus, one possibility could be that the inconsistence of these findings may be associated with ethnic differences. However, the study on the Chinese Han population by Li and colleagues (19) suggested that SNPs at FOXO1 were not associated with T2DM. The selected SNPs in our study almost covered the whole FOXO1 gene. Among the SNPs, the rs17592236 was the only one detected by Li et al. (19). Therefore, the inconsistent results between our study and the Li and colleagues' study may be related to the different selection of SNPs. Previously, it has been reported in Asian population (including other population besides Chinese population) that IRS2 gene was associated with T2DM (1516). Although there was obvious ethnic difference, in line with the Asian population study, we found that IRS2 gene mutation was also associated with T2DM, and GG genotype for Gly1057Asp locus increased the risk of T2DM in Chinese Han population in Chongqing.
Based on the above findings, polymorphism of FOXO1 and IRS2 may be both associated with the risk of T2DM, we asked ourselves whether there is an interaction between them, which would increase susceptibility to T2DM. To answer the question, we analyzed 7 SNPs at FOXO1 and IRS2 by MDR, suggesting that there is no association of T2DM prevalence with FOXO1-IRS2 genes interaction. Although FOXO1 and IRS2 were associated and interacted with each other by pathophysiology and signaling transduction (111314), they may not be related to each other through molecular biology directly; and the interaction between them had no effect on prevalence of T2DM.
Genetic susceptibility is an important factor to T2DM, but the result of genome-wide association studies (GWAS) can only explain about 10% of the risk of T2DM susceptibility. This is because the prevalence of T2DM is also related to environmental factors, and the interaction between genetic factors and environment also has an important influence on individual illness (62526). Therefore, it is more beneficial to identify the T2DM susceptible population by studying the gene-environment interaction. Aging, high-fat diet, lack of exercise, and obesity are environmental factors that affect the prevalence of T2DM. In this study, we analyzed the interaction between SNPs of either FOXO1 or IRS2 and aging, obesity, and high TG hyperlipidemia. It suggested that the risk of T2DM prevalence can be increased by FOXO1-obesity interaction.
In this study, we analyzed the interactions between either rs7986407 locus or rs4325426 locus in FOXO1 and obesity. In the case of non-obesity, T2DM susceptibility was increased in individuals with AA of rs7986407 locus in combination with heterozygous rs4325426 or individuals with AA of rs4325426 locus in combination with heterozygous rs7986407; while in obesity, if obesity-related environment factors existed, T2DM susceptibility would be increased in individuals with AA genotype for rs7986407 or with AA genotype for rs4325426. These data suggest that the FOXO1-obesity interaction increases susceptibility to T2DM. Interestingly, the result of correlation analysis was inconsistent with the interactive loci of FOXO1 gene and obesity to the prevalence of T2DM. Correlation analysis suggested that there was no association between obesity and rs4581585 locus that may increase risk of T2DM; while rs4325426 locus was not related to the risk of T2DM, but associated with obesity in T2DM susceptibility. Thus, it can be seen that the gene-gene interaction and gene-environment interaction are complex, and genetic impact on incidence of individual would change dependent on environmental factors (27). The risk of individual susceptibility may not be truly and fully reflected by only studying the genetic influence on the prevalence of T2DM (67). Therefore, the study in the influence of gene-gene interaction and gene-environment interaction on T2DM susceptibility would be possible to find real high-risk susceptible populations.
Our study also has limitations. One of the limitations in this study was that the numbers of SNPs were not sufficient to capture most genetic information of the candidate genes. Another limitation was that we used MDR method to analyze gene-gene interaction and gene-environment interaction. However, the MDR method can only be used in association studies for qualitative traits. Future studies should elaborate on our findings by including more haplotype tagging or functional SNPs in the studied candidate genes by multiple analysis methods.
In summary, this study suggests that FOXO1 and IRS2 genes are T2DM susceptibility genes in Chinese Han population in Chongqing; obesity with genotypes of rs7986407 locus AA or rs4325426 locus AA in FOXO1 gene might be a high-risk factor of T2DM. Different interactions between T2DM susceptibility genes and environment factors would lead to different rate of T2DM susceptibility between individuals. Therefore, by studying the influence of gene-environment interaction on T2DM susceptibility, finding high-risk T2DM population, and focusing prevention and intervention on them, it may be an effective strategy to reduce the prevalence of T2DM.
 XML Download