

 PDF
PDF ePub
ePub Citation
 Print
Print


INTRODUCTION
Chronic kidney disease-mineral and bone disorder (CKD-MBD) is defined as a systemic disorder of mineral and bone metabolism accompanying the decline of kidney function, and is characterized by biochemical abnormalities in mineral metabolism, abnormalities in skeletal remodeling, and extraskeletal calcification (1). Recent studies have shown that there are associations between CKD-MBD and an increased risk of cardiovascular disease and fractures, and even high mortality rates (234). Therefore, the Kidney Disease: Improving Global Outcomes (KDIGO) guidelines recommend monitoring laboratory abnormalities in the serum levels of calcium, phosphorus, parathyroid hormone (PTH), alkaline phosphatase activity, and 25-hydroxyvitamin D (calcidiol), which are the hallmarks of established CKD-MBD, beginning in CKD stage 3 (15). Moreover, emerging data indicate that CKD-MBD begins early in the low end of the estimated glomerular filtration rate (eGFR) in CKD stage 2 (6). Increased fibroblast growth factor 23 (FGF23) is a common manifestation of CKD that develops earlier than increased phosphate or PTH (7). Experimental studies showed that klotho decline may precede both hyperphosphatemia and increased FGF23 (89).
Several studies have shown ethnic differences in the regulation of mineral and bone metabolism in patients with CKD. Black patients had less hyperphosphatemia, lower levels of serum calcium and FGF23, and higher PTH concentration compared with white patients undergoing hemodialysis (1011). However, there are limited data regarding the ethnic differences in mineral and bone metabolism and vascular calcification between Asian and non-Asian patients with CKD. In a previous study of 58 Korean predialysis patients who underwent bone biopsies, the distribution of types of renal osteodystrophy was different from that of patients from Western countries, suggesting possible ethnic differences between Asian and white people (12).
Therefore, we examined the abnormalities of biochemical parameters in mineral metabolism and bone parameters, and vascular calcification rates in Korean patients with CKD not yet on dialysis, based on a patient-based cohort study that enrolled ethnic Korean adults with any stage of CKD. This study may increase our understanding of CKD-MBD in Korean patients with regard to ethnic differences.
MATERIALS AND METHODS
Study design and patient population
The KoreaN Cohort Study for Outcomes in Patients With Chronic Kidney Disease (KNOW-CKD) was launched in 2011. Details on the design, methods, and exclusion criteria of the KNOW-CKD were published previously (13). KNOW-CKD is supervised by a CKD advisory committee that is comprised of individuals from the Korea Centers for Disease Control and Prevention and the Korean Society of Nephrology (13).
We analyzed baseline data recorded between June 2011 and February 2016 for 2,238 KNOW-CKD participants in order to characterize the biochemical parameters of CKD-MBD, describe the prevalence of osteoporosis, and evaluate vascular calcification in relation to CKD stages or primary renal disease.
Data collection and definitions
Baseline demographics and laboratory data were retrieved from the electronic data management system of the Seoul National University Medical Research Collaborating Center (PhactaX; Seoul National University Hospital, Seoul, Korea) with the assistance of the Division of Data Management. Anthropometric measurements including height and weight were conducted at the clinic. Serum samples were collected at baseline according to our standardized protocol and sent to a central laboratory (Lab Genomics, Seongnam, Korea) for measurement of creatinine, intact parathyroid hormone (iPTH), 25-hydroxyvitamin D3 (25D), and 1,25-dihydroxyvitamin D3 (1,25D). Other laboratory data were analyzed at the hospital laboratory of each participating center. Serum creatinine concentration was measured using an assay traceable to the international reference material. The definition of CKD stages 1–5 was based on the eGFR, which was calculated using the four-variable Modification of Diet in Renal Disease (MDRD) formula (14). We further refined stage 3 as eGFR of 45 to 59 mL/min/1.73 m2 (stage 3a) and eGFR of 30 to 44 mL/min/1.73 m2 (stage 3b), according to the 2012 KDIGO Clinical Practice Guideline for the Evaluation and Management of CKD (15). Serum FGF23 (Immutopics International, San Clemente, CA, USA) was measured in the central laboratory (Lab Genomics) with an enzyme-linked immunosorbent assay kit. Samples were assayed in duplicate, and all results were reported as mean values. Detailed protocols for the measurement of other laboratory parameters were previously described (13).
Our study defined serum 25D levels < 20 ng/mL as vitamin D deficient, 20 to 29.9 ng/mL as insufficient, 30 to 100 ng/mL as normal, and > 100 ng/mL as excess (16).
Bone mineral density (BMD) was estimated using a Hologic dual-energy X-ray absorptiometry (DXA) system. BMD was measured for the lumbar spine (L1–L4), total hip, and femoral neck at baseline. Results were expressed as the T-score (standard deviation [SD] from the average BMD value of young normal subjects). Osteoporosis was defined using the World Health Organization’s T-score criteria, which states that for positive diagnosis, DXA scores must be 2.5 or more SDs below the sex-specific healthy young adult average. Osteopenia was defined as T-scores of −1.0 to −2.4, and T-scores > −1.0 were defined as normal (17).
Measurement of pulse wave velocity
A volume plethysmography apparatus (VP-1000; Collin Co., Komaki, Japan) (18) was used to automatically determine brachial-to-ankle pulse wave velocity (baPWV), using the oscillometric method. Patients with cuffs around both arms and ankles rested for at least 5 minutes in the supine position before measurement. Pulse waves obtained simultaneously from the brachial and tibial arteries were recorded. baPWV was calculated as transmission distance (distance from each arm to each ankle according to height) divided by transmission time (interval between initial increases in the brachial and tibial wave forms). We used baPWV (the mean of the right side and left side values) as a marker of both central and peripheral arterial stiffness.
Statistical analysis
The demographic characteristics and biochemical parameters were evaluated using the one-way analysis of variance or the Kruskal-Wallis test, and the Pearson χ2 test for continuous variables and categorical variables, respectively. Parametric variables were expressed as mean ± SD, and nonparametric variables were expressed as medians with interquartile (25th and 75th percentiles) ranges for continuous variables. Categorical variables are presented as the number and percentage of patients. Pearson’s test was used to evaluate the relationship between biochemical parameters and normally distributed univariate variables; Spearman’s test was used if the distribution was not normal. All statistical tests were two-tailed, and P < 0.05 was considered significant.
Ethics statement
The study protocol was approved by the Institutional Review Boards (IRB) of the Institutional and National Research Committee at which the studies were conducted (IRB approval number NCT01630486) and was in accordance with the 1964 Helsinki declaration and its later amendments or comparable ethical standards. All participating patients provided written informed consent.
RESULTS
Mineral metabolism in relation to CKD stages
The interrelationships between biochemical parameters of mineral metabolism and renal function after dividing the cohort according to the CKD stages are shown in Table 1. Serum calcium and phosphate were relatively stable across the CKD stages, until eGFR levels decreased to 15 mL/min/1.73 m2 (Fig. 1A). Fig. 1B shows the levels of iPTH, 25D, and 1,25D in each CKD stage. Increases in iPTH (> 65 pg/dL) began to occur at eGFR levels of 30 mL/min/1.73 m2. Although the 25D level was lower in all CKD stages, we could not find any correlation between 25D level and eGFR. Interestingly, the 1,25D level decreased continuously with decreasing eGFR, especially in CKD stage 1.
Table 1
Description of biochemical characteristics of mineral metabolism as CKD stages
CKD = chronic kidney disease, SD = standard deviation, iPTH = intact parathyroid hormone, 25D = 25-hydroxyvitamin D3, 1,25D = 1,25-dihydroxyvitamin D3, FGF23 = fibroblast growth factor 23, eGFR = estimated glomerular filtration rate, MDRD = Modification of Diet in Renal Disease, KDIGO = Kidney Disease: Improving Global Outcomes.
*eGFR (mL/min/1.73 m2), calculated using the MDRD equation; and eGFR categories defined by the 2012 KDIGO Clinical Practice Guideline for the Evaluation and Management of CKD; †
P value by Kruskal-Wallis test; ‡
P value for trend (one-way analysis of variance, Jonckheere-Terpstra test, Mantel-Haenszel χ2 test); §
P value by χ2 test.
![]()
 | Fig. 1Distributions of biochemical parameters of mineral metabolism in relation to CKD stages. (A) Calcium and phosphate. (B) iPTH, 25D, and 1,25D.
Error bars denote standard deviation (SD).
CKD = chronic kidney disease, iPTH = intact parathyroid hormone, 25D = 25-hydroxyvitamin D3, 1,25D = 1,25-dihydroxyvitamin D3.
*P < 0.05 for trend between stages.
|
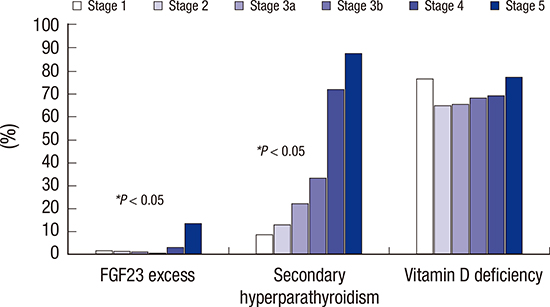
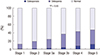
Fig. 2 shows the prevalence of biochemical abnormalities of serum FGF23, iPTH, and vitamin D levels in relation to CKD stages. FGF23 excess, which we defined as FGF23 > 100 RU/mL, increased prominently at eGFR levels below 30 mL/min/1.73 m2. The prevalence of secondary hyperparathyroidism (iPTH > 65 pg/mL) was increased with declined eGFR. Secondary hyperparathyroidism was present in 8.9% of CKD stage 1 patients, 13% of CKD stage 2, 22.4% of CKD stage 3a, 33.3% of CKD stage 3b, 72.2% of CKD stage 4, and 87.8% of CKD stage 5. Furthermore, vitamin D deficiency (25D < 20 ng/mL) was shown to be higher, even in the early stages of CKD, rather than FGF23 excess and secondary hyperparathyroidism. Vitamin D deficiency occurred in 76.7% of patients with CKD, with an eGFR > 90 mL/min/1.73 m2.
 | Fig. 2The prevalence of serum FGF23 excess (FGF23 > 100 RU/mL), secondary hyperparathyroidism (iPTH > 65 pg/mL) and vitamin D deficiency (25D < 20 ng/mL) in relation to CKD stages.
FGF23 = fibroblast growth factor 23, iPTH = intact parathyroid hormone, 25D = 25-hydroxyvitamin D3, CKD = chronic kidney disease.
*P < 0.05 for trend between stages.
|
Bone density in relation to CKD stages
We analyzed BMD in the lumbar spine, total hip, and femur neck in each CKD stage (Table 2). Lumbar spine BMD was increased until eGFR fell below 45 mL/min/1.73 m2, whereas it was decreased at an eGFR level below 45 mL/min/1.73 m2. Total hip BMD was highest in CKD stage 2 (0.59 ± 1.24), and then decreased at an eGFR level below 60 mL/min/1.73 m2. However, femoral neck BMD was decreased uniformly across declining eGFR levels. All BMDs were lowest in CKD stage 5 (lumbar spine, −0.64 ± 1.67; total hip, −0.49 ± 1.21; and femur neck, −1.02 ± 1.25). BMD of the lumbar spine, total hip, and femoral neck in women was significantly lower than that in men across the CKD stages. The prevalence of osteoporosis was higher in patients with a lower eGFR level. Indeed, osteoporosis based on femoral neck BMD in patients with CKD stage 5 was 11.2-fold more prevalent than in those with CKD stage 1 (stage 1, 1.2% vs. stage 5, 13.4%) (Fig. 3). Similar to osteoporosis, the prevalence of osteopenia was significantly higher in patients with a lower eGFR level.
Table 2
BMD, AAC score, and coronary calcium score according to CKD stages
BMD = bone mineral density, AAC = abdominal aorta calcification, CKD = chronic kidney disease, SD = standard deviation, eGFR = estimated glomerular filtration rate, MDRD = Modification of Diet in Renal Disease, KDIGO = Kidney Disease: Improving Global Outcomes.
*eGFR (mL/min/1.73 m2), calculated using the MDRD equation; and eGFR categories defined by the 2012 KDIGO Clinical Practice Guideline for the Evaluation and Management of CKD; †P value by one-way analysis of variance; ‡P value by Kruskal-Wallis test; §P value for trend (one-way analysis of variance, Jonckheere-Terpstra test, Mantel-Haenszel χ2 test); ‖P value by χ2 test.
![]()
Vascular calcifications in relation to CKD stages
To evaluate the vascular calcification in patients with CKD, we used the mean baPWV within each CKD stage (Fig. 4A). There was an association between vascular calcification and increased arterial stiffness, which was measured with PWV, in patients with CKD (19). The mean baPWV was increased across declining eGFR levels. Patients with diabetic nephropathy had the highest mean baPWV among other types of primary renal disease (Fig. 4B). The abdominal aortic calcification (AAC) and coronary calcium score were also increased in the early stages of CKD, and showed peaks in CKD stage 4 (1.9 ± 3.2 and 289.3 ± 683.4, respectively) (Table 2).
 | Fig. 4Values of baPWV within (A) each CKD stage and (B) according to primary renal disease type.
CKD = chronic kidney disease, baPWV = brachial-to-ankle pulse wave velocity, GN = glomerulonephritis, DN = diabetic nephropathy, HTN = hypertensive nephropathy, PKD = polycystic kidney disease.
*P < 0.05 for trends between stages. Error bars = standard deviation (SD).
|
Serum FGF23 correlated with levels of bone mineral metabolism markers
Finally, we determined the association between clinical variables of the CKD-MBD marker and serum FGF23 concentration in patients with CKD (Table 3). The serum FGF23 concentration was significantly correlated with serum phosphate and iPTH (r = 0.236, P < 0.001; r = 0.249, P < 0.001, respectively), and negative correlated with serum calcium, serum level of 25D and 1,25D, and total hip and femoral neck BMD (r = −0.131, P < 0.001).
Table 3
Correlations of CKD-MBD parameters with serum FGF23 concentration
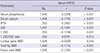
r = Spearman correlation coefficient.
CKD-MBD = chronic kidney disease-mineral and bone disorder, FGF23 = fibroblast growth factor 23, iPTH = intact parathyroid hormone, 25D = 25-hydroxyvitamin D3, 1,25D = 1,25-dihydroxyvitamin D3, BMD = bone mineral density.
![]()
DISCUSSION
The present study showed that increases in both serum FGF23 and iPTH preceded changes in serum calcium and phosphate. Interestingly, the 25D and 1,25D levels decreased earlier than the increase of serum FGF23 or iPTH, with a declining eGFR level. Moreover, we showed that BMD was decreased, and there was a high prevalence of osteoporosis in advanced-stage CKD patients. In addition, vascular calcification began to occur in the early stages of CKD. Serum FGF23 was correlated with serum calcium and phosphate, iPTH, vitamin D levels, and total hip and femur neck BMD.
CKD affects bone and mineral metabolism, with decreased levels of 1,25D and serum calcium, and increased levels of iPTH, FGF23, and serum phosphate, resulting in CKD-MBD. It is well known that phosphate levels are normal in the majority of patients with early and intermediate stages of CKD. Increases in FGF23 and iPTH act as compensatory responses to maintain phosphate balance (2021). In a previous study representing the United States population, serum calcium and phosphate levels were normal until the eGFR became lower than 40 mL/min/1.73 m2 (722). In addition, in the Chronic Renal Insufficiency Cohort (CRIC) study, which included black and Hispanic participants, hyperphosphatemia, which was defined as a serum phosphate level ≥ 4.6 mg/dL, and hypocalcemia were a late manifestation in patients with eGFR < 20 mL/min/1.73 m2 (7). Consistent with previous studies, our finding showed that hyperphosphatemia appears in late stages of CKD, with an eGFR below < 15 mL/min/1.73 m2, and increased FGF23 and iPTH precedes increased serum phosphate levels in a Korean adult population, regardless of ethnic differences.
Serum FGF23 is considered an early biomarker of disordered mineral and bone metabolism in patients with CKD. Our findings are consistent with previous results showing that the FGF23 level was high in CKD patients with decreased eGFR, increased iPTH, and decreased 25D and 1,25D levels (2324). According to the CRIC study, the FGF23 level was elevated early, before PTH and phosphate levels increased, and steadily increased with the progression of kidney disease (7). However, in our study, secondary hyperparathyroidism was more prevalent than FGF23 excess in the early and intermediate stages of CKD, although a median value of iPTH exceeding 65 pg/mL was shown at an eGFR below 30 mL/min/1.73 m2, similar to that of Western populations (22). Moreover, our results showed a very high prevalence of 25D and 1,25D deficiency in a Korean population compared with that in Western populations, even at higher levels of eGFR (212225). In data from the Fourth Korean National Health and Nutritional Examination Survey 2008, the overall prevalence of vitamin D deficiency (25D < 15.0 ng/mL) was as high as 29.9%, and serum 25D levels started to decrease below an eGFR level of approximately 60 mL/min/1.73 m2 (26). A cohort of 113 CKD stage 3 and 4 patients showed that Southeast Asians had a lower 25D level than Caucasians (10.3 ± 6.4 vs. 20.3 ± 8.7 ng/mL, respectively) (27). Patients of the Asian-origin ethnic group are known to be at risk for hypovitaminosis D due to diet and lack of sunlight exposure (28). Furthermore, 1,25D deficiency promotes parathyroid gland hyperplasia and increased PTH synthesis through loss of the effect of negative feedback of vitamin D (29). Therefore, a decrease of 1,25D levels seemed to occur earlier in the course of eGFR decline than dose elevations in iPTH levels in our study. Larger representative studies are necessary to investigate the prevalence of vitamin D deficiency across different ethnic groups and levels of kidney dysfunction. Furthermore, research is also needed to determine whether a decreased 1,25D level drives the vicious cycle of mineral metabolism in Korean patients with CKD (8).
Patients who have impaired renal function tend to have a lower BMD than the general population (30). In a study from the Third National Health and Nutrition Examination Survey of 13,831 patients over 20 years old in the United States, women and men with osteoporosis were concentrated in the low range of creatinine clearance (CCr); the prevalence of osteoporosis for CCr < 35 mL/min was found to be 24% in women and 11% in men (31). Comparable with the previous study of Americans, decreased BMD and a high prevalence of osteoporosis were observed with declining eGFR. In addition, lower BMD in women was seen across the CKD stages (32). Moreover, femoral neck BMD, which may be less influenced by AAC, was more correlated with decreased eGFR than other BMD measurement sites. Furthermore, a recent prospective study found that femoral neck BMD is useful for identifying nonspine fracture risk in patients with or without CKD (33). A recent meta-analysis showed that BMD can discriminate fracture status in CKD patients (3334). In this sense, we found that femoral neck BMD is negatively correlated with FGF23 level, which has been related to the risk of fracture in elderly CKD patients in several studies (2435). However, there are still many unresolved issues about the Korean population with CKD-MBD, including the association between lower BMD and fracture risk. Meanwhile, bone loss is mostly from cortical bone in CKD with MBD, because hyperparathyroidism typically causes catabolic effects on cortical bone and anabolic effects on trabecular bone; whereas in osteoporosis, both cortical and trabecular bone are lost (3637). Therefore, further studies using peripheral quantitative computed tomography to measure cortical and trabecular bone density are required to examine whether CKD-MBD such as hyperparathyroidism and/or adynamic bone disease or osteoporosis is strongly associated with fractures in patients with CKD (38).
Cardiovascular disease is the leading cause of death in patients with CKD. Although its pathophysiology is multifactorial, vascular calcification is considered to be one of the major contributory factors. A recent prospective and observational French study showed that aortic and coronary artery calcification scores could predict all-cause and cardiovascular mortalities in CKD patients (39). In a study of CKD patients with diabetes in the Netherlands, the descending thoracic aorta calcium score was independently associated with arterial stiffness and associated with decreased eGFR, similar to the findings of our study (40).
The present study has several limitations. First, as with any cross-sectional study, we were unable to examine the longitudinal changes in laboratory findings and bone and vascular calcification parameters over time. Second, because only baseline data were used in this study, we were unable to determine the causal relationships of CKD-MBD parameters with fracture risk and cardiovascular mortality. Third, we analyzed the descriptive data and did not adjust for confounding factors such as age, gender, comorbidities, and medicine. Our results could be affected by many confounding factors.
To conclude, in a large population of Korean patients with CKD, we found that serum vitamin D level declined early in CKD before significant elevations in level of FGF23 and iPTH were observed. Moreover, FGF23 elevation observed concurrently with increased iPTH with declining eGFR, dissimilar to Western populations. The prevalence of osteoporosis was higher in CKD patients with decreased eGFR. Also, increased vascular calcification scores were noted in the early stages of CKD, similar to that of Western populations. Further studies in both epidemiology and pathophysiology are needed to determine the association between CKD-MBD and clinical outcomes in the Korean population.
 XML Download