Journal List > J Korean Med Sci > v.32(3) > 1108625

Lee, Cho, Kim, Yoon, Park, Lee, Lee, and Lee: Who Dies after ICU Discharge? Retrospective Analysis of Prognostic Factors for In-Hospital Mortality of ICU Survivors

Abstract

We investigated the causes of inpatient death after intensive care unit (ICU) discharge and determined predictors of in-hospital mortality in Korea. Using medical ICU registry data of Seoul National University Hospital, we performed a retrospective cohort study involving patients who were discharged alive from their first ICU admission with at least 24 hours of ICU length of stay (LOS). From January 2011 to August 2013, 723 patients were admitted to ICU and 383 patients were included. The estimated in-hospital mortality rate was 11.7% (45/383). The most common cause of death was respiratory failure (n = 25, 56%) followed by sepsis and cancer progression; the causes of hospital death and ICU admission were the same in 64% of all deaths; sudden unexpected deaths comprised about one-fifth of all deaths. In order to predict in-hospital mortality among ICU survivors, multivariate analysis identified presence of solid tumor (odds ratio [OR], 4.06; 95% confidence interval [CI], 2.01–8.2; P < 0.001), hematologic disease (OR, 4.75; 95% CI, 1.51–14.96; P = 0.013), Sequential Organ Failure Assessment (SOFA) score upon ICU admission (OR, 1.08; 95% CI, 0.99–1.17; P = 0.075), and hemoglobin (Hb) level (OR, 0.67; 95% CI, 0.52–0.86; P = 0.001) and platelet count (Plt) (OR, 0.99; 95% CI, 0.99–1.00; P = 0.033) upon ICU discharge as significant factors. In conclusion, a significant proportion of in-hospital mortality is predictable and those who die in hospital after ICU discharge tend to be severely-ill, with comorbidities of hematologic disease and solid tumor, and anemic and thrombocytopenic upon ICU discharge.

Graphical Abstract

jkms-32-528-abf001

INTRODUCTION

In-hospital death following intensive care unit (ICU) stay is estimated to be 5%–27% in various reports (12345). Despite improvements in ICU care quality and widespread utilization of step-down units over the last decades, a significant number of patients still die in the hospital following successful ICU discharge.
The short-term prognosis after intensive care can be determined by factors both within and outside the ICU (67891011). Several studies have shown that illness severity and high nursing workload required at the time of ICU discharge are associated with poor outcomes (3). On the other hand, others have focused on factors in the wards after ICU care and emphasized the role of special “watchdog” teams to identify those patients at risk of death (12). While intensivists work rigorously to reduce deaths after ICU care, some deaths seem inevitable or sometimes unpredictable.
In this study, we first investigated the causes of in-hospital deaths following successful ICU discharge; we were also interested in assessing the proportion of unexpected deaths on the wards. Second, we analyzed the data to discover the predictors of in-hospital mortality.

MATERIALS AND METHODS

Study design and subjects

We performed a retrospective, single-center cohort study using medical intensive care unit (MICU) registry data. This included all MICU admissions to the Seoul National University Bundang Hospital (a tertiary care university-based teaching hospital with MICU size of 16 beds of 1,356 hospital beds) from January 2011 to August 2013. Of 723 identified admissions, 383 patients who were discharged alive from their first ICU admission with at least 24 hours of ICU length of stay (LOS) were included (Fig. 1). Patients aged less than 18 years, who died in the ICU upon the first ICU admission, and who were discharged to surgical ICUs and ICUs at other hospitals were excluded from the analysis, as well as those with terminal discharges to the wards for hospice care. For patients with multiple ICU admissions during the same hospital stay, only the result from the first MICU admission was considered.
Fig. 1
Flow diagram of the study.
MICU = medical intensive care unit, ICU = intensive care unit.
jkms-32-528-g001

Variables

Demographic data including age, gender, body mass index (BMI), and body weight just before admission and upon discharge from ICU was recorded. Comorbidities diagnosed only before admission were considered. Illness severity scores (Acute Physiologic and Chronic Health Evaluation II; APACHE-II) and Sequential Organ Failure Assessment (SOFA) scores were calculated at ICU admission. Vital signs and laboratory findings upon ICU admission and discharge were also recorded: white blood cells (WBCs), hemoglobin (Hb) levels, platelet counts (Plt), absolute neutrophil count, arterial blood gas analysis, albumin (Alb), total cholesterol levels, prothrombin time, total bilirubin (Tbil) levels, serum creatinine, blood urea nitrogen (BUN), lactic acid, and C-reactive protein (CRP).
In order to determine reasons for in-hospital deaths, a single physician reviewed the entire hospital records of all non-survivors (n = 45), including MICU discharge summaries, ward notes, nurse records, and death certificates. We also recorded whether the patient and the family had documented do-not-resuscitate (DNR) orders or decisions to withhold futile treatments before death. Considering the purpose of our study, patients with documented DNR status before ICU admission or during ICU stay were excluded from the analysis, as shown in Fig. 1. Accordingly, patients with documented DNR status admitted in wards after successful ICU discharge were included in the analysis.

Statistical analyses

The patients' clinical variables were analyzed using descriptive statistics expressed as means with ranges or as percentages. Values were compared between survivors and non-survivors after ICU discharge. Differences in continuous variables were compared with Mann-Whitney U tests for non-normal distributions and independent t tests for normal distributions. Dichotomous variables were assessed with Pearson χ2 tests and Fisher's exact tests where applicable.
Univariate logistic regression analysis was conducted to identify possible predictors of in-hospital mortality after ICU discharge. Any variable with P value < 0.050 from the univariate analysis was considered as candidates for inclusion in the multivariate logistic regression analysis. In the final model, we first included a specific variable, SOFA score upon ICU admission (SOFAadm), because it had the smallest value of Akaike's information criteria (AIC) and was clinically relevant as well. Afterwards, we included significant variables from the univariate analysis (P < 0.050) and selected those with incremental effects on SOFAadm (e.g., time from ER to ICU admission; presence of solid cancer, ACS, and hematologic disease; and blood levels of Hb, Tbil, and BUN upon ICU admission). Then, with backward selection (P < 0.100), we selected SOFAadm, Hb upon ICU admission, and the presence of solid cancer and hematologic disease. Considering its clinical significance, we also added the Plt level to the final model of multivariate logistic regression. The variables were previously tested for interaction and none of them showed significant interaction with others. Calibration of the model was evaluated with the Hosmer-Lemeshow goodness-of-fit test. Two tailed P values less than 0.05 were considered statistically significant. The statistical tests were performed using Statistical Package for the Social Sciences (SPSS) version 17.0 (SPSS corp., Chicago, IL, USA).

Ethics statement

The present study protocol was reviewed and approved by the Institutional Review Board of Seoul National University Bundang Hospital (IRB No. B-1408-262-114). We were given an exemption from informed consent of participants due to the characteristics of our study as a retrospective observational study.

RESULTS

Of 383 patients who survived MICU care, in-hospital deaths occurred in 45 patients (11.7%). As primary causes of ICU admission, the most frequent cause was respiratory failure followed by sepsis in both non-survivors and survivors (Table 1).
Table 1

Causes of initial ICU admission in survivors and non-survivors

jkms-32-528-i001
Causes of ICU admission, No. (%)* Total (n = 383) In-hospital death after ICU discharge (n = 45) Survivors (n = 338) P
Respiratory failure 233 (60.8) 30 (66.7) 203 (60.1) 0.394
 Pneumonia, including CAP, HAP, and VAP 123 (32.1) 19 (42.2) 104 (30.8) -
 Aspiration and airway problems 67 (17.5) 11 (24.4) 56 (16.6) -
 Pulmonary edema 23 (6.0) 4 (8.9) 19 (5.6) -
 Exacerbation in obstructive lung disease 11 (2.9) 0 (0.0) 11 (3.3) -
Sepsis 59 (15.4) 8 (17.8) 51 (15.1) 0.639
Cardiac 47 (12.3) 0 (0.0) 47 (13.9) 0.003
Severe metabolic acidosis requiring the use of CRRT 22 (5.7) 2 (4.4) 20 (5.9) > 0.999
GI bleeding 5 (1.3) 1 (2.2) 4 (1.2) 0.467
Others 16 (4.2) 4 (8.9) 13 (3.8) 0.105
ICU = intensive care unit, CAP = community-acquired pneumonia, HAP = hospital-acquired pneumonia, VAP = ventilator-associated pneumonia, CRRT = continuous renal replacement therapy, GI = gastrointestinal.
*If there were multiple primary causes for ICU admission, we permitted up to 3 causes for admission to the unit.
Indeed, the most common cause of mortality after ICU discharge was also respiratory failure (56%, 25/45) followed by sepsis (18%, 8/45), cancer progression (16%, 7/45), cardiopulmonary arrest of unknown cause (11%, 5/45), and cerebrovascular disease (11%, 5/45). The reasons for in-hospital death and ICU admission were the same in more than half of all deaths (64%, 29/45). Sudden unexpected deaths comprised about one-fifth of all deaths (18%, 8/45).
Table 2 shows demographic and clinical characteristics upon MICU admission. Non-survivors had higher prevalence of comorbidities such as chronic kidney disease, solid cancer, and hematologic disease and were more likely to be admitted from the wards. Hospital LOS before ICU admission was significantly longer in non-survivors. A similar result was shown for duration of emergency department (ED) stay until ICU admission. Severity scores including APACHE-II and SOFA were also higher in non-survivors. Duration of mechanical ventilation (MV) was longer in non-survivors than in survivors (Tables 2 and 3).
Table 2

Characteristics of patients upon ICU admission

jkms-32-528-i002
Variables In-hospital deaths after ICU discharge (n = 45) Survivors (n = 338) P
Age, yr 70 ± 15 68 ± 15 0.313
Male 31 (69) 221 (65) 0.739
Comorbidities
 Diabetes mellitus 15 (33) 123 (36) 0.688
 Hypertension 17 (38) 157 (46) 0.272
 Chronic lung disease 8 (18) 56 (17) 0.838
 Coronary artery disease 2 (4) 84 (25) 0.002
 Cerebrovascular accident 9 (20) 84 (25) 0.476
 Chronic kidney disease 9 (20) 32 (9.5) 0.041
 Solid cancer
  Active malignancy 17 (38) 50 (15) 0.001
  Stage IV cancer 13 (29) 36 (11) 0.001
  NED follow-up 4 (9) 16 (5) 0.274
 Hematologic disease 6 (13) 12 (4) 0.004
 Lymphoma 0 (0) 11 (3) 0.375
 Immunosuppressed 1 (2) 8 (24) > 0.999
ICU admission from wards 22 (49) 113 (33) 0.041
ICU admission from ED 23 (51) 219 (65) 0.309
ICU admission at night* 21 (47) 134 (40) 0.367
CPR at admission 4 (9) 41 (12) 0.630
Duration of ED stay before ICU admission, day 0.9 ± 0.7 0.7 ± 0.6 0.038
Hospital LOS before ICU admission, day 7 ± 13 5 ± 13 0.027
APACHE-II score upon ICU admission 27 ± 9 24 ± 9 0.008
SOFA upon ICU admission 10 ± 4 8 ± 4 0.008
Laboratory data upon admission
 Hb level, g/dL 10.1 ± 2.0 11.0 ± 2.3 0.019
 Serum cholesterol, mg/dL 111.0 ± 46.3 123.0 ± 45.5 0.088
 Serum Alb, g/dL 2.8 ± 0.5 3.1 ± 0.6 0.006
Values are presented as number of patients (%) or mean ± standard deviation.
ICU = intensive care unit, NED = no evidence of disease, ED = emergency department, CPR = cardiopulmonary resuscitation, LOS = length of stay, APACHE-II = Acute Physiology and Chronic Health Evaluation II, SOFA = Sequential Organ Failure Assessment, Hb = hemoglobin, Alb = albumin.
*Night-time admission is defined as admission to the unit during 19:01–06:59.
Table 3

Clinical features during ICU stay and at the time of ICU discharge

jkms-32-528-i003
Variables In-hospital deaths after ICU discharge (n = 45) Survivors (n = 338) P
Night-time discharge* 2 (4) 37 (11) 0.290
ICU LOS, day 9 ± 7 8 ± 9 0.158
Hospital LOS after ICU discharge, day 18 ± 16 21 ± 20 0.391
Support during ICU stay
 CRRT 9 (20) 54 (16) 0.494
 MV 35 (78) 267 (79) 0.851
 Duration of MV care, day 9 ± 7 7 ± 9 0.015
Percutaneous tracheostomy during ICU stay 4 (9) 60 (18) 0.134
Application of NIPPV upon ICU discharge 5 (11) 31 (9) 0.594
Vital signs, laboratory values, severity of illness at the time of ICU discharge
 SBP, mmHg 145 ± 22 147 ± 23 0.594
 DBP, mmHg 76 ± 17 78 ± 18 0.573
 HR, /min 110 ± 23 111 ± 22 0.833
 RR, /min 30 ± 8 30 ± 8 0.727
 BT, ℃ 37.3 ± 0.6 37.4 ± 0.6 0.066
 GCS 12 ± 4 12 ± 3 0.917
 pH 7.40 ± 0.04 7.40 ± 0.04 0.950
 pO2, mmHg 89 ± 30 95 ± 32 0.138
 PaO2/FiO2 ratio 373 ± 193 349 ± 138 0.928
 pCO2, mmHg 40 ± 9 41 ± 12 0.629
 HCO3, mM/L 26 ± 5 26 ± 4 0.917
 WBC, 103/µL 10.8 ± 7.5 11.5 ± 6.9 0.252
 Absolute neutrophil count, /µL 9,396 ± 6,965 9,344 ± 5,714 0.283
 Hb level, g/dL 9.6 ± 1.6 10.5 ± 1.7 < 0.001
 Plt, 103/µL 141 ± 109 206 ± 132 0.001
 Prothrombin time, INR 1.35 ± 0.45 1.29 ± 0.75 0.058
 Tbil, mg/dL 3.0 ± 4.7 1.2 ± 2.1 0.002
 Alb, g/dL 2.8 ± 0.5 3.0 ± 0.5 0.024
 Total cholesterol, mg/dL 114 ± 39 127 ± 43 0.075
 BUN, mg/dL 35 ± 24 27 ± 17 0.041
 Creatinine, mg/dL 1.4 ± 1.7 1.4 ± 1.6 0.529
 Lactate, mM/L 3.2 ± 2.9 2.9 ± 2.6 0.347
 High sensitivity CRP, mg/dL 6.8 ± 5.4 7.0 ± 6.0 0.772
 SOFA at ICU discharge 5 ± 3 5 ± 3 0.210
Discharge location
 Ward 34 (76) 231 (68) 0.325
 Step-down unit 11 (24) 107 (32) 0.325
ICU = Intensive care unit, LOS = length of stay, CRRT = continuous renal replacement therapy, MV = mechanical ventilation, NIPPV = nasal intermittent positive pressure ventilation, SBP = systolic blood pressure, DBP = diastolic blood pressure, HR = heart rate, RR = respiratory rate, BT = body temperature, GCS = Glasgow Coma Scale, WBC = white blood cell, Hb = hemoglobin, Plt = platelet counts, INR = international normalized ratio, Tbil = total bilirubin, Alb = albumin, BUN = blood urea nitrogen, CRP = C-reactive protein, SOFA = Sequential Organ Failure Assessment.
*A night-time discharge is defined as discharge from the unit during 19:01–06:59.
When comparing laboratory values, Hb, and Alb were initially higher in survivors at ICU admission (Table 2). Upon MICU discharge, non-survivors had decreased Hb, Plt, and Alb and elevated Tbil and BUN (Table 3).
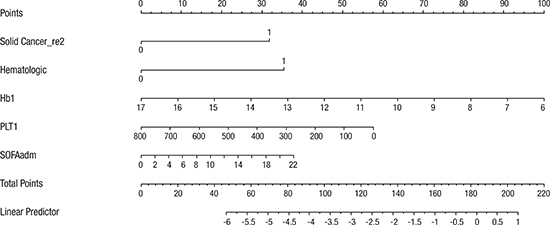
The results of univariate analysis are shown at the Supplementary Table 1. With the described methods, we selected the final model of multivariate logistic regression analysis (Table 4), which included SOFAadm, presence of solid tumor, hematologic disease, and Hb and Plt count upon ICU discharge. Based on the logistic regression model, we constructed a nomogram to predict post-ICU mortality (Supplementary Fig. 1). The calibration plot of model-development showed that the nomogram was well fitted (Hosmer-Lemeshow test: χ2 = 7.670, P = 0.470, area under the curve [AUC] = 0.785, Supplementary Fig. 2).
Table 4

Multivariate logistic regression model

jkms-32-528-i004
Variables Adjusted OR 95% CI P
SOFA upon ICU admission 1.08 0.99–1.17 0.075
Solid cancer 4.06 2.01–8.20 < 0.001
Hematologic disease 4.75 1.51–14.96 0.013
Hb upon ICU discharge 0.67 0.52–0.86 < 0.001
Plt upon ICU discharge 1.00 0.99–1.00 0.033
OR = odds ratio, CI = confidence interval, SOFA = Sequential Organ Failure Assessment, ICU = intensive care unit, Hb = hemoglobin, Plt = platelet counts.

DISCUSSION

In this retrospective review of 383 patients discharged from the MICU over 3 years, we found that the post-ICU mortality in our hospital remains an important problem. Compared with the mortality rate of 5% obtained in a recent multicenter study in Australia and New Zealand by Santamaria et al. (13) and the post-ICU mortality rate of 10% in the European Sepsis Group by Azoulay et al. (14), our result of an in-hospital mortality rate of 11.7% after ICU discharge was much worse (n = 45/383). This difference can mainly be attributed to the exclusion of patients in surgical ICUs, resulting in a relatively severe disease severity in our study; differences in ICU capacity and subtle management skills may also have contributed to this difference (15). The most common cause for in-hospital mortality after MICU discharge was respiratory failure followed by sepsis, which is consistent with other studies (16). Extended duration of MV was seen in non-survivors, which may provide one explanation for respiratory complications after intensive care (17).
Most patients had the same reason for post-ICU death and initial ICU admission, which implies that the main problem was not completely solved during their ICU stay. Several attempts have been made to explain this finding in previous studies (69). For example, premature discharge from the MICU due to high demands and shortage of ICU beds may have resulted in poor prognosis in those patients. While it can be attributed to problems in allocation of resources to some extent, we are yet unsure that deferring ICU discharge would result in better patient survival. In spite of utilization of multiple step-down units, a significant number of patients still die in the wards after successful ICU discharge. Unexpected death accounted for one-fifth of all deaths (n = 8) including unknown cardiopulmonary arrest (n = 5).
Independent predictors for hospital mortality after ICU discharge included low levels of Hb and Plt upon ICU discharge. While there still remains controversy regarding the optimal target level of Hb in ICU patients and about the role of transfusion (18), our result shows that there is a close relationship between Hb and prognosis after ICU discharge. Recent studies including a prospective cohort study in Korea also suggested the role of Plt counts in predicting mortality in critically ill patients (1920). In accordance with the literature, our result demonstrates that thrombocytopenia is associated with increased in-hospital mortality even after critical illness. Possible explanation includes that Plt reflects the degree of catecholamine surge, inflammatory response, sepsis, and disseminated intravascular coagulopathy (212223). If Hb and Plt count did not improve to an optimal level at the time of ICU discharge, it may indicate that the patient could not fully recover from the critical condition and may deteriorate after ICU discharge.
The authors acknowledge that this study has several limitations. First, it was conducted in an MICU of a single center university-based tertiary hospital, so the result may not be applicable to patients in surgical ICUs or in different hospital settings with different patient characteristics. For example, 28 out of 45 deaths (62%) in our study occurred in patients with solid cancer, hematologic malignancy, or immunocompromised status. This may suggest that a significant proportion of cancer patients with poor prognosis comprised our study population, whose high mortality seems to be expected. However, it may also reflect the current patient composition in tertiary centers in Korea, with a shift towards chronic, severe underlying medical disorders, especially malignancy. Second, all patients were from Asia and did not include other ethnic groups. Third, our study size was small with 45 deaths in the hospital after ICU discharge. However, previous studies have shown similar numbers of participants. Indeed, our results were robust in terms of the statistical analysis, and despite the size, we think that some important clinical implications can be drawn from our results. Fourth, we did not substantiate our results using a validation cohort, which can be sought in the future.
One of several strong points of this study is that in-hospital mortality was assessed for all patients admitted to the medical ICU. We did not sub-group patients with MV only as it was done in most of the other studies. Therefore, our result can be more applicable to a general population of medical patients in the medical ICU setting. Second, we do have survival data of all patients included in the study, which we obtained from the national death records. Nevertheless, the result drawn from a multiple regression model using the survival data was not different from the one shown here.
In conclusion, more than half of the patients died of the same reason that prompted their admission to the MICU; the causes of only one-fifth of in-hospital deaths after ICU discharge were unpredictable. Patients who die in the hospital after successful MICU discharge tend to have higher severity scores upon admission, with comorbidities of hematologic disease and solid tumor, and relatively anemic and thrombocytopenic statuses upon ICU discharge. Further studies are warranted in the future to reflect changes and updates in hospital environments and ultimately to reduce reversible portions of hospital mortality after ICU discharge.

ACKNOWLEDGMENT

We thank the Medical Research Collaborating Center (MRCC) of Seoul National University Bundang Hospital for their comments and guidance in statistical analysis.

Notes

DISCLOSURE The authors have no potential conflicts of interest to disclose.

Author Contributions

  • Conceptualization: Lee J, Cho YJ, Kim SJ, Yoon HI, Park JS, Lee CT, Lee JH, Lee YJ.

  • Data curation: Lee J, Cho YJ, Lee YJ.

  • Formal analysis: Lee J, Lee YJ.

  • Investigation: Cho YJ, Kim SJ, Yoon HI, Park JS, Lee CT, Lee JH.

  • Writing - original draft: Lee J, Lee YJ.

  • Writing - review & editing: Cho YJ, Kim SJ, Yoon HI, Park JS, Lee CT, Lee JH.

References

1. Goldhill DR, Sumner A. Outcome of intensive care patients in a group of British intensive care units. Crit Care Med. 1998; 26:1337–1345.
2. Rowan KM, Kerr JH, Major E, McPherson K, Short A, Vessey MP. Intensive Care Society’s APACHE II study in Britain and Ireland--II: outcome comparisons of intensive care units after adjustment for case mix by the American APACHE II method. BMJ. 1993; 307:977–981.
3. Smith L, Orts CM, O’Neil I, Batchelor AM, Gascoigne AD, Baudouin SV. TISS and mortality after discharge from intensive care. Intensive Care Med. 1999; 25:1061–1065.
4. Azoulay E, Adrie C, De Lassence A, Pochard F, Moreau D, Thiery G, Cheval C, Moine P, Garrouste-Orgeas M, Alberti C, et al. Determinants of postintensive care unit mortality: a prospective multicenter study. Crit Care Med. 2003; 31:428–432.
5. Ranzani OT, Prada LF, Zampieri FG, Battaini LC, Pinaffi JV, Setogute YC, Salluh JI, Povoa P, Forte DN, Azevedo LC, et al. Failure to reduce C-reactive protein levels more than 25% in the last 24 hours before intensive care unit discharge predicts higher in-hospital mortality: a cohort study. J Crit Care. 2012; 27:525.e9–525.15.
6. Daly K, Beale R, Chang RW. Reduction in mortality after inappropriate early discharge from intensive care unit: logistic regression triage model. BMJ. 2001; 322:1274–1276.
7. Sprung CL, Danis M, Iapichino G, Artigas A, Kesecioglu J, Moreno R, Lippert A, Curtis JR, Meale P, Cohen SL, et al. Triage of intensive care patients: identifying agreement and controversy. Intensive Care Med. 2013; 39:1916–1924.
8. Brown SE, Ratcliffe SJ, Halpern SD. Assessing the utility of ICU readmissions as a quality metric: an analysis of changes mediated by residency work-hour reforms. Chest. 2015; 147:626–636.
9. Wagner J, Gabler NB, Ratcliffe SJ, Brown SE, Strom BL, Halpern SD. Outcomes among patients discharged from busy intensive care units. Ann Intern Med. 2013; 159:447–455.
10. Moreno R, Agthé D. ICU discharge decision-making: are we able to decrease post-ICU mortality? Intensive Care Med. 1999; 25:1035–1036.
11. Casaer MP, Ziegler TR. Nutritional support in critical illness and recovery. Lancet Diabetes Endocrinol. 2015; 3:734–745.
12. Goldhill DR, Worthington L, Mulcahy A, Tarling M, Sumner A. The patient-at-risk team: identifying and managing seriously ill ward patients. Anaesthesia. 1999; 54:853–860.
13. Santamaria JD, Duke GJ, Pilcher DV, Cooper DJ, Moran J, Bellomo R; Discharge and Readmission Evaluation (DARE) Study. The timing of discharge from the intensive care unit and subsequent mortality. A prospective, multicenter study. Am J Respir Crit Care Med. 2015; 191:1033–1039.
14. Azoulay E, Alberti C, Legendre I, Buisson CB, Le Gall JR; European Sepsis Group. Post-ICU mortality in critically ill infected patients: an international study. Intensive Care Med. 2005; 31:56–63.
15. Martin-Loeches I, Wunderink RG, Nanchal R, Lefrant JY, Kapadia F, Sakr Y, Vincent JL. ICON Investigators. Determinants of time to death in hospital in critically ill patients around the world. Intensive Care Med. 2016; 42:1454–1460.
16. Bion J. Rationing intensive care. BMJ. 1995; 310:682–683.
17. Jeong BH, Ko MG, Nam J, Yoo H, Chung CR, Suh GY, Jeon K. Differences in clinical outcomes according to weaning classifications in medical intensive care units. PLoS One. 2015; 10:e0122810.
18. Parsons EC, Hough CL, Seymour CW, Cooke CR, Rubenfeld GD, Watkins TR; NHLBI ARDS Network. Red blood cell transfusion and outcomes in patients with acute lung injury, sepsis and shock. Crit Care. 2011; 15:R221.
19. Lim SY, Jeon EJ, Kim HJ, Jeon K, Um SW, Koh WJ, Chung MP, Kim H, Kwon OJ, Suh GY. The incidence, causes, and prognostic significance of new-onset thrombocytopenia in intensive care units: a prospective cohort study in a Korean hospital. J Korean Med Sci. 2012; 27:1418–1423.
20. Zhang Z, Xu X, Ni H, Deng H. Platelet indices are novel predictors of hospital mortality in intensive care unit patients. J Crit Care. 2014; 29:885.e1–885.e6.
21. van Zyl N, Reade MC, Fraser JF. Experimental animal models of traumatic coagulopathy: a systematic review. Shock. 2015; 44:16–24.
22. Johansson PI, Haase N, Perner A, Ostrowski SR. Association between sympathoadrenal activation, fibrinolysis, and endothelial damage in septic patients: a prospective study. J Crit Care. 2014; 29:327–333.
23. Levi M, Schultz M. Coagulopathy and platelet disorders in critically ill patients. Minerva Anestesiol. 2010; 76:851–859.

Supplementary Materials

Supplementary Table 1

Univariate analysis of risk factors

Supplementary Fig. 1

Nomogram predicting the probability of death on the wards after ICU discharge.

Supplementary Fig. 2

Calibration plot of model-development.
TOOLS
ORCID iDs

Jungsil Lee
https://orcid.org/http://orcid.org/0000-0001-5031-7557

Young-Jae Cho
https://orcid.org/http://orcid.org/0000-0001-6943-4462

Se Joong Kim
https://orcid.org/http://orcid.org/0000-0002-0222-998X

Ho Il Yoon
https://orcid.org/http://orcid.org/0000-0003-2896-4576

Jong Sun Park
https://orcid.org/http://orcid.org/0000-0003-3707-3636

Choon-Taek Lee
https://orcid.org/http://orcid.org/0000-0001-8030-3332

Jae Ho Lee
https://orcid.org/http://orcid.org/0000-0002-4766-1231

Yeon Joo Lee
https://orcid.org/http://orcid.org/0000-0001-7697-4272

Similar articles