

 PDF
PDF ePub
ePub Citation
 Print
Print


INTRODUCTION
Childhood is a critical period for the growth of many organ systems, and adequate organ growth is an important aspect of growth evaluation of children (1). Therefore, it is important to measure organ size accurately to estimate growth in children. The kidney is an organ that performs critical functions, and measuring its length by means of imaging modalities is easier than measuring the length of any other major organ. Moreover, its size serves as an indicator for evaluation of renal disease in children as well as for determination of adequate organ growth (2). Thus, a reference value for normal kidney size in children would be useful (3).
Renal size can be measured in terms of length, volume, cortical volume, or thickness. Renal length has been used widely to estimate renal size; it is difficult to measure renal volume by means of renal sonography. Renal length, as measured by sonography, correlates well with the individual's height, weight, age, and body surface area (BSA) (45). Prior reports have suggested the use of nomograms, obtained using sonography, for predicting renal length based on age, height, and weight (67).
However, considering the complexity of the shape of the kidneys, renal volume is a more sensitive index of kidney size for the detection of renal abnormalities and can represent kidney mass more appropriately than renal length does (89). Moreover, renal volume is an excellent predictor of renal function and correlates well with body indices (8).
Computed tomography (CT) can be used to measure renal size, including renal volume, more accurately than sonography. Moreover, results obtained with sonography vary widely, depending on the equipment and methods used for measuring and interpreting renal length (4). The ultrasonography equipment used can influence the measurements, along with potential inter- and intraobserver errors (41011). Nevertheless, few studies to date have reported renal size as measured by CT.
In Korea, somatic growth in children has improved in the last few decades (112); this necessitates a new reference value of normal kidney size to allow appropriate evaluation. The present study aimed to provide updated measurements for normal kidney size in Korean children (who do not have renal disease) using CT, and to evaluate the relationship between children's age, weight, height, and BSA, and the renal length and volume.
MATERIALS AND METHODS
Patient selection and data extraction
Abdominal and pelvic CT images of 639 patients < 18 years of age who visited Chung-Ang University Hospital from July 2005 to December 2013 were reviewed. Initially, 271 patients were excluded, for the following reasons: a total of 250 had inadequate anthropometric data; 8 were below 2 years of age; and 13 cases were duplicate examinations. An additional 96 cases were unsuitable for measuring renal size: subjects whose weight or height were below 5 percentiles, or above 95 percentiles for age, based on the 2007 Korean National Growth Charts, were excluded (12). The exclusion criteria included the presence of any congenital renal anomaly or renal disease that affected renal size measurement, such as a horseshoe kidney, hydronephrosis, urinary tract infection, renal injury, renal cysts, or a single kidney due to renal agenesis or nephrectomy. Patients with proteinuria, gross hematuria, or renal failure were also excluded, along with patients diagnosed with extra-renal diseases that can affect the urinary system and kidney mass, such as ureteral stones, splenomegaly, or abdominal or retroperitoneal masses around the kidney. Patients with chronic diseases that can impede the growth rate were excluded: 1 patient who had lymphoma and 1 patient who had chronic cardiac disease with severe mitral valve regurgitation. In total, 272 children were enrolled in the study.
Age, sex, height, and weight data were collected by reviewing the medical records of the patients. Height and weight were measured within 2 weeks of the day of CT examination. BSA was calculated using the following equation (13):
The characteristics of the enrolled patients are shown in Table 1. All patients underwent abdominal and pelvic CT using Omnihexol (Korea United Pharm. Inc., Seoul, Korea) as the contrast agent.
Table 1
Characteristics of all patients examined by CT

Data are expressed as mean ± SD with range.
CT = computed tomography, BSA = body surface area, SD = standard deviation.
*The left kidney was significantly longer and larger as per the results of paired t-test.
![]()
Measurement of renal size
The kidney size was measured manually using the distance between CT images, with the MARO-view system (Marosis, Seoul, Korea); each parameter was measured as the longest distance on each image. Only 2 pediatricians in the same Department of Pediatrics participated in this process. One reviewed the charts of the enrolled patients retrospectively, while the other measured distances on CT images. Renal length was measured as the pole-to-pole distance on the coronal plane of the CT image, and renal width was measured as the diameter from the renal hilum to the opposite side on the transverse plane. Renal depth, which refers to the anteroposterior diameter, was measured as the longest distance on an axis perpendicular to the renal width on the transverse plane. Renal volume was calculated in cubic centimeters, using the equation for an ellipsoid (914):
Statistical procedures
Statistical analyses were performed using SPSS 18 software (SPSS Inc., Chicago, IL, USA). Table 1 shows the mean value of renal size in the enrolled subjects (n = 272). In Tables 2 and 3, the patients were divided into 12 groups by age as follows: 2–3 years, 3–4 years, …, 12–13 years, and 13–17 years. In Table 4, the patients were classified into 10 groups by height as follows: 85–95 cm, 95–105 cm, …, 165–175 cm, and 175–185 cm. The mean value, with the 95% confidence interval (CI) and standard deviation (SD) of renal size in each age group and height group were obtained. Paired t-tests were used to compare the size of the left and right kidneys.
Table 2
Renal length of both kidneys according to age
![]()
Table 3
Renal volume of both kidneys according to age
![]()
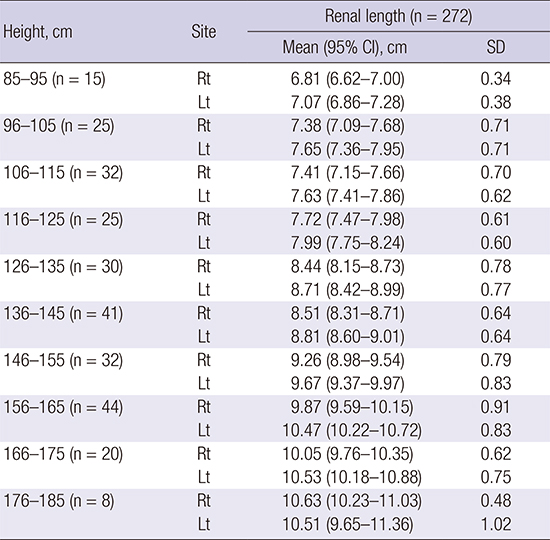
Table 4
Renal length of both kidneys according to height

![]()
Stepwise multiple linear regression analysis was applied to evaluate the relationship between multiple anthropometric indices and the renal size and to compare the significance of each of the variables. Stepwise multiple linear regression quantifies the relationship between a dependent variable and 1 or more independent variables, equipped with a variable selection scheme. In the first stage, the variable that has the highest partial correlation coefficient is added, after which regression analysis is initiated. In the next stage, another new variable is added in the same manner. At each stage in the process, after addition of a new variable, a test is performed to determine whether some variables can be deleted. If certain terms were found to be non-significant, they were removed from the model. Selection and elimination steps were repeated until no further improvement of the model was achieved by addition of new variables, and all the variables that had been included in the model were significant (1516).
The coefficient of determination (R2) and the standardized coefficients or beta coefficients (β) were calculated from the statistical analyses. The R2 indicates how well the data fit a statistical model (a line or a curve). In each step, R2 is increased after a new variable is added. Change in R2 is considered significant if the significance of change in F (ΔF) is less than 0.05. The standardized coefficients is the estimate from standardized regression analysis so that the variances of dependent and independent variables are 1; it is used to compare the influence of each variable. The variance inflation factor (VIF) is used to assess collinearity; if VIF is 10 or greater, collinearity is high.
In this study, we established the stepping criteria for entry or removal of factors based on the significance level of the F value, which was set at 0.05 or 0.10, respectively. The variables with a significance level > 0.10 were excluded from the model. The best equation was selected on the basis of the highest R2. The equation has the following form:
where Y is the dependent variable (i.e., the renal length or volume), X1, X2, …, Xn are the independent variables (i.e., age, weight, height, BSA), and b0 is the constant where the regression line intercepts the Y axis when all the independent variables are 0. The equation can be used to investigate which variables influence the dependent variable, and to estimate the dependent variable (i.e., the renal length or volume) when other variables are known. Linear regression analysis was also used to draw a scatter plot to estimate renal length and volume from anthropometric parameters. Results were considered statistically significant if the P value was < 0.05 for all data analyses.
RESULTS
Patient characteristics
A total of 272 Korean children (137 boys and 135 girls) were assessed. Ages ranged from 2.1 to 17.9 years, with a mean age of 9.51 ± 4.26 years. The average height of the enrolled group was 134.68 ± 24.35 cm (range: 85.0–185.0), and the average weight was 34.90 ± 17.32 kg (range: 11.4–90.0). The mean renal length of both kidneys was 8.76 ± 1.33 cm. The mean renal volume of both kidneys was 97.94 ± 40.65 cm3. Paired t-tests indicated that the length of the left kidney was significantly greater than that of the right kidney (8.93 ± 1.36 cm vs. 8.59 ± 1.28 cm; P < 0.001). In another paired t-test, the left renal volume was also significantly greater than the right renal volume (102.89 ± 42.70 cm3 vs. 92.99 ± 37.94 cm3; P < 0.001; Table 1). There was no difference in renal size according to sex (Tables 2 and 3).
The most common indication for CT evaluation of the enrolled subjects (n = 272) was gastrointestinal disease (n = 231), including acute appendicitis, acute abdominal pain, or intussusception. Infectious diseases were the second most common indication (n = 20), including fever of unknown cause, infectious mononucleosis, or pelvic inflammatory disease. Hepatobiliary diseases, contusion, genitourinary anomalies, and other diseases were additional indications.
Mean renal length according to height
Table 4 shows the mean renal length of both the kidneys in children according to the 10 height groups (95% CI). Renal length showed the tendency to increase with height.
Renal size estimated by univariate linear regression analysis
Simple univariate equations were derived for estimating kidney length and volume according to age, as shown below. The renal length was found to increase by about 0.25–0.26 cm per year, while the renal volume increased by about 7.52–8.45 cm3 per year.
Renal length (cm):
Renal volume (cm3):
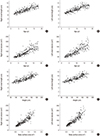
The results of the univariate regression analyses of the relationship between each parameter and renal size are noted in Table 5. All parameters showed a significant positive correlation with renal length and volume (P < 0.001). Fig. 1 shows the correlations of all parameters as a scatter plot, and the line of best fit for the relationship. The height and age of the patients showed the strongest correlation with the lengths of both right (R2 = 0.68; P < 0.001) and left (R2 = 0.69; P < 0.001) kidneys. Furthermore, the volume of both right (R2 = 0.78; P < 0.001) and left (R2 = 0.78; P < 0.001) kidneys showed the strongest correlation with BSA.
Table 5
The relationship between renal size and each independent variable on univariate regression
All R2 and β were considered statistically significant at P < 0.001.
BSA = body surface area, β = the standardized coefficients or beta coefficients, R2 = the coefficient of determination.
![]()
Renal size estimated by multivariate analysis
Table 6 shows the relationship between dependent variables (i.e., renal length, renal volume) and each independent variable (i.e., age, weight, height, and BSA) in stepwise multiple linear regression analysis. The equation, R2, β, ΔF, VIF, and F value, as well as P value was obtained.
Table 6
The relationship between renal size and each independent variable with stepwise multiple linear regression
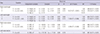
β = the standardized coefficients or beta coefficients, R2 = the coefficient of determination, ΔF = F change, VIF = variance inflation factor.
![]()
Right renal length had a significantly strong correlation with height (β = 0.83; P < 0.001). When age was added in step 2, significant increase was observed in R2 (ΔF = 15.57; P < 0.001). However, VIF was so large (VIF = 10.23) that it was considered inappropriate to implement the equation of step 2 (Table 6). Height was also the only significant of the 3 variables (weight, height, and BSA) in a stepwise multiple regression analysis without age, which had a large VIF.
Stepwise multiple regression analysis of left renal length was performed without age and BSA, of which the VIF were as high as 10.23 and 13.51, respectively (Table 6). Left renal length had a significant correlation with height and weight (R2 = 0.70; P < 0.001). The change in F was also significant (P < 0.001). The influence of height on left renal length was larger than that of weight (β = 0.66 vs. β = 0.19).
The stepwise regression for right renal volume was performed without the values for weight (VIF = 19.13), as shown in Table 6. Right renal volume had a significant correlation with BSA and age (R2 = 0.79; P < 0.001). The change in F was also significant (P = 0.039). Their VIF was less than 10 (VIF = 7.66). BSA correlated more strongly with right renal volume than did age (β = 0.73 vs. β = 0.16).
The stepwise regression for left renal volume was finished in the first step (Table 6); all the significance levels of independent variables, except those of BSA, were above 0.05. BSA showed a strong relationship with left renal volume (R2 = 0.78; P < 0.001).
DISCUSSION
Renal size is an indicator used for evaluation of adequate growth in children. Further, many renal disorders in children can also lead to changes in renal growth (17). For instance, a short renal length typically allows differentiation of chronic renal failure from acute renal failure that shows normal or increased values (10). Nephromegaly is an early marker of incipient nephropathy in patients having Type I diabetes mellitus with concurrent microalbuminuria (18). For these reasons, the accurate measurement of renal size is important in the clinical setting, and many nomograms have been developed for assessing renal size by sonography (719).
Although renal size correlates best with BSA (7), previous studies that used renal sonography have mostly performed correlation tests with height or weight; this is because BSA calculation is not convenient to perform and requires measurements of both height and weight. Similarly, renal length is mainly used to estimate renal size; renal length can be directly measured with renal sonography, while calculation of renal volume requires multiple measurements (20). Therefore, previous reports have demonstrated associations between age, height, and renal length.
In comparison to renal sonography, CT allows easier and more accurate measurement of renal volume. Furthermore, CT has higher reproducibility and fewer observer- or equipment-dependent errors than sonography (48). Thus, despite the risk of radiation exposure, CT is a useful imaging modality that can measure renal size accurately. Therefore, in the present study, CT rather than other modalities, such as sonography, was used to measure renal volume.
Another important difference from previous studies is that BSA was calculated as an anthropometric index, in addition to height or body weight, in the present study. Thus, analysis was performed to evaluate the association between these indices and renal size, including length and volume as measured by CT. The present study is 1 of the few studies that have evaluated the relationship between anthropometric indices and renal sizes as measured by CT in Korean children without renal disease.
It is already known that the growth rate for renal length are highest during the first 1–2 years of life, then slows during 2–5 years of age, and stabilizes in a linear fashion thereafter (24). Owing to this difference in the renal growth rate in infants and the small number of infants who underwent CT during the study period, patients below 2 years of age were excluded from the study. Prior studies have demonstrated that renal sizes in children aged more than 13 years show little differences over subsequent years (2122). For this reason, the children aged 13–17 years old were grouped together similar to a previous study conducted by Kim et al. (5) in Korea.
The present data confirmed that age correlates well with renal length and volume in children, similar to data of previous reports (47). Furthermore, as in prior studies, the findings of our study revealed that at 13 years of age, the renal size in children is approximately 90% of that of adults (2122) (Tables 2 and 3, Fig. 1). Meanwhile, Table 4 shows renal length according to height. This table can be clinically useful to the children who are small for age due to chronic disease. This will be helpful for establishing a nomogram for renal size according to age and height.
The present findings demonstrated discrepancies in sizes between the left and the right kidneys in children; the left renal length was, on average, 4% longer and the left renal volume was 11% larger than the values on the right side. These differences were statistically significant, which is consistent with the results of previous studies (523). This may result from a mass effect, where the liver prevented vertical growth of the right kidney in comparison with left kidney (24).
In the present study, all the variables, i.e., height, weight, age, and BSA correlated significantly with renal length and volume on univariate regression analysis, as in prior studies (3425). Of these variables, height and age had the largest R2 on univariate regression analysis for renal length. BSA had the strongest relationship with renal volume on univariate regression analysis.
We performed a simultaneous multiple linear regression in order to identify which variable has the strongest influence on renal size. Age was the only significant independent variable that correlated with renal length. Height and BSA correlated significantly with renal volume on this simultaneous analysis, while age and weight did not. However, in these 2 simultaneous analyses, VIF ranged from 149 to 685, except for that of age. The VIF of age was also high (11.08). Therefore, these analyses, in which all VIF values were above 10, were inappropriate.
Stepwise multiple linear regression was performed to avoid the effects of collinearity among variables. In this analysis, height correlates best with the renal length among various body indices, as reported previously (4725). BSA correlated best with renal volume, as reported in previous studies (726). Weight showed some significant correlation with left renal length on stepwise regression. Age revealed a slightly significant correlation with right renal volume. However, when using weight or age, data should be carefully interpreted, as the collinearity of these factors resulted in a moderately high range of VIF, i.e., 4.3–7.7.
The present findings indicate that when assessing renal length, height-related nomograms can be used. On the other hand, R2 of all independent variables tends to increase when the renal volume, rather than length, is used to measure renal size (Table 5). Additionally, BSA was the most significant factor, among the various body indices, for estimating renal volume. Therefore, when measuring and estimating renal size, it is more accurate to use renal volume and BSA than renal length and other body indices. This is similar to previous findings that showed BSA to be a good indicator of renal size (72627).
This study has certain limitations. First, the data were obtained from patients with non-renal diseases rather than from completely healthy children. Moreover, this study was performed at a single medical center; the number of patients in each age group was not equal, the CT examinations were performed over a long period (2005 to 2013), and the total number of patients was small. This sample cannot be perfectly representative of all healthy children. In order to overcome this problem, this study excluded unsuitable cases, which included patients with congenital renal anomalies or renal diseases and those with chronic diseases or abnormal findings on laboratory tests. A large-scale and multi-center study should be considered to validate the study's findings.
Second, there is a risk that renal length measured on the coronal plane can be underestimated because the kidney axis is oblique rather than parallel to the coronal plane. Compared to the study reported in 2016 by Oh et al. (25) in Korea, the renal length in the 7-year-old age group to the 11-year-old age group was, on average, shorter by 0.1 cm in this study. In the 6-year-old age group, the difference was approximately 0.7 cm. The subjects in the study reported by Oh et al. (25) were enrolled from 2012 to 2014, while our study analyzed subjects enrolled from 2005 to 2013. Therefore, the renal length of the subjects in our study may be shorter than that of the subjects reported by Oh et al. (25), because somatic growth in Korean children has improved in the last few decades (12). The difference was not marked, except for that observed for the 6-year-old age group. In fact, the renal length measured in our study was also 0.2–0.5 cm longer than that in the study reported by Kim et al. (5) in 2010 in Korea. Moreover, the renal length in our study was similar to those reported by Loftus et al. (22) in 1997 in Hong Kong. We believe that the difference in the renal length between CT and sonography is minimal, and thus, CT is useful for measuring renal length. CT also has less statistical errors, as it is highly reproducible.
Third, CT carries a risk of radiation exposure and requires sedation for performance of the procedure. However, low-dose CT has recently been used according to the “as low as reasonably achievable” (ALARA) principle (28). This technique is as useful as conventional CT and poses lower radiation hazards. Renal size, particularly renal volume, can be measured more accurately by using CT rather than sonography, as it largely excludes inter- and intra-observer errors. Therefore, CT may be clinically useful when renal size needs to be assessed accurately.
In conclusion, this is the first study in Korea to report the renal size measured by CT according to various body indices in children. Height and BSA are important when assessing renal length and volume in children. This study is expected to help in establishing updated normative standards for renal size in Korean children. Further studies including all age groups of normal, healthy children are needed; advanced techniques such as magnetic resonance imaging and CT, to perform measurements of both renal volume and length, should be used in subsequent studies.
 XML Download