

 PDF
PDF ePub
ePub Citation
 Print
Print


INTRODUCTION
Chronic obstructive pulmonary disease (COPD) is a lung disease characterized by irreversible lung destruction which leads to incompletely reversible airflow limitation (1) asthma is a chronic inflammatory disorder of the airways associated with recurrent episodes of reversible airflow limitation (2). Most patients with chronic airway disease have features of both asthma and COPD, which is referred to as asthma-COPD overlap syndrome (ACOS) (3). A screening questionnaire revealed that in the 20–44, 45–64, and 65–84 years age groups, the prevalence of ACOS was 1.6%, 2.1%, and 4.5%, respectively (4). Considering the high prevalence of asthma in ACOS patients, it is recommended that patients with ACOS should receive an additional drug therapy, namely inhaled corticosteroids (ICS) which could effectively prevent the acute attack of bronchial asthma (5). Nevertheless, because long-term use of ICS is associated with a higher risk of side effects, a stepwise approach to the escalation of medication is recommended for the management of asthma until control is reached, while a step-down approach should be employed when control is achieved (6). To find a balance between treatment and control, fractional exhaled nitric oxide (FeNO), as a noninvasive biomarker of airway inflammation in asthma, might allow the optimization of ICS treatment.
In a variety of respiratory epithelial cells, inflammatory cells and vascular endothelial cells, FeNO is synthesized in the catalysis of nitric oxide synthase (NOS); it is used as a known marker of the total number of inflammatory cells in the airways, eosinophilic airway inflammation and airway hyperresponsiveness (78). A high level of FeNO is correlated with eosinophilic inflammation (6). FeNO is therefore used clinically for detecting eosinophilic airway inflammation, monitoring airway inflammation in asthma, and evaluating corticosteroid responsiveness and an auxiliary diagnosis of asthma; this provides evidence for the optimization of ICS treatment and reduces ICS-related costs and complications (910). Although some studies suggest that the FeNO level could guide ICS management in patients with chronic cough (11) and asthma (12), few studies have reported on the use of the FeNO level for monitoring ACOS patients undergoing ICS treatment. In our study, we explored the relationship between the FeNO level and the efficacy of ICS in ACOS patients with different disease severity, to provide a theoretical basis for the optimization of ICS treatment in ACOS patients.
MATERIALS AND METHODS
Subjects
From October 2014 to November 2015, a total of 127 ACOS patients (83 males and 44 females) with ACOS (case group) were enrolled in this study. Based on the severity of COPD (13), the ACOS patients were divided into 4 groups: mild ACOS group (n = 25); moderate ACOS group (n = 36); severe ACOS group (n = 41); and extremely severe ACOS group (n = 25). The diagnostic criteria of ACOS followed the 2014 Global Initiative of Asthma (GINA) guidelines (14). The inclusion criteria (15) were as follows: 1) COPD patients had a history of asthma with persistent airflow limitation that was not fully reversible; 2) Patients were withdrawn from anticholinergic drugs or β2-adrenoceptor agonists for at least 1 week, from leukotriene receptor antagonists for at least 2 weeks or from systemic hormone therapy for at least 1 month prior to inclusion; and 3) Patients who were receiving ICS treatment had poorly controlled asthma. The following individuals were excluded: pregnant or lactating women; individuals potentially allergic to inhaled budesonide dry powder; patients with moderate to severe renal insufficiency, bladder neck obstruction, prostatic hyperplasia or narrow-angle glaucoma; and individuals who did not provide written informed consents. Meanwhile, 131 healthy people (73 males and 58 females) who had undergone physical examination in Taizhou Hospital of Zhejiang Province, Wenzhou Medical University were randomly selected as the control group. All healthy subjects in the control group had no history of coronary heart disease, lung disease, diabetes mellitus, connective tissue disease, or malignancy.
Therapeutic regimens
In the case group (mild ACOS group, moderate ACOS group, severe ACOS group, and extremely severe ACOS group), ACOS patients were treated with 2 mg of budesonide inhalation suspension (AstraZeneca AB, Mölndal, Sweden), 3 times per day. Healthy individuals in the control group did not receive any treatment. FeNO levels, pulmonary function parameters, including percentage of forced expiratory volume in 1 second (FEV1) to predicted value (FEV1%pred), ratio of FEV1 to forced vital capacity (FEV1/FVC), inspiratory capacity to total lung capacity (IC/TLC), and residual volume to total lung capacity (RV/TLC), arterial blood gas parameters, including PH, arterial partial pressure of oxygen (PaO2) and arterial partial pressure of carbon dioxide (PaCO2), blood and sputum biomarkers levels, Asthma Control Test (ACT) scores, and COPD Assessment Test (CAT) scores were compared before and after 6 months of ICS treatment.
Measurement of FeNO levels
The FeNO levels were measured using a nitric oxide analyzer (NIXO; Aerocrine AB, Solna, Sweden) in accordance with the manufacturer's instructions. The testing standards for FeNO followed the guidelines recommended by the American Thoracic Society (ATS) and the European Respiratory Society (ERS) (16), including: 1) unit: ppb; 2) flow velocity: 50 mL/s; 3) procedures: at a resting state, subjects expelled as much air as possible out of the lungs, and then with filters in their mouths they drew as much air as possible into the lungs for 5 seconds before slowly exhaling at a constant speed. The values were recorded after 10 seconds and 90 seconds. Before measurement, the subjects were not allowed to do any strenuous exercise for at least 1 hour or actively or passively smoke cigarettes, consume vegetables, drinks, or nitrogenous food. Furthermore, the included subjects did not have a history of acute respiratory infections over the past 2 weeks. The FeNO levels of the case group and the control group were measured before and after treatment.
Pulmonary function test
Pulmonary function was assessed using a MasterScreen spirometer (JEGER, Wuerzburg, Germany), following the manufacturer's instructions. To measure pulmonary ventilation function, each subject was tested at least 3 times with deviations of less than 5%. Using the selected optimal value, the FEV1%pred and FEV1/FVC were calculated and recorded. The lung volume was measured using a closed circuit helium dilution method by inflating the respiratory system with a mixture of carbon monoxide (0.3%), helium (10.0%), and air. The subjects inhaled quickly from RV to TLC and then held their breath for 10 seconds before exhaling completely. Based on the values of RV, IC, and TLC, the percentages of RV to TLC (RV/TLC%) as well as IC to TLC (IC/TLC%) were calculated. In the case group and the control group, a series of pulmonary function parameters were measured before and after treatment, including FEV1%pred, FEV1/FVC, RV/TLC%, and IC/TLC%.
Measurement of arterial blood gas values
The arterial blood gas test was performed using a blood gas analyzer (GEM Premier 3000; Instrumentation Laboratory, Bedford, MA, USA). Using the radial artery, 2–3 mL of arterial blood were taken from each subject to measure pH value, PaO2, and PaCO2. Blood samples were collected from subjects who had stopped oxygen therapy for at least 30 minutes prior to collection. In both groups, the arterial blood gas test was performed before and after treatment.
Detection of blood and sputum biomarkers
Collection of blood samples: A total of 2 mL of venous blood was collected from each subject; in an ethylene diamine tetraacetic acid (EDTA) anticoagulant tube and then centrifuged at 4,500 rpm for 15–20 minutes. After serum and plasma were collected separately, the levels of total serum immunoglobulin E (IgE), plasma surfactant protein A (SP-A), and plasma soluble receptor for advanced glycation end products (sRAGE) were determined by a Bio-Rad Model 680 microplate reader (Bio-Rad Laboratories, Inc., Hercules, CA, USA) using enzyme linked immunosorbent assay (ELISA) kits (R & D Systems, Inc., Minneapolis, MN, USA).
Collection of sputum samples: Sputum induction was achieved by having the patients inhale hypertonic saline solution via YZB/GEM 1058-2009 Nebulizer (PARI GmbH, Starnberg, Germany) treated with salbutamol (Sigma-Aldrich Co. LLC., St. Louis, MO, USA) aerosol. The induced sputum eosinophil count (EOS%) was determined by hematoxylin-eosin (H & E) staining, and the sputum myeloperoxidase (MPO) and neutrophil gelatinase-associated lipocalin (NGAL) levels were measured by a Bio-Rad Model 680 microplate reader (Bio-Rad Laboratories, Inc.) using ELISA kits (R & D Systems, Inc.).
In the case and control groups, total serum IgE levels, plasma SP-A levels, plasma sRAGE levels, induced sputum EOS%, sputum MPO levels, and sputum NGAL levels were measured before and after treatment.
ACT and CAT scores
The ACT included 5 questions: 1) impacts of asthma on daily living; 2) frequency of dyspnea; 3) influences of asthma on sleep; 4) frequency of emergency medicine usage; and 5) assessment of asthma control. Experienced doctors were trained to explain test requirements and completion methods to the subjects in detail and patients were asked to assign a corresponding score to each question (5 points for each question, a total of 25 points) based on individual circumstances, then rated and classified as: 1) “not controlled”: < 20 points; 2) “somewhat controlled”: 0–24 points; or 3) “completely controlled”: 25 points (17). In the control and case groups, the ACT was completed before and after the 6-month treatment.
The CAT was composed of 8 questions, including 6 subjective indicators (cough, expectoration, chest tightness, sleep, vigor, and emotion) and 2 tolerance evaluation indicators (exercise tolerance and influences on daily exercise). Experienced doctors were trained to explain test requirements and completion methods to the subjects in detail and patients were asked to assign a corresponding score to each question (5 points for each question, a total of 40 points) based on individual circumstances, then rated and categorized as: 1) “slight impact”: 1–10 points; 2) “moderate impact”: 11–20 points; 3) “severe impact”: 21–30 points; or 4) “extremely severe impact”: 31–40 points (18). In the control and case groups, the CAT was completed before and after the 6-month treatment.
Statistical analysis
SPSS 19.0 software was used for statistical analysis; measurement data were expressed by mean ± standard deviation (‾x ± SD). The one-way analysis of variance (one-way ANOVA) was used for comparisons among multiple groups, while the t-test was applied for comparisons between 2 groups. Spearman rank correlation was used to analyze the relationship between FeNO levels and different disease severity in ACOS. Pearson correlation analysis was applied to analyze the association of FeNO levels with various parameters. P < 0.05 was considered statistically significant.
RESULTS
Comparisons of baseline characteristics of ACOS patients with different disease severity
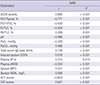
Baseline characteristics including gender, age, height, weight, and smoking history were collected and compared among 3 groups. There were no significant differences in gender, age, height, weight, and smoking history among the mild ACOS, moderate ACOS, severe ACOS, extremely severe ACOS, and control groups (all P > 0.05). Therefore, the 5 groups were comparable (Table 1).
Table 1
Comparisons of baseline characteristics in ACOS patients with different disease severity and healthy controls before and after treatment

![]()
Comparisons of FeNO levels in ACOS patients with different disease severity before and after ICS treatment
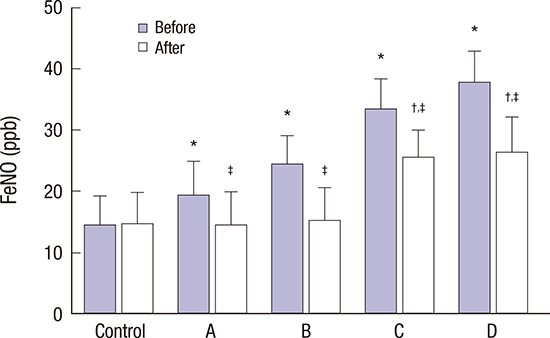
Compared with the control group, 4 subgroups in the case group had higher FeNO levels (all P < 0.05) before ICS treatment. After 6 months of ICS treatment, the FeNO levels in the mild ACOS group and moderate ACOS group were not significantly different from the controls (P > 0.05), while the levels in the severe ACOS group and extremely severe ACOS group were markedly increased compared to the control group (both P < 0.05). In ACOS patients who had received ICS treatment for 6 months, although there was no significant difference in the FeNO levels between the mild and moderate ACOS groups or between the severe and extremely severe ACOS groups (all P > 0.05), the FeNO levels were much lower in the mild and moderate ACOS groups than in the severe and extremely severe ACOS groups (all P < 0.05). Compared to pre-treatment levels, the FeNO levels decreased substantially in all 4 subgroups of the case group (all P < 0.05) (Fig. 1).
 | Fig. 1Comparisons of FeNO levels in ACOS patients with different disease severity and the control group before and after treatment.
A = mild ACOS group, B = moderate ACOS group, C = severe ACOS group, D = extremely severe ACOS group, FeNO = fractional exhaled nitric oxide, Before = before the 6-month treatment, After = after the 6-month treatment, ACOS = asthma-chronic obstructive pulmonary disease overlap syndrome.
*P < 0.05, compared with the control group before treatment; †P < 0.05, compared with the control group after treatment; ‡P < 0.05 when compared with the mild ACOS, moderate ACOS, severe ACOS, extremely severe ACOS, and control groups.
|
Comparisons of pulmonary function parameters in ACOS patients with different disease severity before and after treatment
In 4 subgroups of the case group, the FEV1%pred, FEV1/FVC, and IC/TLC% were initially lower than in the control group, while RV/TLC% was significantly higher than in the control group (all P < 0.05). Compared with the control group, in the mild and moderate ACOS groups, FEV1%pred, FEV1/FVC, and IC/TLC% were decreased, while the RV/TLC% was increased in the severe and extremely severe ACOS groups after 6 months of ICS treatment (all P < 0.05). Compared with pre-treatment values, all pulmonary function parameters in the case group improved after ICS treatment (all P < 0.05) (Fig. 2).
 | Fig. 2Comparisons of pulmonary function in ACOS patients with different disease severity and control group before and after treatment.
ACOS = asthma-chronic obstructive pulmonary disease overlap syndrome, A = mild ACOS group, B = moderate ACOS group, C = severe ACOS group, D = extremely severe ACOS group, FEV1%pred = percentage of forced expiratory volume in 1 second (FEV1) to predicted value, FEV1/FVC = the ratio of FEV1 to forced vital capacity, IC/TLC = ratio of inspiratory capacity to total lung capacity, RV/TLC = ratio of residual volume to total lung capacity, Before = before the 6-month treatment, After = after the 6-month treatment.
*P < 0.05, compared with the control group before treatment; †P < 0.05, compared with the control group after treatment; ‡P < 0.05 when compared with the mild ACOS, moderate ACOS, severe ACOS, extremely severe ACOS, and control groups before treatment.
|
Comparisons of arterial blood gas parameters in ACOS patients with different disease severity before and after treatment
Before ICS treatment, 4 subgroups in the case group had significantly lower pH values and PaO2 levels but higher PaCO2 levels than the control group (all P < 0.05). After 6 months of ICS treatment, pH values and PaO2 levels were increased while PaCO2 levels decreased in the mild and moderate ACOS groups more than in the severe and extremely severe ACOS groups (all P < 0.05). Compared with pre-treatment values, all arterial blood gas analysis parameters in the case group improved after ICS treatment, including pH values, PaO2 levels, and PaCO2 levels (all P < 0.05) (Table 2).
Table 2
Comparisons of pH, PaO2, and PaCO2 in ACOS patients with different disease severity and healthy controls before and after treatment

ACOS = asthma-chronic obstructive pulmonary disease overlap syndrome, PaO2 = arterial oxygen partial pressure, PaCO2 = partial pressure of carbon dioxide in artery.
*P < 0.05, compared with the control group before treatment; †P < 0.05, compared with the control group after treatment.
![]()
Comparisons of total serum IgE levels and induced sputum EOS% in ACOS patients with different disease severity before and after treatment
Before ICS treatment, total serum IgE levels and induced sputum EOS% were much higher in the case group than in the control group (all P < 0.05). Compared with the control group and the mild and moderate ACOS groups, the levels of total serum IgE and EOS% in induced sputum were substantially higher in the severe and extremely severe ACOS groups after the 6-month treatment (all P < 0.05). After ICS treatment, in 4 subgroups of the case group, both total serum IgE levels and induced sputum EOS% were significant reduced in comparison to before ICS treatment (all P < 0.05) (Table 3).
Table 3
Comparisons of total serum IgE levels and induced sputum EOS in ACOS patients with different disease severity and healthy controls before and after treatment

IgE = immunoglobulin E, ACOS = asthma-chronic obstructive pulmonary disease overlap syndrome, EOS = induced sputum eosinophil counts.
*P < 0.05, compared with the control group before treatment; †P < 0.05, compared with the control group after treatment.
![]()
Comparisons of plasma SP-A, plasma sRAGE, sputum MPO, and sputum NGAL in ACOS patients with different disease severity before and after treatment
Initially, 4 subgroups in the case group showed significant differences in the levels of plasma SP-A, plasma sRAGE, sputum MPO, and sputum NGAL compared with the control group (all P < 0.05). After 6 months of treatment, the severe and extremely severe ACOS groups had higher levels of plasma SP-A, sputum MPO, and sputum NGAL but lower levels of plasma sRAGE than the control group or the mild and moderate ACOS groups (all P < 0.05). In 4 subgroups of the case group, the levels of plasma SP-A, sputum MPO, and sputum NGAL decreased significantly and the levels of plasma sRAGE increased substantially after ICS treatment compared with pre-treatment values (Fig. 3).
 | Fig. 3Comparisons of the levels of plasma SP-A, plasma sRAGE, sputum MPO, and sputum NGAL in ACOS patients with different disease severity and control group before and after treatment.
ACOS = asthma-chronic obstructive pulmonary disease overlap syndrome, A = mild ACOS group, B = moderate ACOS group, C = severe ACOS group, D = extremely severe ACOS group, MPO = sputum myeloperoxidase, NGAL = sputum neutrophil gelatinase-associated lipocalin; sRAGE = plasma soluble receptor for advanced glycation end products, SP-A = plasma surfactant protein A, Before = before the 6-month treatment, After = after the 6-month treatment.
*P < 0.05, compared with the control group before treatment; †P < 0.05, compared with the control group after treatment; ‡P < 0.05, compared with the mild ACOS, moderate ACOS, severe ACOS, extremely severe ACOS, and control groups.
|
Comparisons of ACT scores and CAT scores in ACOS patients with different disease severity before and after treatment
Compared with the control group, 4 subgroups in the case group had substantially lower ACT scores and markedly higher CAT scores before ICS treatment (all P < 0.05). In ACOS patients who received ICS treatment for 6 months, there was no significant difference in ACT scores or CAT scores between the mild and moderate ACOS groups or between the severe and extremely severe ACOS groups (all P > 0.05). ACT scores decreased while CAT scores increased in the severe and extremely severe ACOS groups compared to the mild and moderate ACOS groups (all P < 0.05). In 4 subgroups of the case group, ACT scores increased significantly and CAT scores decreased markedly after ICS treatment compared to pre-treatment scores (Table 4).
Table 4
Comparisons of ACT scores and CAT scores in ACOS patients with different disease severity and healthy controls before and after treatment

ACOS = asthma-chronic obstructive pulmonary disease overlap syndrome, COPD = chronic obstructive pulmonary disease, ACT = Asthma Control Test, CAT = COPD Assessment Test.
*P < 0.05, compared with the control group before treatment; †P < 0.05, compared with the control group after treatment.
![]()
Correlation analyses of various parameters and FeNO levels
Spearman correlation analysis was performed between FeNO levels and ACOS severity and Pearson correlation analysis was used to determine the relationship of FeNO levels with pulmonary function parameters, arterial blood gas parameters, blood, and induced sputum biomarkers, ACT scores as well as CAT scores in patients who had received ICS treatment for 6 months. FeNO levels were positively correlated with ACOS severity, RV/TLC, PaCO2, total serum IgE, induced sputum EOS, plasma SP-A, sputum MPO, sputum NGAL, and CAT scores. The FeNO levels were negatively correlated with FEV1%pred, FEV1/FVC, IC/TLC, PaO2, plasma sRAGE, and ACT scores (Table 5).
Table 5
Correlation analyses of various parameters and FeNO levels
ACOS = asthma-chronic obstructive pulmonary disease overlap syndrome, COPD = chronic obstructive pulmonary disease, ACT = Asthma Control Test, CAT = COPD Assessment Test, MPO = sputum myeloperoxidase, NGAL = sputum neutrophil gelatinase-associated lipocalin, sRAGE = plasma soluble receptor for advanced glycation end products, SP-A = plasma surfactant protein A, EOS = induced sputum eosinophil counts, FEV1%pred = percentage of forced expiratory volume in 1 second (FEV1) to predicted value, FEV1/FVC = the ratio of FEV1 to forced vital capacity, IC/TLC = ratio of inspiratory capacity to total lung capacity, RV/TLC = ratio of residual volume to total lung capacity, FeNO = fractional exhaled nitric oxide, PaO2 = arterial oxygen partial pressure, PaCO2 = partial pressure of carbon dioxide in artery, IgE = immunoglobulin E.
![]()
DISCUSSION
ACOS is the most common obstructive airway diseases among adults, causing significant disease burden and substantial effects on patients' health-related quality of life (19). Although ICS treatment is currently recommended for ACOS patients, long-term use of ICS may cause various side effects (56). Therefore, it is necessary to explore possible parameters that could be used to monitor ICS responsiveness in ACOS patients.
FeNO levels have been found to be positively correlated with ACOS severity. The inducible NOS (iNOS) isoform is an NOS isoenzyme that can efficiently catalyze the conversion of FeNO after induction by numerous cytokines and bacterial products such as interleukins (IL)-1β and lipopolysaccharide, consequently producing large amounts of pro-inflammatory NO that has been correlated with eosinophil-mediated airway inflammation in patients with asthma (20). A recent study reported that the FeNO level was persistently increased in asthma patients and could be used as a potentially valuable tool for assessing the severity of asthma (21). Although symptoms and pulmonary function tests are the most accessible clinical markers for assessing asthma control after ICS treatment, resolution of bronchial hyper-responsiveness and airway inflammation usually take longer to identify compared with using symptoms or pulmonary function tests (22). FeNO has been suggested as a potentially valuable tool in the diagnosis and management of asthma and other inflammatory airway diseases (23). Malinovschi et al. (24) provided evidence that FeNO levels might be correlated with an obvious improvement in asthma control after ICS treatment. A previous study noted that a change in FeNO levels exceeding 24% could reflect a measurable change in the disease process in COPD patients (25). FeNO levels, therefore, could be used to monitor ACOS disease severity and minimize the doses of ICS to reduce the side effects associated with ICS treatment. Similar to asthma, COPD is also a disease of airway inflammation, but it is mainly characterized by the inflammatory infiltration of lymphocytes and neutrophils. However, increasing evidence has shown that eosinophils might play a critical role in 10%–40% of COPD patients, implying that FeNO levels would be high in COPD patients (26
); FeNO could be a useful marker in the evaluation of airway inflammation in ACOS patients (10), which is consistent with the results presented here.
Moreover, FeNO levels significantly decreased in the post-treatment groups compared to the corresponding pre-treatment groups, which suggests that the FeNO level could be useful in assessing ICS responsiveness in ACOS patients. ICS are the first-line drugs widely used in the treatment of asthma due to their potent inhibitory effects on airway inflammation (27); of these, glucocorticoids are the most effective anti-inflammatory drugs for controlling eosinophil-mediated diseases. Glucocorticoids inhibit the synthesis and the effects of various cytokines that prolong eosinophil survival, such as IL-3, IL-5 and granulocyte-macrophage colony-stimulating factor, and induce eosinophil apoptosis, which is commonly observed in the sputum and the bronchial submucosa of steroid-treated individuals with asthma (28). Thus, it is possible that ICS could lower the FeNO level by stimulating eosinophil apoptotic death. A recent study found that the FeNO level could be useful in identifying the subgroups that require early ICS intervention and to assess ICS responsiveness in COPD to improve the long-term management of ACOS (10); this provides further evidence to support the results in this study.
The correlation analyses after ICS treatment indicated that FeNO levels were negatively correlated with FEV1%pred, FEV1/FVC, IC/TLC%, PaO2 levels, plasma sRAGE levels, and ACT scores and were positively correlated with RV/TLC%, PaCO2 levels, total serum IgE levels, induced sputum EOS%, plasma SP-A levels, sputum MPO levels, sputum NGAL levels, and CAT scores. FEV1/FVC and FEV1%pred are commonly used in the assessment of airflow limitation (29), while IC/TLC is the best parameter to assess static lung hyperinflation (30) and air trapping (31). PaO2 refers to the tension of oxygen dissolved in plasma, thus reflecting lung oxygenation (32). Circulating sRAGE plays an important role in the development of COPD; a lower level of sRAGE is associated with a higher risk of COPD (33). ACT scores strongly correlate with pulmonary function parameters and health-related quality of life, while lower scores are associated with GINA-defined “not-controlled asthma” (34). IgE is the predominant antibody in the pathogenesis of asthma; higher levels of IgE often occur in patients with asthma (35). Plasma SP-A is involved in surfactant homeostasis and pulmonary host defense increased plasma levels of SP-A are observed in COPD patients (36). Sputum MPO and sputum NGAL have been recognized as 2 biomarkers associated with inflammation and early airway injury; both of these are elevated in ACOS patients (36). CAT scores reflect overall quality of life in patients (3). In patients who received ISC treatment, ACOS was cured or alleviated with improvement in all of the aforementioned parameters; correlations were observed between the FeNO level and various parameters, which supports the use of the FeNO level to assess ICS responsiveness. Although FeNO levels have been reported to be positively correlated with total serum IgE levels (37) and negatively correlated with FEV1/FVC (38), the relationship between FeNO and other parameters has seldom been explored and, therefore, additional studies will be required to validate our results.
In conclusion, our study demonstrated that the FeNO level may accurately predict the efficacy of ICS in the treatment of ACOS patients. However, this study is limited because of the extremely complex mechanisms underlying the development of ACOS as well as the small sample sizes in the subgroups of the case group. It is unrealistic to assess ACOS severity or ICS responsiveness by the FeNO level alone. Further studies with larger sample sizes are needed to validate our results.
 XML Download