

 PDF
PDF ePub
ePub Citation
 Print
Print


INTRODUCTION
Obesity is the most important public health problem that increases the risk of type 2 diabetes, hypertension, cardiovascular disease, cancer, and premature death; and the subsequent financial burden on healthcare systems (1).
In the developed European countries and US, obesity prevalence was remarkably increased in the several decades between the 1970s and 1990s but recently stabilized through the last decade (234). Moreover, based on the trajectory of prevalence of obesity in US and European society, recent studies have indicated an even more significant increase in the prevalence of severe obesity (body mass index [BMI] ≥ 35.0 kg/m2) (5) and this reflects in a rightward shift of the BMI distribution.
On the other hand, the increasing trend in prevalence of obesity in Asian countries is becoming more apparent due to the rapid changes in dietary habits and lifestyles towards a developed country (36). Obesity (BMI ≥ 25.0 kg/m2) prevalence varied differently in each Asia Pacific country ranging from less than 5% in India to 60% in Australia, and the rapid rate of increase in obesity was observed in China and Japan (6). Though it is apparent that obesity is endemic in much of the Asia Pacific region, the recent trends of obesity epidemic has not been well known in each Asian country.
Hence, we performed this study to describe the prevalence of obesity among the adult population in Korea using representative data and to obtain time-trend data over the last 12 years.
MATERIALS AND METHODS
National Health Insurance System (NHIS) in South Korea is a compulsory social insurance system. This NHIS insures about 97% of the population and the remaining population is covered by Medical Aid. The Korean NHIS database consists of Qualification DB, Health Check-up DB, and Claim DB and represents the entire Korean population (7). Among sub-datasets of the NHIS database, we used Qualification DB and Health Check-up DB. Health Check-up DB includes the results from biennial medical examinations of all NHI members older than 40 years and of those who are employed regardless of age (8). The proportion of complete health check-ups was approximately 40% in 2002, whereas it increased up to 68% in 2013 (7). Additional details of the Korean NHIS Database are described elsewhere (9).
The population of this study consisted of Korean adults (≥ 20 years old) who underwent medical examination provided by NHIS from 2002 through 2013. A total of 110,280,952 participants was available in the Health Check-up DB, which included anthropometric data for each participant. The distribution of our study population by gender and age were presented in the Supplementary Table 1.
Anthropometric measurements were conducted with the same protocols based on the Health Screening Implementation Standards provided by Ministry of Health and Welfare. BMI was calculated as measured weight (in kg) divided by measured height (in metres) squared. We used World Health Organization (WHO) BMI cutoffs for adult Asians (10): underweight was defined as BMI < 18.5 kg/m2, normal weight as BMI 18.5–24.9 kg/m2, and obesity as BMI ≥ 25.0 kg/m2. We categorized obesity into the following severity categories: obesity class I: 25.0–29.9 kg/m2; obesity class II: 30.0–34.9 kg/m2; and obesity class III: ≥ 35.0 kg/m2. We mentioned class I obesity as moderate obesity, class II and III as severe obesity, and class III obesity as extreme obesity to prevent confusion.
Analyses were conducted by sex and 10-year age groups. To analyze changes in the age-adjusted prevalence of obesity, we applied the direct standardization method using the 2010 Korean Census population as the standard population. All statistical analyses were conducted using STATA 12 (StataCorp LP, College Station, TX, USA).
RESULTS
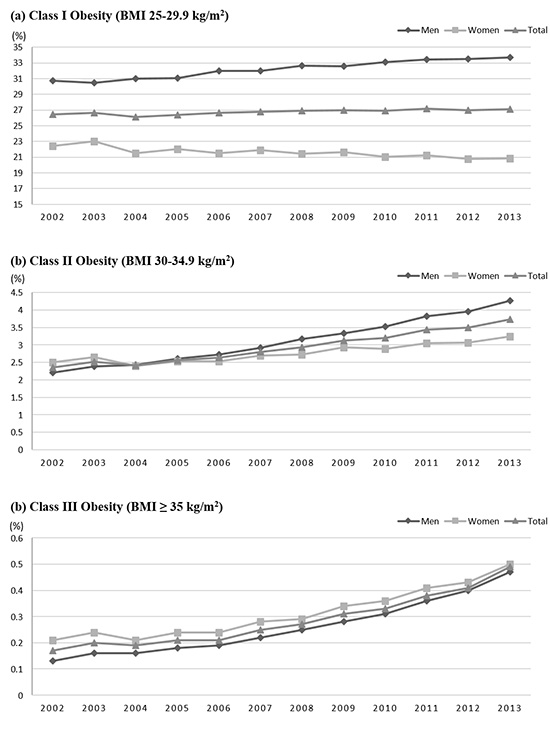
Trends in the age-standardized prevalence of obesity from 2002 to 2013 by sex are presented in Table 1. Among men aged 20 years and older, the prevalence of class I obesity was slightly increased through 2002 to 2010 (30.70% vs. 33.09%) and reached a plateau since 2010. However, class II and class III obesity was rapidly increased and prevalence in 2013 was more than twice the prevalence in 2002. Women also showed rapid increase of class II and III obesity since 2007. However, the prevalence of class I obesity among women, unlike men, continuously decreased from 22.46% in 2002 to 20.88% in 2013. The prevalence of class I obesity was higher in men than in women but the prevalence of class III obesity was higher in women than in men.
Table 1
Trends in the prevalence of underweight, normal weight, and obesity for adults aged 20 years and older: KNHID, 2002–2013
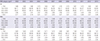
Values are presented as percentage.
KNHID = Korea National Health Insurance Database, BMI = body mass index.
![]()
Fig. 1 showed trends in obesity from 2002 to 2013 in both men and women by age groups. Over 12 years, the prevalence of class I obesity among men was highest in the 50s age groups but those of class II and III obesity was highest in the 30s and 20s age groups, respectively. On the other hand, women in their 60s showed highest prevalence of class I and II obesity from 2002 to 2013. Class III obesity prevalence was highest in women aged 50–59 in 2002 but was highest in women aged 30–39 and 20–29 in 2013. A clear, rapid rise in class II and III of obesity continued from 2002 through 2013 in both men and women in their 20s and 30s.
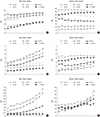 | Fig. 1Age-stratified trends in the prevalence of class I, II, and III obesity for adults aged 20 years and older by sex: KNHID, 2002–2013. Obesity was categorized into the following severity categories: obesity class I: 25.0–29.9 kg/m2; obesity class II: 30.0–34.9 kg/m2; and obesity class III: ≥ 35.0 kg/m2.
KNHID = Korea National Health Insurance Database, BMI = body mass index.
|
DISCUSSION
Our study showed that plateaued trends in the prevalence of moderate obesity and dramatic increasing trends in severe obesity over 12 years in Korean adults.
In this study, the prevalence of obesity among men might have slightly increased from 2002 to 2010 and then stabilized from 2010 to 2013, while the prevalence of obesity among women generally decreased across all the years examined. These trends were similar to results from the study using the Korea Nation Health and Nutrition Examination Survey (KNHANES) 1998, 2005, and 2007 to 2009 (1112). When compared with obesity trends in the East Asia countries, our result was very similar to China (13) but differed from Japan (14). Lao et al. (13) reported the prevalence of obesity in China changed very little from 2002 to 2010, although earlier studies using data before 2000 suggested strongly increasing trends in Chinese adults (215). However, Japan showed that the percentages of obesity are increasing in men but not in women in all age groups (14).
It is noteworthy that severe obesity increased almost 1.5 times in men and tripled in women from 2002 through 2013 in this study. The obesity epidemic in developed countries, such as Australia, Europe, Russia, and the USA has slowed down or stabilized since the 2000s but severe obesity has increased very fast (16). In Asian studies in the early 2000s, prevalence of severe obesity was 2.4% of men and 3.4% of women in China, 2.3% and 3.4% in Japan, and 6.3% and 7.4% in Singapore, respectively (6). Though the overall prevalence of morbid obesity remains low in comparison with the USA, we should take note of a dramatic rise of severe obesity. Patients with morbid obesity have had a higher risk for type 2 diabetes and coronary heart disease than patients with mild obesity (17). Therefore, increasing severe obesity at a faster rate is of importance for future burden of obesity-related morbidity and mortality.
Another remarkable finding in our study was faster rise of morbid obesity in younger adults. Moreover, the prevalence of extreme obesity in 2013 was highest in ages 20 to 29 and ages 30 to 39 among both men and women. In the USA, adults ages 40 to 59 have higher obesity as well as severe obesity than other age groups, but increasing trends of severe obesity at a faster rate in young adults were quite similar to Korea. An increased trend in morbid obesity in young Korean adults may be explained by the fact that adolescents with obesity who were exposed to a dramatic increase in fast food consumption (18) and in snacks high in fat and sugar (19) and to sedentary lifestyle and sleep deprivation (20) due to excessive private education (21) and increase in automobile use now became adults in their 20s and 30s. Therefore, public awareness, intervention, and prevention of obesity should be focused on adolescents and young adults.
The present study has several limitations. We failed to provide obesity trends before 2002. Second, the possibility of selection bias associated with relatively lower proportion of complete health check-ups in 2002 should be considered. Additionally, general health check-up was limited to employee subscribers in their 20s and 30s. Therefore, it is difficult to argue that they are completely representative of individuals in their 20s and 30s, although our study subjects aged 40 years and older are representative.
However, our study also has several strengths. First, we used nationally representative data over 12 years, which included consistent anthropometric measurements of height and weight by the same protocols. Second, to the best of our knowledge, this is the largest and most recent study to investigate the trends of obesity in Korea.
In summary, we investigated obesity trends in Korean adults from 2002 to 2013 and observed that moderate obesity was stabilized but severe obesity was rapidly increased, especially in young adults. Steep rise of severe obesity as well as potentially right shifting of the obese category in Korea seems to take after obesity trends in the USA. Therefore, there should be wider discussion of whether existing diagnostic criteria for obesity in Asians remain unchanged. In addition, considering fast rise in prevalence of morbid obesity in young adults, further studies exploring factors causing these trends are needed to establish a long-term policy for lowering future burden on health care system.
 XML Download