

 PDF
PDF ePub
ePub Citation
 Print
Print


INTRODUCTION
Insulin resistance, characterized by a decrease in cell sensitivity to insulin, is one of the leading causes of metabolic abnormalities. Considering metabolic abnormalities at a young age increase the risk of cardiovascular diseases during adulthood, it is critical to diagnose insulin resistance in adolescents.
Insulin resistance can be measured directly using the pancreatic suppression test, the hyperinsulinemic-euglycemic clamp technique, or the minimal model approximation of the metabolism of glucose (1234). These tests are invasive, complicated, and cost-intensive procedures; therefore, simpler, indirect methods have been proposed for use in epidemiological and clinical studies. Homeostasis model assessment of insulin resistance (HOMA-IR), derived from the product of the fasting levels of insulin and glucose, is a robust tool used as a surrogate measure for insulin resistance (5678). Several population based studies were conducted to establish cut-off values of HOMA-IR using receiver operating characteristic (ROC) curves for metabolic syndrome for the clinical usefulness (91011121314). Since the measurement of fasting insulin is cumbersome with no standard assay available, an insulin-free equation for estimating insulin resistance was sought and developed. In 2010, the product of the fasting levels of triglycerides and glucose (TyG), the so-called triglycerides and glucose index (TyG index), was suggested as a useful surrogate measure for insulin resistance in healthy adults (15). However, data for adolescents are lacking and a cut-off value has yet to be determined.
The aim of this study was to find ethnic- and gender-specific characteristics of TyG index in a representative sample of Mexican American, Non-Hispanic White, Non-Hispanic Black, and Korean adolescents and to establish valid cut-off values for metabolic abnormalities.
MATERIALS AND METHODS
Study population
US data were collected from the National Health and Nutrition Examination Survey (NHANES) from 1999 to 2012. A total of 71,916 individuals participated in the survey during this period. The following participants were excluded from the present study: subjects with incomplete data (demographic, anthropometric, or laboratory), subjects under 12 or over 19 years of age, subjects who did not fast for at least 8 hours prior to testing, pregnant females, and subjects who had received steroids, hormones, or medication for dyslipidemia, diabetes mellitus, or cancer. The total number of eligible participants was 3,164.
Korean data were collected from public-use datasets of the Korean National Health and Nutrition Examination Survey (KNHANES), conducted by the Korean Centers for Disease Control and Prevention (KCDC) for non-institutionalized Korean civilians between 2005 and 2013. The KNHANES is a cross-sectional and nationally representative survey with a multistage and stratified sample design. A total of 92,568 individuals participated in the survey during this period and the number of eligible participants for the present study was 4,873. Exclusion criteria were subjects with incomplete data (demographic, anthropometric, or laboratory), subjects under 12 or over 19 years of age, subjects who did not fast for at least 8 hours before testing, pregnant females, subjects who received medication for diabetes mellitus or asthma.
Measurement of metabolic risk factors
In the NHANES, waist circumference (WC) was measured using flexible tape between the uppermost lateral border of right ilium and that of left ilium. Blood pressure (BP) was measured 3 times in the sitting position after at least 5 minutes of rest. The average of the 3 recorded systolic and diastolic BP values was used in the analyses. Fasting plasma concentrations of triglycerides and high-density lipoprotein cholesterol (HDL-C) were measured according to standard procedures using an Hitachi 704 analyzer (Hitachi, Tokyo, Japan) from 1999 to 2004, an Hitachi 912 analyzer (Hitachi) from 2005 to 2006, and a Roche/Hitachi modular P chemistry analyzer (Roche Diagnostics GmbH, Mannheim, Germany) from 2007 to 2012. For accuracy and consistency in each survey, we used the corrected HDL-C values proposed in the dataset. Fasting plasma concentrations of glucose were measured using a Cobas Mira Chemistry system (Roche, Basel, Switzerland) from 1999 to 2004, a Roche 911 (Roche) from 2005 to 2006, and a Roche/Hitachi modular P chemistry analyzer (Roche Diagnostics GmbH) from 2007 to 2012. For accuracy and consistency in each survey, we followed Centers for Disease Control and Prevention (CDC) guidelines that recommend the use of corrected fasting plasma glucose concentration and corrected HDL-C values in the NHANES data from 1999 to 2005 (161718). The conversion equations were as follows:
Corrected HDL = [(Solomon Park assigned HDL value) × (Participant HDL)]/(Quality Control HDL value associated with participant sample)]
Corrected glucose concentration = glucose concentration (NHANES 2005–2006) + 1.148
Corrected glucose concentration = 0.9815 × glucose concentration (NHANES 1999–2004) + 4.7187
In the KNHANES, WC was measured using a flexible tape at the narrowest point between the lowest border of the rib cage and the uppermost lateral border of the iliac crest at the end of normal expiration. BP was measured 3 times in the sitting position after at least 5 minutes of rest. The average of the 3 recorded systolic and diastolic BP values was used in the analyses. After an 8 hour overnight fast, a venous blood sample was collected and transported to the Central Laboratory (SEOUL Medical Science Institute, Seoul, Korea in 2007; NEODIN Medical Institute, Seoul, Korea in 2008–2010). The fasting concentrations of glucose, triglycerides, and HDL-C were measured according to standard procedures using an ADIVIA 1650 (Siemens, Washington, D.C., USA) from 2005 to 2007 and a Hitachi Automatic Analyzer 7600 (Hitachi) from 2008 to 2013. For accuracy and consistency in each survey, the KCDC guidelines recommend using corrected fasting HDL-C concentration in the KNHANES data from 2005 to 2013 using the following conversion equations (1920).
Corrected HDL-C = 1.160 × HDL-C (KNHANES 2005) ‒ 1.800
Corrected HDL-C = 0.989 × HDL-C (KNHANES 2007) + 6.162
Corrected HDL-C = 0.872 × HDL-C (KNHANES 2008–2011) + 2.460
Corrected HDL-C = 0.952 × HDL-C (KNHANES 2012–2013) + 1.096
Definitions
There is no consensus regarding the diagnosis of metabolic syndrome in adolescents. In the present study, we used 3 different definitions for metabolic syndrome, 2 proposed by Cook et al. (21) and de Ferranti et al. (22) and based on the criteria of the NCEP/ATP III modified for pediatric age; the third definition was proposed by the International Diabetes Federation (IDF) (23). Definitions are summarized in Table 1.
Table 1
Definitions for metabolic syndrome in adolescents
| Criteria/components | Cook et al. (21) | de Ferranti et al. (22) | IDF (10- < 16 years)* |
|---|---|---|---|
| Central obesity (WC) | ≥ 90th percentile | ≥ 75th percentile | ≥ 90th percentile |
| Glucose, mg/dL | ≥ 110 | ≥ 110 | ≥ 100 |
| BP | ≥ 90th percentile | ≥ 90th percentile | SBP ≥ 130 mmHg |
| DBP ≥ 85 mmHg | |||
| Triglycerides, mg/dL | ≥ 110 | ≥ 100 | ≥ 150 |
| HDL-C, mg/dL | ≤ 40 | Girls < 50 | < 40 |
| Boys < 45 | |||
| Definition for metabolic syndrome | 3 or more among the 5 criteria | 3 or more among the 5 criteria | Central obesity and the presence of 2 or more other criteria |
IDF = International Diabetes Federation, WC = waist circumference, BP = blood pressure, SBP = systolic blood pressure, DBP = diastolic blood pressure, HDL-C = high-density lipoprotein cholesterol.
*For adolescents older than 16 years, the IDF adult criteria were used.
![]()
The standard formula for TyG index was as follows:
TyG index = ln [fasting glucose (mg/dL) × triglycerides (mg/dL)/2]
Statistical analysis
Data, including the demographic data, medical condition, anthropometric, and clinical measures, as well as, laboratory results, are presented as the mean and standard deviation, or prevalence (%) and 95% confidence interval (CI). The independent sample t-test was used to compare continuous variables and Pearsonf's χ2 test was used to compare proportions according to ethnicities and gender. TyG index is presented in 10th percentiles by gender and ethnicity. Data were analyzed with sampling weights to account for multistage and stratified sampling. To estimate valid cut-off values, TyG index was analyzed using multivariate logistic regression analysis and the ROC curve for metabolic syndrome. Several studies have reported that several surrogate measures behave differently according to gender and ethnicity (924); therefore, data were analyzed separately for gender and ethnicity. The estimated cut-off values were determined using the highest score of the Youden index in a sensitivity dominant area. Analyses were performed using SPSS version 21.0 software (IBM, Armonk, NY, USA).
RESULTS
Baseline characteristics
Overall, data from 3,164 participants (1,673 males and 1,491 females) from the US and 4,873 participants (2,590 males and 2,283 females) from Korea were assessed. The anthropometric, clinical, and biochemical characteristics of the participants by ethnicities and gender are summarized in Table 2. Non-Hispanic Black adolescents also had significantly lower mean values of triglyceride and higher mean values of HDL-C than other ethnicities in the US. Korean adolescents had similar mean values of triglyceride and HDL-C with Mexican American and Non-Hispanic White adolescents. Using the definitions proposed by Cook et al. (21) and de Ferranti et al. (22), Non-Hispanic Black adolescents had the lowest prevalence of metabolic syndrome compared to other ethnicities. The prevalence of metabolic syndrome, as defined by IDF, however, was lower in Korean adolescents than those in other ethnicities.
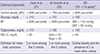
Table 2
General characteristics of the participants by ethnicity and gender
| Parameters | NHANES | KNHANES | ||||||||||
|---|---|---|---|---|---|---|---|---|---|---|---|---|
| Mexican American (n = 1,172) | Non-Hispanic White (n = 978) | Non-Hispanic Black (n = 1,014) | Korean (n = 4,873) | |||||||||
| Male (n = 586) | Female (n = 586) | P value | Male (n = 517) | Female (n = 461) | P value | Male (n = 570) | Female (n = 444) | P value | Male (n = 2,590) | Female (n = 2,283) | P value | |
| Age, yr | 15.0 ± 2.3 | 14.8 ± 3.0 | 0.329 | 15.2 ± 2.2 | 15.0 ± 2.3 | 0.292 | 15.1 ± 2.2 | 14.8 ± 1.9 | 0.013 | 15.0 ± 2.2 | 15.0 ± 2.3 | 0.360 |
| WC, cm | 83.8 ± 17.5 | 81.9 ± 19.7 | 0.044 | 80.9 ± 16.4 | 79.6 ± 14.6 | 0.106 | 78.8 ± 19.6 | 81.4 ± 19.7 | 0.010 | 72.9 ± 12.7 | 68.4 ± 10.0 | < 0.001 |
| BMI, kg/m2 | 24.0 ± 6.7 | 23.9 ± 8.3 | 0.803 | 22.8 ± 6.0 | 22.8 ± 5.2 | 0.847 | 23.4 ± 7.5 | 25.3 ± 7.7 | < 0.001 | 21.3 ± 4.7 | 20.8 ± 4.0 | < 0.001 |
| BMI Z-score | 0.7 ± 1.8 | 0.7 ± 1.7 | 0.705 | 0.4 ± 1.3 | 0.4 ± 1.1 | 0.980 | 0.5 ± 1.4 | 0.9 ± 1.2 | < 0.001 | −0.19 ± 1.26 | 0.03 ± 1.38 | 0.221 |
| SBP, mmHg | 111.9 ± 12.4 | 105.5 ± 10.4 | < 0.001 | 111.4 ± 13.3 | 105.8 ± 11.4 | < 0.001 | 114.1 ± 12.1 | 109.0 ± 12.0 | < 0.001 | 109.4 ± 13.4 | 103.6 ± 11.9 | < 0.001 |
| DBP, mmHg | 57.1 ± 17.3 | 59.9 ± 17.1 | 0.001 | 59.5 ± 14.4 | 62.4 ± 14.1 | < 0.001 | 59.8 ± 16.1 | 61.1 ± 16.7 | 0.125 | 67.8 ± 11.4 | 66.3 ± 10.6 | < 0.001 |
| Fasting glucose, mg/dL | 97.7 ± 11.9 | 94.0 ± 19.6 | < 0.001 | 95.8 ± 7.6 | 92.8 ± 9.2 | < 0.001 | 93.8 ± 7.7 | 90.9 ± 9.6 | < 0.001 | 89.1 ± 8.4 | 87.9 ± 7.9 | < 0.001 |
| HDL-C, mg/dL | 48.9 ± 14.2 | 53.8 ± 15.6 | < 0.001 | 48.5 ± 14.0 | 52.9 ± 12.6 | < 0.001 | 55.0 ± 17.2 | 56.3 ± 15.3 | 0.189 | 46.7 ± 10.6 | 50.5 ± 12.6 | < 0.001 |
| Triglyceride, mg/dL | 93.5 ± 73.7 | 84.9 ± 57.8 | 0.025 | 90.5 ± 66.7 | 83.8 ± 57.1 | 0.077 | 67.7 ± 40.0 | 63.0 ± 34.6 | 0.035 | 86.5 ± 66.0 | 84.8 ± 56.4 | 0.322 |
| TyG index | 8.29 ± 0.74 | 8.17 ± 0.73 | 0.010 | 8.24 ± 0.61 | 8.17 ± 0.58 | 0.057 | 7.90 ± 0.52 | 7.83 ± 0.47 | 0.022 | 8.12 ± 0.64 | 8.11 ± 0.61 | 0.791 |
| Metabolic syndrome, % | ||||||||||||
| Cook et al. (21) | 8.9 (6.6–11.8) | 5.6 (3.7–8.2) | 0.081 | 7.8 (5.8–10.4) | 5.0 (3.2–7.6) | 0.084 | 2.6 (1.5–4.4) | 2.6 (1.4–3.9) | 0.796 | 5.6 (4.7–6.8) | 3.7 (2.8–4.7) | 0.007 |
| de Ferranti et al. (22) | 18.7 (15.5–22.2) | 15.3 (11.7–19.7) | 0.219 | 13.9 (11.0–17.4) | 11.1 (8.4–14.5) | 0.172 | 8.4 (6.2–11.3) | 6.5 (4.4–9.7) | 0.278 | 14.7 (13.1–16.5) | 12.6 (11.0–14.3) | 0.065 |
| IDF | 10.9 (8.1–14.4) | 5.6 (3.8–8.3) | 0.005 | 6.1 (4.2–8.7) | 3.3 (2.0–5.3) | 0.029 | 2.4 (1.4–4.0) | 3.7 (2.3–6.1) | 0.242 | 2.0 (1.4–2.8) | 2.0 (1.4–2.9) | 0.973 |
Data are the means ± SD, except for metabolic syndrome. Data for each metabolic syndrome criterion is provided as a percentage (95% CI).
NHANES = National Health and Nutrition Examination Survey, KNHANES = Korean National Health and Nutrition Examination Survey, WC = waist circumference, BMI = body mass index, SBP = systolic blood pressure, DBP = diastolic blood pressure, HDL-C = high-density lipoprotein cholesterol, TyG = triglycerides and glucose, IDF = International Diabetes Federation, SD = standard deviation, CI = confidence interval.
![]()
Distribution of the TyG index
In NHANES, there were no significant differences in mean values of TyG index between Mexican American and Non-Hispanic White adolescents, and Non-Hispanic Black adolescents had significantly lower mean values of TyG index than Mexican American and Non-Hispanic White adolescents. In KNHANES, Korean adolescents had slightly lower mean values of TyG index than Mexican American and Non-Hispanic White adolescents. The distribution of the TyG index by gender and ethnicity is summarized in Table 3. The values in each 10th percentile in Non-Hispanic Black subjects were significantly lower than for other ethnicities. A modest correlation between the TyG index and HOMA-IR was found (Supplementary Table 1).
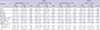
Table 3
The distribution of the TyG index by ethnicity and gender
TyG = triglycerides and glucose, NHANES = National Health and Nutrition Examination Survey, KNHANES = Korean National Health and Nutrition Examination Survey.
![]()
ROC curves of the TyG index for metabolic syndrome
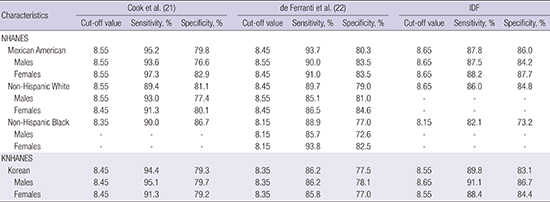
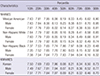
The ROC curves of TyG index for metabolic syndrome in the NHANES and the KNHANES are shown in Fig. 1, stratified by ethnicity. The area under the curve (AUC) using the definition proposed by Cook et al. (21) revealed values of 0.898 (0.869–0.926, P value < 0.001) for Mexican Americans, 0.908 (0.877–0.940, P value < 0.001) for Non-Hispanic Whites, 0.940 (0.909–0.971, P value < 0.001) for Non-Hispanic Blacks, and 0.914 (0.900–0.927, P value < 0.001) for Koreans. The AUC using the definition proposed by de Ferranti et al. (22) was 0.919 (0.901–0.937, P value < 0.001), 0.904 (0.879–0.930, P value < 0.001), 0.897 (0.855–0.938, P value < 0.001), 0.872 (0.857–0.887, P value < 0.001), respectively and the AUC using the definition proposed by IDF was 0.913 (0.874–0.951, P value < 0.001), 0.909 (0.855–0.963, P value < 0.001), 0.845 (0.763–0.927, P value < 0.001), and 0.936 (0.916–0.955, P value < 0.001), respectively. The optimal cut-off value using the definition proposed by Cook et al. (21) was 8.55 for Mexican Americans, 8.55 for Non-Hispanic Whites, 8.35 for Non-Hispanic Blacks, and 8.35 for Koreans. The optimal cut-off value using the definition proposed by de Ferranti et al. (22) was 8.45, 8.45, 8.15, 8.35, respectively and the optimal cut-off value using the definition proposed by IDF was 8.65, 8.65, 8.15, and 8.55, respectively. The cut-off values with their corresponding sensitivity, specificity for metabolic syndrome are summarized in Table 4.
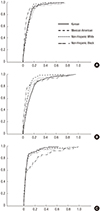 | Fig. 1ROC curves for metabolic syndrome by ethnicity. (A) ROC curves for metabolic syndrome using the criteria of Cook et al. (21). (B) ROC curves for metabolic syndrome using the criteria of de Ferranti et al. (22). (C) ROC curves for metabolic syndrome using the criteria of IDF.
ROC = receiver operating characteristic, IDF = International Diabetes Federation.
|
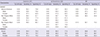
Table 4
The cut-off values of the TyG index for each metabolic syndrome definition by ethnicity and gender
| Characteristics | Cook et al. (21) | de Ferranti et al. (22) | IDF | ||||||
|---|---|---|---|---|---|---|---|---|---|
| Cut-off value | Sensitivity, % | Specificity, % | Cut-off value | Sensitivity, % | Specificity, % | Cut-off value | Sensitivity, % | Specificity, % | |
| NHANES | |||||||||
| Mexican American | 8.55 | 95.2 | 79.8 | 8.45 | 93.7 | 80.3 | 8.65 | 87.8 | 86.0 |
| Males | 8.55 | 93.6 | 76.6 | 8.55 | 90.0 | 83.5 | 8.65 | 87.5 | 84.2 |
| Females | 8.55 | 97.3 | 82.9 | 8.45 | 91.0 | 83.5 | 8.65 | 88.2 | 87.7 |
| Non-Hispanic White | 8.55 | 89.4 | 81.1 | 8.45 | 89.7 | 79.0 | 8.65 | 86.0 | 84.8 |
| Males | 8.55 | 93.0 | 77.4 | 8.55 | 85.1 | 81.0 | - | - | - |
| Females | 8.45 | 91.3 | 80.1 | 8.45 | 86.5 | 84.6 | - | - | - |
| Non-Hispanic Black | 8.35 | 90.0 | 86.7 | 8.15 | 88.9 | 77.0 | 8.15 | 82.1 | 73.2 |
| Males | - | - | - | 8.15 | 85.7 | 72.6 | - | - | - |
| Females | - | - | - | 8.15 | 93.8 | 82.5 | - | - | - |
| KNHANES | |||||||||
| Korean | 8.45 | 94.4 | 79.3 | 8.35 | 86.2 | 77.5 | 8.55 | 89.8 | 83.1 |
| Males | 8.45 | 95.1 | 79.7 | 8.35 | 86.2 | 78.1 | 8.65 | 91.1 | 86.7 |
| Females | 8.45 | 91.3 | 79.2 | 8.35 | 85.8 | 77.0 | 8.55 | 88.4 | 84.4 |
TyG = triglycerides and glucose, IDF = International Diabetes Federation, NHANES = National Health and Nutrition Examination Survey, KNHANES = Korean National Health and Nutrition Examination Survey.
![]()
DISCUSSION
TyG index has been proposed as a good surrogate for insulin sensitivity. It was significantly correlated with total glucose metabolism rates in hyperinsulinemic-euglycemic clamp studies among Mexican and Brazilian populations (142526). A modest correlation between the TyG index and insulin-stimulated glucose uptake during insulin suppression testing has also been reported (27) and several population-based studies have demonstrated the clinical usefulness of the TyG index as a surrogate measure for insulin resistance (28293031).
However, population-based studies of ethnic- and gender-specific characteristics of TyG index in adolescents are lacking; therefore, the present study determined the characteristics of TyG index in a representative sample of Mexican American, Non-Hispanic White, Non-Hispanic Black, and Korean adolescents. In present study, Non-Hispanic Black adolescents had significantly lower TyG indices and a lower prevalence of metabolic syndrome than other ethnicities. This was due to better lipid profiles in Non-Hispanic Black subjects compared to other ethnicities. Several studies have reported similar findings (323334). Interestingly, although Non-Hispanic Black individuals have better lipid profile, several cross-sectional studies have revealed that the prevalence of diabetes, hypertension, obesity, and cardiovascular disease are higher in Non-Hispanic Black individuals compared to Non-Hispanic White individuals (343536373839). The reason for better lipid profiles in Non-Hispanic Black adolescents is unclear. Insulin resistance is a major underlying mechanism of metabolic syndrome and as such, metabolic syndrome adequately reflects the pathologic situation of insulin resistance. For this reason, several population-based studies have used metabolic syndrome as the indicator of insulin resistance and provided cut-off values using ROC curves for metabolic syndrome (91011121314). To determine a valid cut-off value, we also performed ROC curve analysis for metabolic syndrome. As there is no consensus regarding the diagnosis of metabolic syndrome in adolescents, we used 3 metabolic syndrome definitions commonly used in adolescents and estimated cut-off values for each definition.
There was a high AUC of TyG index for each metabolic syndrome definition. This was expected because the TyG index includes TyG in their equations, which are major components of metabolic syndrome. In NHANES, there were no differences in cut-off values between Mexican American and Non-Hispanic White adolescents. Their optimal cut-off value was 8.45, 8.55, and 8.65 for definitions proposed by de Ferranti et al. (22), Cook et al. (21), and IDF, respectively.
However, the cut-off values for Non-Hispanic Black adolescents were markedly lower than those for other ethnicities. The optimal cut-off values were 8.15, 8.35, and 8.15 for definitions proposed by de Ferranti et al. (22), Cook et al. (21), and IDF, respectively. It was presumed that these low cut-off values for Non-Hispanic Black adolescents were owing to the ethnic differences in triglyceride levels. In KHANES, the optimal cut-off value was 8.35, 8.45, and 8.65 for definitions proposed by de Ferranti et al. (22), Cook et al. (21), and IDF, respectively and these values were slightly lower than those in Mexican American and Non-Hispanic White adolescents. This study is the first to estimate cut-off values for TyG index in adolescents; therefore, we cannot compare our results with other studies. The diagnosis of metabolic syndrome in adolescents varies widely and is inconsistent due to the lack of consensus on how to define metabolic syndrome in adolescents (40). Therefore, measurement of insulin resistance can contribute to the diagnosis of metabolic abnormalities in adolescents. Our results are clinically useful for measuring severity of insulin resistance by proposing criteria for metabolic abnormality of TyG index in adolescents.
The present study had several potential limitations. First, the data from US and Korean adolescents may not be comparable because of differing laboratory methods used to determine concentrations of lipids and glucose. Second, sub-group analysis by sexual maturation stage was not conducted because of lack of data. Third, sub-group analysis by gender in Non-Hispanic White and Non-Hispanic Black adolescents was not completely analyzed because of the small sample size. Fourth, although TyG index is significantly correlated with total glucose metabolism rates using the hyperinsulinemic-euglycemic clamp technique in adults, it has not yet been determined in adolescents. With all these limitations, this study is the first to attempt to define the characteristics of TyG index and estimate cut-off values in adolescents by ethnicity and gender.
In conclusion, the cut-off values for TyG index ranged from 8.45 to 8.65 in Mexican American, Non-Hispanic White, from 8.35 to 8.55 in Korean adolescents and from 8.15 to 8.35 in Non-Hispanic Black adolescents. These findings may be clinically useful for evaluating insulin resistance for determining metabolic abnormalities in adolescents. However, to establish more valid cut-off values, further studies, including correlation studies between the TyG index and the gold standard methods for insulin resistance, are needed.
 XML Download