

 PDF
PDF ePub
ePub Citation
 Print
Print


INTRODUCTION
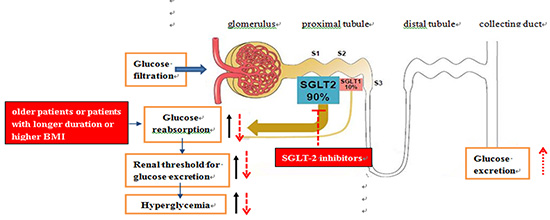
Kidneys play an important role in the regulation of blood glucose (BG) homeostasis through gluconeogenesis, transportation and utilizing glucose from the circulation, reabsorbing glucose from the glomerular filtrate and regulating hormones associated with glucose metabolism (1). The increase of glucose reabsorption in renal tubules is one of the most important pathophysiological mechanisms of type 2 diabetes mellitus (T2DM) (2). Compared with healthy subjects, the renal threshold for glucose excretion (RTG) is increased compensatorily in patients with T2DM (34) through increased glucose reabsorption by up regulating sodium glucose co-transporter 2 (SGLT-2) expression, which will further aggravate hyperglycemia. SGLT-2 inhibitors reduce the plasma glucose levels by inhibiting the reabsorption of glucose in renal proximal tubules and increasing renal glucose excretion, with several favorable features including weight loss and improvement of insulin resistance. However, not all patients can benefit from SGLT-2 inhibitors, therefore it is important to investigate the RTG characteristics of T2DM patients in order to find out the most suitable population of SGLT-2 inhibitors. In this study, we analyzed the characteristics of RTG in patients with T2DM as well as the risk factors for high RTG.
MATERIALS AND METHODS
Subjects
This study enrolled 36 healthy volunteers and 168 patients with T2DM hospitalized in Tianjin Metabolic Disease Hospital affiliated to Tianjin Medical University from March 2011 to November 2015, including 104 males and 100 females. The mean age was 53.52 ± 12.81 years old and the average duration of diabetes was 10.50 ± 7.87 years. The diagnosis of diabetes was in accordance with the World Health Organization (WHO) criteria in 1999. All patients received dynamic BG monitoring. Criteria for exclusion were: patients with inaccurate glucose values by continuous dynamic blood glucose monitoring system (CGMS) (the inconsistent frequency between fingertip BG and CGMS glucose were more than 4 times per day, or the correlation coefficient between the corrected fingertip BG and CGMS glucose was lower than 0.79); patients who were using SGLT-2 inhibitors; patients who were diagnosed with chronic kidney disease: 1) Kidney damage for ≥ 3 months, as defined by structural or functional abnormalities (pathological abnormalities or abnormalities in the composition of the blood or urine, or abnormalities in imaging tests) of the kidney, with or without decreased GFR; 2) GFR < 60 mL/min/1.73 m2 for 3 months, with or without kidney damage (5), acute urinary tract infection, acute fever, diabetic ketosis, diabetic hyperosmolar hyperglycemic state, or other stress conditions and patients who recently underwent surgery, trauma or in pregnancy. This study was approved by the Ethics Committee of Tianjin Metabolic Disease Hospital affiliated to Tianjin Medical University, and all patients signed the informed consent.
Methods
Dynamic BG monitoring
All patients were equipped with a CGMS produced by the American Medtronic MiniMed Company (Northridge, CA, USA) in the stable phase after admission and were monitored for at least 24 consecutive hours. The CGMS sensor was inserted into the abdominal subcutaneous tissue. The effective monitoring range was 39.6–399.6 mg/dL. Inductive probe was placed in the abdominal subcutaneous tissue, which received 1 electrical signal every 10 seconds and computed the average value every 5 minutes and converted it into 1 BG; then 288 BG values were collected after 24 hours. During the monitoring, fingertip BG tested before breakfast, lunch, supper, and bedtime were input into the CGMS to calibrate the CGMS data. The data obtained by CGMS were recorded and analyzed off-line. The average BG during the 24-hour period of monitoring was calculated according to the area under the BG curve (6). Meanwhile the 24-hour urine was collected and urine glucose was detected to calculate the average urinary glucose excretion (UGE) in 24 hours (7).
eGFR evaluating
Estimated glomerular filtration rates (eGFRs) was estimated using Modification of Diet in Renal Disease (MDRD) formula (89):
eGFR (MDRD) = 186 × (Scr/88.4)-1.154 × (age)-0.203 × (0.742 for female) × (eGFR was corrected by hemoglobin A1c [HbA1c])
RTG determining
RTG was calculated according to the following formula (10):

RTG was defined as the glucose concentration below which minimal UGE occurs, and above which UGE rises in proportion to BG. In clinical trials, it is a new method to calculate RTG which has been developed and validated.
Diagnostic criteria for obesity
Obesity or overweight was diagnosed according to the Guidelines for Prevention and Control of Overweight and Obesity in Chinese Adults in 2004: 1) normal: 18.5 kg/m2 ≤ body mass index (BMI) < 24.0 kg/m2; 2) overweight: 24.0 kg/m2 ≤ BMI < 28.0 kg/m2; and 3) obese: BMI ≥ 28.0 kg/m2.
Statistical analysis
Continuous variables available for RTG analysis included age, diabetes duration, mean BG, systolic blood pressure (BP), diastolic BP, BMI, low-density lipoprotein-cholesterol (LDL-C), triglycerides, HbA1c, homeostasis model assessment insulin resistance index (HOMA-IR), and eGFR. Gender was defined as a categorical variable. Data were expressed as either mean ± standard deviation (SD) or median. Independent t-test was used to analyze the difference of normally distributed continuous parameters between 2 groups. One-way analysis of variance was used to analyze the differences among 3 groups. If differences were significant, the least significant difference (LSD)-t test was used for further comparison between 2 groups. Parameters that were not normally distributed were compared using Rank sum test. The χ2 test was used for the comparison of counting data.
Non-conditional logistic regression model was used to evaluate the risk factors of elevated RTG in patients with T2DM. Statistical analysis was performed using IBM SPSS Statistics 20.0 software (SPSS Inc., Chicago, IL, USA). P values less than 0.05 were considered as statistically significant.
RESULTS
Basic characteristics
A total of 204 subjects were included in the study. In healthy subjects, 11.11% had low RTG (< 160 mg/dL), 66.67% had normal RTG (160–180 mg/dL), and 22.22% had high RTG (> 180 mg/dL). In T2DM patients, 41.67% had normal RTG (160–180 mg/dL), whereas 58.33% patients had high RTG (> 180 mg/dL). Basic characteristics of the 2 groups were listed in Table 1. For T2DM patients with high RTG, 34.69% increased by 1%–10%, 18.37% increased by 11%–15% and 46.94% increased by more than 15%. According to the level of the RTG, T2DM patients were divided into 2 groups: normal RTG (160–180 mg/dL) group and high RTG (more than 180 mg/dL) group. Characteristics of the 2 groups were presented in Table 2.
Table 1
Baseline characteristics of healthy group and T2DM group ( ± s)
± s)
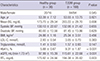
Data are expressed as mean ± SD.
T2DM = type 2 diabetes mellitus, BG = blood glucose, BP = blood pressure, BMI = body mass index, LDL-C = low-density lipoprotein-cholesterol, HbA1c = glycosylated hemoglobin A1c, eGFR = estimated glomerular filtration rate corrected by hemoglobin A1c, RTG = renal threshold for glucose excretion, SD = standard deviation.
Table 2
Baseline characteristics of normal RTG group and high RTG group of T2DM patients ( ± s)
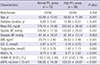
Data are expressed as mean ± SD or medians (range).
RTG = renal threshold for glucose excretion, T2DM = type 2 diabetes mellitus, BG = blood glucose, BP = blood pressure, BMI = body mass index, LDL-C = low-density lipoprotein-cholesterol, HbA1c = glycosylated hemoglobin A1c, HOMA-IR = homeostasis model assessment of insulin resistance, eGFR = estimated glomerular filtration rate corrected by hemoglobin A1c, SD = standard deviation.
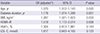
Compared with normal RTG group, patients in high RTG group had a higher level of mean age (50.09 ± 12.42 vs. 56.83 ± 11.84 years, P < 0.05), fasting BG (179.10 ± 10.80 vs. 220.50 ± 26.82 mg/dL, P < 0.001) BMI (23.75 ± 2.90 vs. 26.52 ± 3.48 kg/m2, P < 0.001), HbA1c (8.74% ± 1.36% vs. 9.77% ± 1.63%, P < 0.001), HOMA-IR (1.62 [1.00, 2.49] vs. 2.01 [2.00, 5.18], P < 0.001), and eGFR (106.00 ± 16.26 vs. 122.53 ± 24.67 mL/[min·1.73 m2], P < 0.001). Moreover, patients in high RTG group had a longer duration of diabetes (6.64 ± 5.00 vs. 12.99 ± 8.27 years, P < 0.001) compared with patients in normal RTG group. There were no significant differences in sex, BP, triglyceride, and LDL-C between the 2 groups (P > 0.05) (Table 2).
Risk factors of high RTG
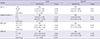
We used a single factor logistic regression model adjusted for sex, age, duration of diabetes, BP, BMI, and the usage of angiotensin-converting-enzyme inhibitor (ACEI) or angiotensin receptor blocker (ARB) to investigate the predictive factors of high RTG which were shown in Table 3. With the increase of age, duration of diabetes, BMI, LDL-C or HOMA-IR, the risk of high RTG increased (odds ratio [OR] = 1.08 for age 95% confidence interval [CI] 1.01–1.15, P < 0.05; OR = 1.15 for diabetes duration, 95% CI 1.03–1.29, P < 0.05; OR = 1.39 for BMI, 95% CI 1.06–1.81, P < 0.05; OR = 2.73 for LDL-C, 95% CI 1.25–5.93, P < 0.05; OR = 1.54 for HOMA-IR, 95% CI 1.13–2.09, P < 0.01).
Table 3
Risk factors for high RTG
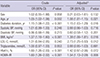
RTG = renal threshold for glucose excretion, OR = odds ratio, CI = confidence interval, ∆ = adjusted for other variables, BP = blood pressure, BMI = body mass index, LDL-C = low-density lipoprotein-cholesterol, HbA1c = glycosylated hemoglobin A1c, HOMA-IR = homeostasis model assessment of insulin resistance.
Multivariate logistic regression analysis showed that age, duration of diabetes, BMI, HOMA-IR were independently associated with high RTG (OR = 1.075 for age, 95% CI 1.012–1.143, P < 0.05; OR = 1.176 for duration of diabetes, 95% CI 1.074–1.289, P < 0.01; OR = 1.287 for BMI, 95% CI 1.021–1.623, P < 0.05; OR = 1.519 for HOMA-IR, 95% CI 1.113–2.074, P < 0.01) (Table 4).
Table 4
Independent risk factors for high RTG
RTG in patients with T2DM stratified by age, duration, BMI, and HOMA-IR
T2DM patients were stratified into sub-groups according to age (≤ 45, 46–59, ≥ 60 years), diabetic duration (≤ 5, 6–9, ≥ 10 years), BMI (18.5–23.9, 24.0–27.9, ≥ 28.0 kg/m2) and HOMA-IR (according to the tertiles). Logistic regression analysis was conducted to determine whether age, diabetes duration, BMI, or HOMA-IR was the risk factors of high RTG. The ORs were calculated with reference to the lowest tertiles of each variable.
As were shown in Table 5 and Fig. 1, along with the increase of age, diabetes duration, BMI or HOMA-IR, the risk of high RTG increased. Age ≥ 60 years, BMI ≥ 28.0 kg/m2 diabetes duration ≥ 10 years, and HOMA-IR 1.1–2.9 were the risk factors of high RTG (OR = 3.24 for age, 95% CI 1.22–8.57, P < 0.05; OR = 6.00 for diabetes duration, 95% CI 2.61–13.82, P < 0.001; OR = 14.63 for BMI, 95% CI 2.99–71.58, P < 0.01; OR = 6.30 for HOMI-IR, 95% CI 1.98–20.03, P < 0.01). After adjusting for sex, BP, LDL-C, triglycerides and HbA1c, the risk factors of high RTG (age, diabetes duration, BMI, and HOMA-IR) did not change.
Table 5
Risk factors of the RTG after stratified by age, diabetes duration, BMI, HOMA-IR
RTG = renal threshold for glucose excretion, OR = odds ratio, CI = confidence interval, ∆ = adjusted for sex, age, diabetes duration, BMI, HbA1c, BP, LDL-C, and Triglycerides, BMI = body mass index, HOMA-IR = homeostasis model assessment of insulin resistance, HbA1c = glycosylated hemoglobin A1c, BP = blood pressure, LDL-C = low-density lipoprotein-cholesterol.
Fig. 1
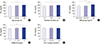
Comparison of RTG in T2DM patients with different age, BMI, diabetic duration, HOMA-IR or LDL-C. (A) Comparison of RTG among T2DM patients with different age (≤ 45, 46–59, ≥ 60 years). RTG was 178.89 ± 15.83, 190.34 ± 23.19, or 201.27 ± 27.78 mg/dL, respectively. (B) Comparison of RTG among T2DM patients with different diabetic duration (≤ 5, 6–9, ≥ 10 years). RTG was 182.61 ± 19.58, 189.62 ± 23.25, or 199.51 ± 23.51 mg/dL, respectively. (C) Comparison of RTG among T2DM patients with different BMI. RTG was 180.65 ± 18.97, 190.26 ± 24.97, or 208.75 ± 20.62 mg/dL, respectively. (D) Comparison of RTG among T2DM patients with different HOMA-IR. RTG was 184.39 ± 15.53, 195.64 ± 23.17, or 200.42 ± 24.94 mg/dL, respectively. (E) Comparison of RTG among T2DM patients with different LDL-C level RTG was 188.47 ± 20.51, 189.92 ± 23.20, or 190.58 ± 18.98 mg/dL, respectively. There was no statistical difference among the 3 groups (P > 0.05).
RTG = renal threshold for glucose excretion, T2DM = type 2 diabetes mellitus, HOMA-IR = homeostasis model assessment insulin resistance index, LDL-C = low-density lipoprotein-cholesterol.
*Significant difference (P < 0.05) was found in patients ≥ 60 years compared to the other groups; Trend test χ2 in Table 4 demonstrated that the RTG increased with age. †Significant difference (P < 0.05) was found between patient with diabetes duration ≥ 10 years and those with shorter duration; Trend test χ2 in Table 4 also demonstrated that the RTG increased with diabetes duration. ‡Significant difference (P < 0.05) was found between obese group and the other 2 groups; Trend test χ2 in Table 4 also showed that the RTG increased with BMI. §Significant difference (P < 0.05) was found between group with HOMA-IR ≥ 3 and the other groups; Trend test χ2 in Table 4 also showed that the RTG increased with HOMA-IR.
DISCUSSION
Kidneys play an important role in regulating glucose homeostasis through glucose filtration in the glumeruli and reabsorption in the proximal renal tubule (1112). Normally, approximately 180 g glucose is filtered through the kidney per day; as much as 90% of filtered glucose is reabsorbed by the S1/S2 segment in the proximal renal tubule, and the remaining 10% is reabsorbed by the S3 segment. The expression of SGLT-2 in S1/S2 segment of the proximal renal tubule plays a major role in glucose reabsorption (1314). Glucose reabsorption in the proximal renal tubule increases with the rising of plasma glucose levels until it reaches the maximum transportation of glucose (Tmax). RTG is the plasma glucose concentration above which the SGLT capacity is saturated and UGE occurs. The RTG is significantly increased in patients with T2DM, and the resulted increase of glucose reabsorption is thought to aggravate hyperglycemia. The up-regulation of SGLT-2 may be one of the key reasons of high RTG in renal tubules (215). SGLT-2 inhibitors lower the plasma glucose concentrations by reducing the reabsorption of filtered glucose and have been proved efficient and safe in patients with T2DM. But the risk factors of high RTG are still not clear. Therefore, we analyzed the characteristics and risk factors of RTG in T2DM patients, which may be helpful in identifying the population who had good reaction to SGLT-2 inhibitors.
The stepwise hyperglycemic clamp procedure (SHCP) is the gold standard for RTG measurement, but it cannot be widely used in the clinical setting because of the complicated procedure. In past studies, RTG was defined as the BG level above which the urine glucose becomes positive, which is obviously not accurate for RTG estimation. Although some studies had already investigated the RTG level in type 2 diabetic patients, the information is limited because of the small sample size. In this study, we studied the characteristics and the impact factors of RTG in a relatively large population using the formula of RTG (10) which is widely accepted. In this study, we combined the formula of RTG with CGMS to calculate the RTG which is more accurate. We found that both the mean level of RTG and the proportion of subjects with high RTG in T2DM group were significantly higher than those in the healthy group. In patients with T2DM, 58.33% had high RTG (higher than 180 mg/dL). Among those with high RTG, 34.69% increased by 1%–10%, 18.37% increased by 11%–15% and 46.94% increased by more than 15%. High RTG will promote the glucose reabsorption in the kidney, which will further aggravate hyperglycemia in T2DM. Therefore, it is particularly important to find out the risk factors leading to high RTG.
We found that with the increase of age, duration of diabetes, BMI, LDL-C, and HOMA-IR, the risk of high RTG increased. Further multivariate logistic regression analysis showed that age, duration of diabetes, BMI, and HOMA-IR were independently associated with the RTG.
BG is closely related to RTG. In T2DM patients, the SGLT-2 expression in renal tubular epithelial cells increases with the increase of glomerular glucose filtration (12), which leads to the elevation of glucose reabsorption in the renal tubules and high RTG; Therefore, a vicious circle is formed since the elevated glucose reabsorption will further aggravate hyperglycemia in patients with T2DM (1316). Hyperfiltration is an independent risk factor for the initiation and progression of nephropathy in type 1 and type 2 diabetes (1718). Researchers proved that patients with HbA1c ≥ 10.5% had significantly higher glomerular glucose filtration rate compared to those with HbA1c < 7.2% (19). SGLT-2 inhibition may represent a novel and safe therapy which simultaneously improves hyperglycemia and hyperfiltration. SGLT-2 inhibition is also proved to have potential renal protective effects in diabetes, which may be explained by its modulation of tubuloglomerular feedback, thereby causing afferent vasoconstriction and reduced hyperfiltration (2021). SGLT-2 inhibition can increase distal tubular Na+ delivery leading to the increase in intracellular Na+ transport into macula densa cells across sodium-potassium-2-chloride channels which requires the membrane depolarization of macula densa cell (22). In T2DM, the SGLT-2 expression and glucose uptake in renal tubular cells are increased, therefore the RTG is elevated (215). Results of eGFR estimated by MDRD formula were corrected by HbA1c as the results were usually overestimated in diabetic patients because of their lower serum creatinine levels. We also found that the glomerular filtration rate increased significantly in patients with elevated RTG. Therefore, we speculated that the hyperfiltration, which is related to hyperglycemia, SGLT-2 expression and RTG, can directly lead to the increase of RTG.
Our study found that RTG increased with the increase of diabetes duration, especially in patients with diabetes duration ≥ 10 years. Moreover, RTG increased with age. RTG in aged patients (≥ 60 years of age) was significantly higher than that in younger patients (≤ 45 years). Continuous hyperglycemia in patients with long diabetic duration or aged patients may increase the glomerular filtration. Therefore, we should pay more attention to the increase of RTG in aged patients or in patients with diabetic duration longer than 10 years.
Increased BMI constitutes a risk factor attributable to the clustering of factors such as hypertension, dyslipidemia, insulin resistance, and other pathophysiological changes. In both diabetic and hypertensive patients, an elevated BMI has shown to be one of the major determinants of glomerular hyperfiltration (2324). Our study found that obesity was a risk factor of high RTG (OR = 1.287, P < 0.05), and the RTG level in obese patients was significantly higher than that in normal or overweight patients. It is proved that obesity increases the glomerular filtration rate, whereas weight loss leads to the attenuation of hyperfiltration in obese patients (25). In addition, obesity can directly increase renal tubular reabsorption (26). All of these may result in the increase of RTG. It is worth to know that ACEI, ARB, or diuretics may reduce the intraglomerular pressure and therefore affect RTG. However, in our group, no significant differences were found in the use of ACEI or ARB treatment between normal RTG group and high RTG group (P = 0.611). Therefore, high RTG in our group cannot be explained by the use of ACEI or ARB.
LDL-C is also a risk factor of diabetic nephropathy. Hyperglycemia accelerates lipid deposition in glomeruli, promotes mesangial cells and extracellular matrix hyperplasia, alters glomerular capillary tension and renal hemodynamics, and finally leads to glomerular hyperfiltration. Lowering LDL-C stabilizes eGFR (27). In our study, we did not find statistical difference in RTG between patients with different LDL-C level. Further studies are needed to assess the association between RTG and LDL-C.
In conclusion, the RTG in patients with T2DM is increased, especially in the elderly, patients with longer duration of diabetes and higher BMI. Based on these results we hypothesize that these people may be more likely to benefit from SGLT-2 inhibitors. Consistent with our results, a study (28) showed that SGLT-2 inhibitors decreased HbA1c greater in patients with a higher baseline BMI. However, a study (29) from Japan showed that dapagliflozin was more effective in young patients (< 40 years) and a meta-analysis (28) also found that HbA1c decreased greater in patients with a lower age and shorter duration of diabetes. We suppose that although older patients and patients with longer diabetes duration possess a higher RTG, they cannot obtain a better effect as their renal structure and function have already changed; besides, for those with long diabetes duration and older age, the failure of β cell function as well as other defects may further impair the therapeutic effect of SGLT-2 inhibitors. Therefore, more studies are needed to uncover the underlying mechanism of this discrepancy.
 XML Download