

 PDF
PDF ePub
ePub Citation
 Print
Print


INTRODUCTION
Mitochondrial DNA (mtDNA) typing is a useful tool in forensic analysis, especially in circumstances where only highly degraded nuclear DNA (nDNA) remain, as well as for understanding maternal lineage in phylogenetic studies (12). MtDNA has several features distinct from nDNA: haploid maternal inheritance, lack of recombination, high copy number, and high levels of diversity (34). Sequence variations are frequently found in the short specific region of mtDNA, so-called hypervariable 1 and 2 (HV1 and HV2) regions, which enable the differentiation of individuals. Some researchers noted that sequence variations outside HV regions are also abundant, and this would increase the power of identification (567). The traditional method for mtDNA analysis, Sanger sequencing, is not only labor intensive but also costly and time consuming. While there have been some attempts to investigate entire mtDNA genome (mtGenome) sequences (589), few complete data sets are available.
The introduction of massively parallel sequencing (MPS) has made mtDNA research more accessible to target whole regions of mtDNA, even with a substantial increase in throughput and depth of coverage (10). For forensic purposes, the MPS sequencing performance has been evaluated (10111213), and data for different ethnic populations have been reported (1014). For example, King et al. (10) differentiated US Caucasian, Hispanic, and African Americans using complete mGenome sequencing. Moreover, another study presented results that showed increased genetic diversity from 95.85% based on the HV1/2 region sequence to 99.67% with MPS in the Estonian population (14). Considering the variation among different ethnic groups, the understanding of genetic diversity for specific populations is mandatory, not only for research but for practical applications such as human identification (15). However, little information is available for the Asian population including Koreans, and only limited information on the control region is available (161718).
In this study, we sequenced the entire mtGenome for 186 Koreans using Ion Torrent Personal Genome Machine (PGM). The most common haplogroups within the Korean population were identified for sampling and the final MPS data was compared with reports from previous studies.
MATERIALS AND METHODS
Sample selection
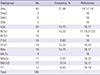
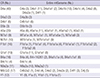
Considering the large number of individual mtDNA haplotypes, it is not plausible to study all of them in MPS works. Focusing on the branching patterns in the phylogenic tree, the most common haplogroups in the Korean population were preferentially considered for sampling based on previous studies and the public mtDNA database (16,17; available at http://www.mtdb.igp.uu.se). A total of 186 Korean blood samples were selected after checking the haplogroups based on HV regions (Table 1). The reasons for sampling each haplogroup are as follows.
Table 1
Haplogroup distribution across 186 Korean individuals in this study
| Haplogroup | No. | Frequency, % | References |
|---|---|---|---|
| D4a | 40 | 27.96 | 161719 |
| D4a3 | 3 | - | 16 |
| D4b1 | 6 | - | 16 |
| D5b | 3 | - | 16 |
| A5a | 20 | 10.75 | 1617 |
| M7a1 | 9 | 10.22 | 17192122 |
| M7b1 | 10 | - | 16 |
| F1b1 | 16 | 8.6 | 16 |
| G1a1 | 19 | 10.22 | 1620 |
| B4a | 16 | 10.75 | 1617 |
| B4c1c | 4 | - | 16 |
| N9a2a | 11 | 5.91 | 1620 |
| M9;G;D | 17 | 9.14 | 1617 |
| Y1 | 12 | 6.45 | 16–18 |
| Total | 186 | - | - |
Macrohaplogroup D, which is most prevalent in the Korean population, could not be compared for detailed subgrouping in the control region using only a limited number of markers (161719). Thus, several sub-types (Haplogroups D4a, D4a3, D4b1, and D5b) were selected for thorough comparison. Moreover, Haplogroups A5a, M7a1, M7b1, F1b1, G1a1, B4a, B4c1c, and N9a2a, which are some of the more frequent subgroups found in Haplogroup A, M7, F, G, B4, and N9a, respectively, were considered for sequencing to represent Korean population data (161719202122). For individuals with macrohaplogroup M9, G, and D who shared common variations on np 16223, 16362, and 489 in the control region, supplementary markers on the coding region can provide additional information for further classification (162324). Additionally, the genetic characteristics in the Jeju islands of Korea might be different from the mainland (18). Because Haplogroup Y is found frequently in the Jeju islands, several samples with Haplogroup Y were tested to investigate the branching of the subgroups.
DNA extraction and entire mtGenome amplification
DNA was extracted from blood using the Maxwell® 16 Blood DNA Purification Kit (Promega, Madison, WI, USA) and Maxwell® 16 instrument (Promega) according to the manufacturer's instructions. Two overlapping amplicons covering the mtGenome were amplified with 15 ng of DNA using the published primer sequences (9) and TaKaRa LA Taq DNA polymerase (Takara Bio Inc., Shiga, Japan) according to the manufacturer's protocol. The purified PCR products using HiYield™ Gel/PCR DNA mini Kit (Real Biotech Corporation, Taipei, Taiwan) were quantified with a NanoDrop 2000 spectrophotometer (Thermo Fisher Scientific, Waltham, MA, USA). Equal amounts of 2 fragments pooled in 20 µL (final concentration of 50 ng/µL) were prepared for the subsequent steps.
Library preparation and sequencing on Ion Torrent PGM
Library construction was performed using the Ion Xpress™ Plus Fragment Library Kit (Thermo Fisher Scientific) and the Ion Xpress Barcode Adapters Kit (Thermo Fisher Scientific) following the manufacturer's instructions. The barcoded libraries were quantified using the Ion Library Quantitation Kit (Thermo Fisher Scientific), and then pooled to a final concentration of 26 pM per target. Emulsion PCR and target enrichment for template preparation were performed according to the manufacturer's protocol, and sequencing reaction was run on PGM. Sixteen pooled samples including control SRM2392 (9947A) were placed on the Ion 316 chip (Thermo Fisher Scientific).
Data analysis
All obtained sequence data was analyzed using Ion Torrent Suite Software Plugins (Thermo Fisher Scientific) and Ion Torrent Browser Variant Caller (Thermo Fisher Scientific) following the manufacturer's recommendations. The output of the variant caller was visualized using the Integrative Genomics Viewer (IGV) tool to eliminate incorrect calls manually and supplement the ignored calls in Variant Call Format (VCF) reports. Haplogroup assignment was processed with MitoTool (http://www.mitotool.org) and HaploGrep2 (25; http://haplogrep.uibk.ac.at) according to the PhyloTree Build 16 database (26; Van Oven et al. 2009). mtDNA MPS raw data in Binary Alignment/Map (BAM) format were also loaded on the mtDNA-Server (27; available at http://mtdna-server.uibk.ac.at) in order to investigate the heteroplasmic variants and confirm the data quality.
RESULTS
Sequencing coverage
Sequencing of the entire mtGenome generated an average of 1,200 X coverage data points per sample for all 186 samples. The reads mapping on revised Cambridge Reference Sequence (rCRS) showed a coverage pattern identical to a previous report across the mtGenome (28). Notably, a section near np 2600 less than 300 bp in size was particularly high, with up to 8,000 X coverage, which was consistent among the tested samples. The region around positions np 13600–14800 was presented as low coverage (< 500X). The above phenomenon was not dependent on the MPS platform, thus might reflect the characteristics of the mtGenome sequence such as the polymeric stretch regions (101328).
Sequence variations
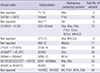
It was noted that representing MPS reads using a graphical viewer was useful to understand MPS data features and interpret the discrepancy of variants calling as well as to discriminate sequencing noise (11). In this study, the variants in the VCF report were confirmed manually using IGV and mtDNA-Server (27). The nucleotide insertions next to np 71, 455, and 573 (71.1G, 455.1T, 573.1C) were not included in the VCF report, but were confirmed from our previous sequencing data (Table 2). Variant 960.1C, 16182C, and 16183C observed in IGV were not listed in the VCF report, but have been confirmed as false negative errors (13). Indel-related alignment errors were also found at np 247 (249del), 513 (523–524del), 2150 (2156.1A), 5894 (5899.1C) and 8270 (8281–8289del). The mixture at np 4248 and 9540 caused by misalignment owing to poly-tracts or indels close to these positions were confirmed as 4248C and 9540C by the mtDNA-Server, respectively. These discrepancies were likely caused by misalignment errors owing to poly-C tract or poly-A tract close to these positions (13). Two positions at np 2478 in 5 samples and 10838 in 20 samples were also observed as a mixture using IGV, but not mtDNA-Server. These observations were presumed to be due to artifacts because of independent specific haplogroups among the samples and the lack of polymeric tracts close to these positions. A tri-allele at np 9824 listed in a previous report (13) was also confirmed in this study. These were the C transition in Haplogroup M7 and the A transition in Haplogroup M9;G;D.
Table 2
Details of miscalled variants on VCF report
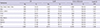
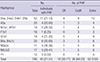
The homoplasmic variant distribution among 186 samples is presented in Table 3. The variants were found in the coding region predominantly (25.90% in the control region and 74.10% in the coding region on average), which was similar to other populations (1014). The proportion of variants within each haplogroup was diverse, particularly the smallest in Haplogroup B4 (39.77% in the control region and 60.23% in the coding region) and the largest in Haplogroup M9;G;D (17.88% in the control region and 82.12% in the coding region).
Table 3
Distribution of homoplasmic variants within control, coding, and entire regions of mtDNA
Several variants were common among the 186 samples. Variants 73G, 263G, 750G, 1438G, 4769G, 7028T, 8860G, 11719A, 14766T, and 15326G were observed in all samples, while variants 489C, 2706G, 8701G, 9540C, 10398G, 10400T, 10873C, 12705T, 14783C, 15043A, 15301A, 16223T, and 16519C were seen in more than half of the samples (data not shown). This finding was very similar to data from 107 Northern Chinese Han individuals (13). In addition, consistent with the Japanese population, 73G was in all the tested samples and 263G, 16223T, and 16362C were frequent (24).
The non-haplogroup-defining variants commonly found in the same haplogroup were investigated. While one variant found in only one sample can be assumed to be an individual spontaneous mutation, a variant found in 2 or more samples would be evidence of a new lineage characterized by that variant (24). There were candidates for 1822C and 9845C (6 samples in Haplogroup G1a1a1), 3395G (2 samples in F1b1a2), 3866C (3 samples in N9a2a), 4113A and 4646C (6 samples in D4b1a1), 5250C (2 samples in A5a), 6524C (2 samples in D4d), 6863G (2 samples in B4+16261), 8595T (2 samples in B4a1c1a), 8619T (2 samples in A5a1a), 9254G (2 samples in G1a1a), 9410G (2 samples in G1a1a), 9494G (2 samples in G1a1a), 11965T (2 samples in Y1), 14926G (2 samples in D4a1), and 15926T (4 samples in B4a). These were indicated as a local or global private mutation according to HaploGrep. Although the individuals with common novel variants were confirmed to be unrelated, more information about common ancestors among them is required. In addition, the observation of variants has to be confirmed repeatedly.
Haplogroup assessment
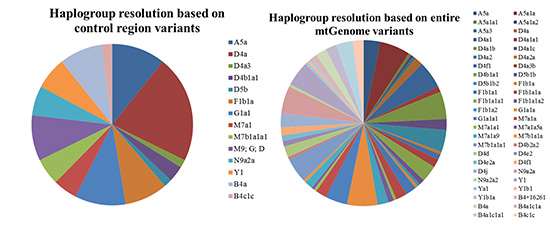
The haplogroups were resolved by entire mtGenome variants based on phylotree 16 using HaploGrep (Table 4). The highest potential for the assignment of subhaplogroups was found in Gaplogroup D4a, which determined D4a, D4a1, D4a1a1, D4a1b, D4a1c, D4a2, D4a2a, and D4f1. Haplogroups D4a1 (27.5%), D4a1b (25.0%), and D4a2 (20.0%) were relatively frequent. There was no additional subgrouping for Haplogroups D4a3, D4b1, and D5b by entire mtGenome variants, and they were designated as D4a3b, D4b1a1, and D5b1b individually. Subgroups for Haplogroups A5a, M7a1, and F1b1 were identified by the coding region variants. Haplogroup A5a was divided into 5 sughaplogroups of A5a, A5a1a, A5a1a1, A5a1a2, and A5a3, and Haplogroups M7a1 and F1b1 were subdivided into 4 subhaplogroups (M7a1a, M7a1a1, M7a1a5a, and M7a1a9) and 6 subhaplogroups (F1b1a, F1b1a1, F1b1a1a, F1b1a1a1, F1b1a1a2, and F1b1a2), respectively. For Haplogroups M7b1a1a1, N9a2a, and B4c1c, sequence variations expected through the phyloTree were only confirmed (4048A, 4164G, 6680C, 12811C, and 10345C). Variants 4793G, 11914A, and 827G played a role in discriminating Haplogroup G1a1a from Haplogroup G1a1a1. Lastly, Haplogroup Y1 was separated into 3 subhaplogroups of Y1a, Y1b1, and Y1b1a, but mostly still remained Y1. Haplogroup assignment based on only control region variants was complex for Haplogroup B4a, but was clearer in some samples with entire mtGenome variants. Thirteen of 16 samples for haplogroup B4a were designated to more than 2 possible haplogroups using MitoTool (B4a; B4a1c1a1; B4i or B4a; B4i), because a missing signature mutation would lead to a more ancestral estimation (13). Using entire mtGenome data, 9 samples could be designated as single haplogroups (B4a; B4a1c1a1; B4i → B4a1c1a1 and B4a; B4i → B4a). According to the results using HaploGrep, 10 samples designated as Haplogroup B4+16261 based on the control region data were subdivided into 4 Haplogroups: B4a, B4+16261, B4a1c1a, or B4a1c1a1. The overall quality scores increased from 0.874 to 0.943 on average for all samples in Haplogroup B4a. Macrohaplogroups M9, G, and D were limited to the use of control region variants for discrimination due to the small variant portion in the control region (1623). For 17 individuals in this study, entire mtGenome variants could be used to identify distinct Haplogroups (D4b2a2, D4d, D4e2, D4e2a, D4f1, and D4j). It was supposed that the identification of coding region sequence variation was significant for Haplogroups M9, G, and D.
Table 4
Haplogroup resolution based on entire mtGenome variants
Point heteroplasmy (PHP)
The PHP was filtered with the following criteria: 1) robust threshold of > 40 X coverage for minor components (29), 2) no reported nuclear insertions of mitochondrial DNA (NUMTs), and 3) reliable PHP according to mtDNA-Server (type = 1) (27). A total of 52 PHPs was found in 40 individuals (21.51% of the total individuals), and distributed in the control and coding regions with 16 PHPs (30.77%) and 36 PHPs (69.23%) (Table 5). Seven individuals had more than 2 PHPs, and one in particular had 5 PHPs. The lowest level of minor components for heteroplasmy was 0.61% (40 X coverage) at np 2561 (an individual with Haplogroup F1b1a1a), and the highest was 45.93% (95 X coverage) at np 13704 (an individual with Haplogroup A5a). PHPs were filtered out due to more than one numt reported. These resided at np 152 and 146, confirmed by capillary electrophoresis (CE) data, and at np 204, 709, 3150, 4218, 9948, 15261, and 15924, identified using IGV.
Table 5
Distribution of PHP
DISCUSSION
The frequent sequence variations seen within the entire mtGenome of this representative Korean population were found to be very similar to those of Japanese and Northern Chinese populations, all of which are, of course, East Asian and share common haplogroup-defining variants (1324). It was expected that we would observe the high resolution of Haplogroup D4, which is predominant in East Asian populations, by identifying sub-lineages (2024), and macrohaplogroups M9, G, and D, the analysis of which was limited to the use of control region variants for discrimination owing to the small degree of variation in the control region; this has been found in a Japanese population, which consisted of 71% macrohaplogroup M in the tested set (n = 270) based on HV1/2 sequence data (24). Generally, it is the case that sequencing of an entire mtGenome is advantageous to obtain more information concerning sequence variations within the coding regions, which can be used to resolve the common haplogroups (1014), but this power seems to be identical among populations that are close to each other genetically.
Haplogroup Y is frequently found on Jeju island, whose population is a small, isolated group that had a limited degree of interaction with other regional groups for a long period of time; thus, one might expect that individuals in this population are closely related to each other genetically. However, it was not easy to discriminate between individuals of Haplogroup Y1 using coding region variants obtained by whole mtGenome sequencing. This could be because of the relatively small sample size in this study, so it may be necessary not only to analyze more samples but also to confirm the degree of genetic relatedness among the tested samples.
The discrimination of PHP in this study was based on criteria put forth in previous literature (2729). However, a direct comparison of our data with that published in other studies is of limited usefulness because PHP identification is likely to be influenced by the threshold for distinguishing authentic low-level heteroplasmy from noise (30). As identification of the distribution and level of mtDNA heteroplasmy in populations can vary based on detection threshold (30), it is necessary to come up with a reliable standard with known patterns of mtDNA heteroplasmy using validated materials (29).
In conclusion, despite rapid progress via MPS technology, entire mtGenome data for Asian populations, including Koreans, seem to be lacking. Although the entire mtGenome of 186 Koreans with common haplogroups were explored using MPS analysis, the number of samples and diversity in individual haplotypes applied in this study may not be sufficient to represent the entire Korean population. However, the results from this study presented the characteristics of Korean mtDNA and these results, when compared with other Asian population data, can be valuable to understand the fact that Asian populations may have originated from very close or common ancestors. This study is expected to be the trigger for the development of Korean specific mtGenome data followed by numerous future studies.
 XML Download